

Key Insights
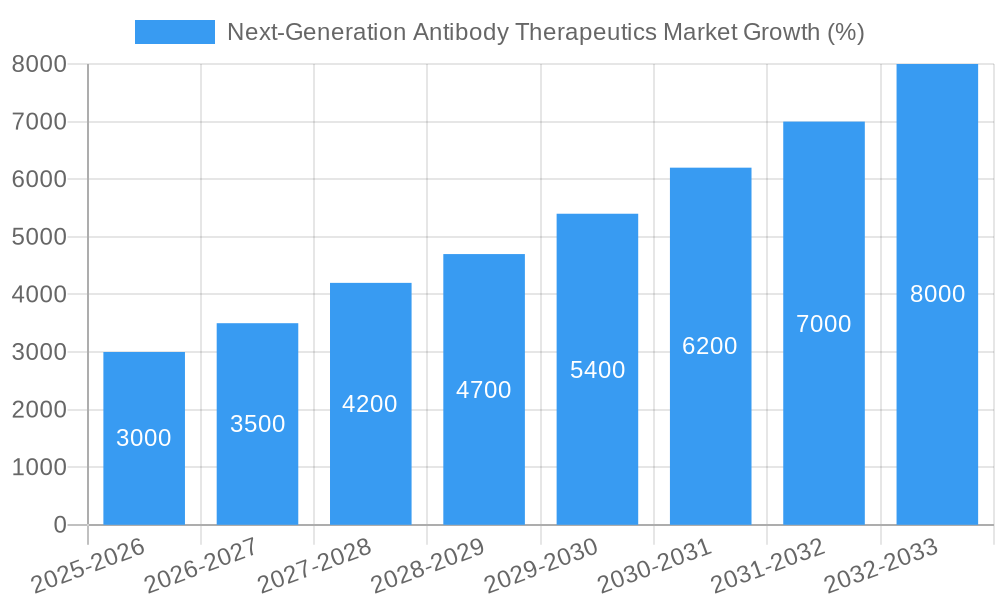
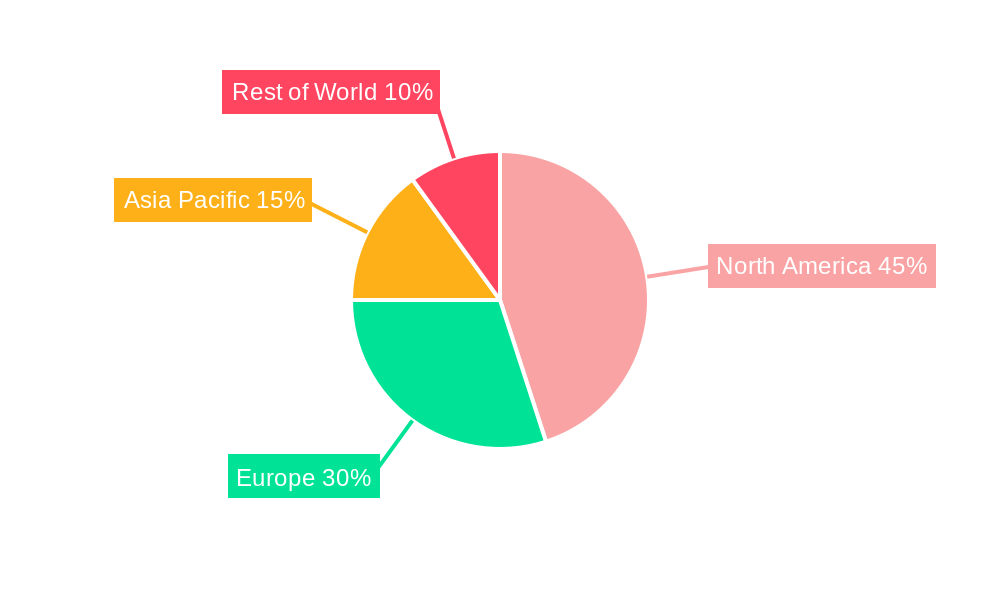
The Next-Generation Antibody Therapeutics market is experiencing robust growth, projected to reach a significant size driven by advancements in antibody engineering and a growing need for effective treatments across various therapeutic areas. The market's Compound Annual Growth Rate (CAGR) of 12.10% from 2019 to 2024 indicates a strong upward trajectory, expected to continue through 2033. Key drivers include the increasing prevalence of chronic diseases like cancer and autoimmune disorders, along with the limitations of traditional antibody therapies. The development of innovative technologies such as Antibody-Drug Conjugates (ADCs), Bispecific Antibodies (BsAbs), and Fc-Engineered Antibodies is fueling this expansion, offering improved efficacy, targeted delivery, and reduced side effects compared to conventional treatments. The Oncology therapeutic area dominates the market, driven by high unmet medical needs and substantial investment in research and development. However, the Autoimmune/Inflammatory segment is also exhibiting considerable growth potential due to the rising incidence of conditions like rheumatoid arthritis and inflammatory bowel disease. Competition is intense, with major pharmaceutical players like Amgen, Roche, and Bristol-Myers Squibb leading the innovation and market share. The geographic distribution reveals strong market presence in North America and Europe, but the Asia-Pacific region is emerging as a key growth area fueled by increasing healthcare spending and rising disease prevalence.
The market segmentation by technology reveals a diverse landscape with each technology segment exhibiting unique growth characteristics. ADCs and BsAbs represent particularly promising areas, given their targeted drug delivery mechanisms and demonstrated clinical success in specific cancer types. The biosimilar antibody market, while facing regulatory and pricing challenges, is poised for growth as patents expire on many blockbuster monoclonal antibodies. Regional growth varies based on factors such as healthcare infrastructure, regulatory environments, and disease prevalence. North America is expected to retain a significant market share owing to its advanced healthcare systems and high research investments. However, the Asia-Pacific region will exhibit faster growth, driven by growing awareness of advanced therapies, increasing disposable incomes, and government initiatives to improve healthcare access. The overall market presents considerable opportunities for industry players focused on innovation, strategic partnerships, and efficient clinical development. However, challenges include the high cost of development, rigorous regulatory hurdles, and potential manufacturing complexities.
Next-Generation Antibody Therapeutics Market: A Comprehensive Report (2019-2033)
This dynamic report provides a deep dive into the rapidly evolving Next-Generation Antibody Therapeutics market, offering invaluable insights for stakeholders across the pharmaceutical and biotech industries. Leveraging extensive market research and data analysis spanning the period 2019-2033 (Base Year: 2025, Forecast Period: 2025-2033), this report presents a detailed analysis of market size, growth trends, key players, and future projections. The report incorporates detailed segmentation analysis across therapeutic areas (Oncology, Autoimmune/Inflammatory) and technologies (Antibody-Drug Conjugates (ADCs), Bispecific Antibodies (BsAbs), Fc-Engineered Antibodies, Antibody Fragments and Antibody-Like Proteins (AF & ALPs), Biosimilar Antibody Products), providing a granular understanding of market dynamics.
Next-Generation Antibody Therapeutics Market Market Structure & Competitive Landscape
The Next-Generation Antibody Therapeutics market is characterized by a moderately concentrated competitive landscape, with a few key players holding significant market share. The Herfindahl-Hirschman Index (HHI) for 2024 is estimated at xx, indicating a moderately concentrated market. Innovation is a primary driver, with continuous research and development efforts leading to the introduction of novel antibody therapeutics with enhanced efficacy and reduced side effects. Stringent regulatory approvals and increasing healthcare costs exert significant influence. Product substitutes, such as small molecule drugs and cell therapies, pose competitive threats, albeit with varying degrees of impact depending on the specific therapeutic area. End-user segmentation is primarily driven by hospitals, clinics, and research institutions. Mergers and acquisitions (M&A) activity has been substantial, with approximately xx M&A deals recorded between 2019 and 2024, resulting in market consolidation and technological advancements. Key trends observed include a focus on personalized medicine, an increased adoption of advanced manufacturing technologies, and ongoing efforts to improve drug delivery systems.
- Market Concentration: Moderately concentrated, HHI (2024): xx
- Innovation Drivers: Continuous R&D, personalized medicine.
- Regulatory Impacts: Stringent approvals, increasing costs.
- Product Substitutes: Small molecule drugs, cell therapies.
- End-User Segmentation: Hospitals, clinics, research institutions.
- M&A Trends: Significant activity (xx deals, 2019-2024), driving consolidation.
Next-Generation Antibody Therapeutics Market Market Trends & Opportunities
The Next-Generation Antibody Therapeutics market is experiencing robust growth, driven by several factors including the increasing prevalence of chronic diseases, advancements in biotechnology, and rising healthcare expenditure. The market is projected to reach xx Million by 2033, exhibiting a Compound Annual Growth Rate (CAGR) of xx% during the forecast period (2025-2033). Technological advancements, such as the development of ADCs and BsAbs, are significantly contributing to market expansion. Consumer preference shifts towards targeted therapies with improved efficacy and reduced side effects also propel market growth. Competitive dynamics are intense, with leading companies engaged in aggressive R&D activities and strategic partnerships to maintain their market position. Market penetration rates vary across different therapeutic areas and technologies, with Oncology and ADCs exhibiting the highest penetration. This is further fueled by favorable regulatory environments in key markets and increasing investments in research and development.
Dominant Markets & Segments in Next-Generation Antibody Therapeutics Market
The Oncology therapeutic area holds the dominant position within the Next-Generation Antibody Therapeutics market, accounting for xx% of the total market value in 2024. Within Oncology, ADCs represent a significant segment, owing to their targeted nature and improved efficacy. Geographically, North America holds the largest market share in 2024, driven by factors such as high healthcare expenditure, robust R&D infrastructure, and favorable regulatory landscape.
- Leading Region: North America
- Dominant Therapeutic Area: Oncology (xx% in 2024)
- Leading Technology: Antibody-Drug Conjugates (ADCs)
Key Growth Drivers for Oncology Segment:
- Extensive research and development in targeted therapies
- High prevalence of various types of cancers
- Favorable regulatory environment for novel cancer drugs.
Key Growth Drivers for North America:
- High healthcare expenditure
- Well-established R&D infrastructure
- Early adoption of advanced therapies
Next-Generation Antibody Therapeutics Market Product Analysis
Next-generation antibody therapeutics represent a significant advancement over traditional monoclonal antibodies, offering enhanced specificity, efficacy, and reduced toxicity. Innovations such as ADCs, BsAbs, and Fc-engineered antibodies provide improved drug delivery mechanisms, enhanced target engagement, and improved immune responses. These advancements have led to the development of novel therapeutic approaches for various diseases, including cancer, autoimmune disorders, and infectious diseases. The market fit for these products is strong, owing to the unmet medical needs across several therapeutic areas and the demonstrated clinical benefits in various clinical trials.
Key Drivers, Barriers & Challenges in Next-Generation Antibody Therapeutics Market
Key Drivers:
The market is driven by factors such as the increasing prevalence of chronic diseases, technological advancements leading to improved efficacy and safety of antibody therapeutics, substantial investments in research and development, and favorable regulatory support for innovative therapies. For instance, the development of ADCs has drastically improved the treatment options for certain types of cancer.
Challenges & Restraints:
High development costs, stringent regulatory pathways, and intense competition among market players represent significant barriers to market growth. Supply chain disruptions can impact manufacturing processes and product availability, while the complex nature of these therapies can make them costly for both patients and healthcare systems. Furthermore, the emergence of resistance mechanisms could limit the long-term efficacy of certain therapies. These challenges affect the overall profitability and market accessibility of next-generation antibody therapeutics.
Growth Drivers in the Next-Generation Antibody Therapeutics Market Market
The rapid growth of the Next-Generation Antibody Therapeutics market is primarily driven by technological innovation. Advancements in antibody engineering, such as the development of ADCs and BsAbs, have significantly enhanced the efficacy and safety profiles of these therapeutics, leading to increased market adoption. Furthermore, the increasing prevalence of chronic diseases, particularly cancer and autoimmune disorders, creates a significant demand for effective treatment options, propelling market expansion. Lastly, favorable regulatory environments and supportive government policies in key markets are also crucial factors contributing to market growth.
Challenges Impacting Next-Generation Antibody Therapeutics Market Growth
Several challenges impede the growth of the Next-Generation Antibody Therapeutics market. High research and development costs are a major barrier, particularly considering the lengthy clinical trial processes and stringent regulatory approvals needed before market entry. The emergence of drug resistance and the potential for adverse events poses significant challenges, demanding further research and development of safer and more effective therapies. Furthermore, intense competition from established pharmaceutical companies and emerging biotechnology firms adds pressure, requiring continuous innovation to stay competitive.
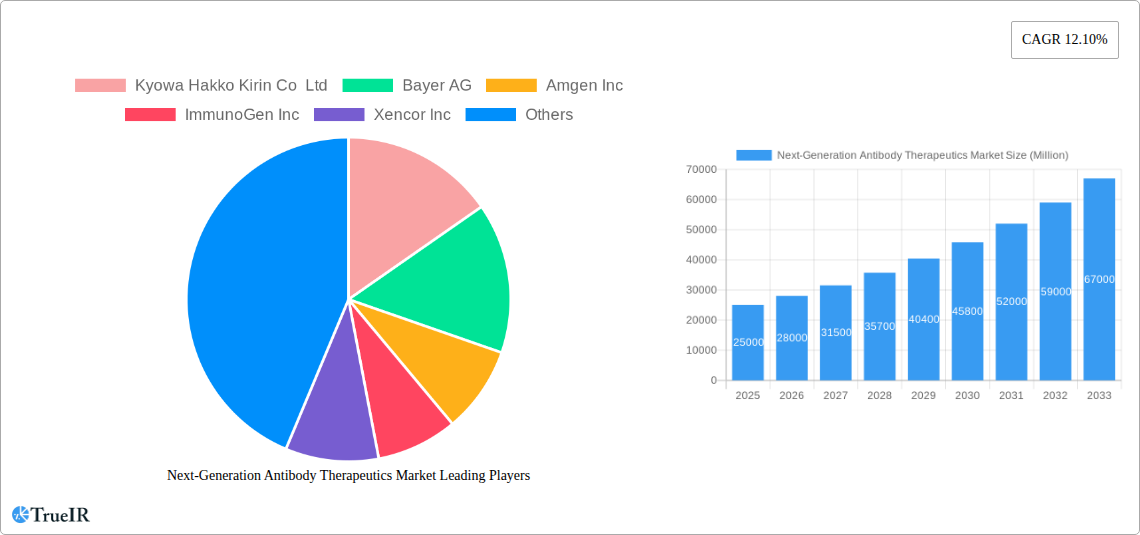
Key Players Shaping the Next-Generation Antibody Therapeutics Market Market
- Kyowa Hakko Kirin Co Ltd
- Bayer AG
- Amgen Inc
- ImmunoGen Inc
- Xencor Inc
- F Hoffmann-La Roche Ltd
- GlaxoSmithKline Plc
- Biogen
- AstraZeneca Plc
- Seagen Inc
- Bristol-Myers Squibb Company
- Pfizer Inc
Significant Next-Generation Antibody Therapeutics Market Industry Milestones
- July 2022: Byondis received biologics license application acceptance from the U.S. FDA for Vic-Trastuzumab Duocarmazine (SYD985), an antibody-drug conjugate, as a treatment for patients with HER2-positive advanced breast cancer. This development signifies a major step forward in the treatment of HER2-positive breast cancer.
- December 2022: Sorrento Therapeutics, Inc. received clearance from the U.S. FDA to initiate clinical trials with its next-generation mRNA (STI-1557) vaccine against SARS-CoV-2 Omicron variants. This underscores the ongoing efforts to develop effective vaccines against emerging viral variants.
Future Outlook for Next-Generation Antibody Therapeutics Market Market
The future of the Next-Generation Antibody Therapeutics market appears bright, fueled by continued technological advancements, increased prevalence of target diseases, and growing investments in research and development. Strategic partnerships and collaborations between pharmaceutical companies and biotechnology firms will further propel market expansion. The market is poised to witness the introduction of innovative antibody-based therapies with improved efficacy, safety, and affordability, leading to enhanced treatment options across various therapeutic areas. The market offers substantial opportunities for players who can successfully navigate the regulatory landscape and deliver safe and effective products to meet the growing unmet medical needs.
Next-Generation Antibody Therapeutics Market Segmentation
-
1. Therapeutic Area
- 1.1. Oncology
- 1.2. Autoimmune/Inflammatory
-
2. Technology
- 2.1. Antibody-Drug Conjugates (ADCs)
- 2.2. Bispecific Antibodies (BsAbs)
- 2.3. Fc-Engineered Antibodies
- 2.4. Antibody
- 2.5. Biosimilar Antibody Products
Next-Generation Antibody Therapeutics Market Segmentation By Geography
-
1. North America
- 1.1. United States
- 1.2. Canada
- 1.3. Mexico
-
2. Europe
- 2.1. Germany
- 2.2. United Kingdom
- 2.3. France
- 2.4. Italy
- 2.5. Spain
- 2.6. Rest of Europe
-
3. Asia Pacific
- 3.1. China
- 3.2. Japan
- 3.3. India
- 3.4. Australia
- 3.5. South Korea
- 3.6. Rest of Asia Pacific
-
4. Middle East and Africa
- 4.1. GCC
- 4.2. South Africa
- 4.3. Rest of Middle East and Africa
-
5. South America
- 5.1. Brazil
- 5.2. Argentina
- 5.3. Rest of South America
Next-Generation Antibody Therapeutics Market REPORT HIGHLIGHTS
| Aspects | Details |
|---|---|
| Study Period | 2019-2033 |
| Base Year | 2024 |
| Estimated Year | 2025 |
| Forecast Period | 2025-2033 |
| Historical Period | 2019-2024 |
| Growth Rate | CAGR of 12.10% from 2019-2033 |
| Segmentation |
|
Table of Contents
- 1. Introduction
- 1.1. Research Scope
- 1.2. Market Segmentation
- 1.3. Research Methodology
- 1.4. Definitions and Assumptions
- 2. Executive Summary
- 2.1. Introduction
- 3. Market Dynamics
- 3.1. Introduction
- 3.2. Market Drivers
- 3.2.1. Increasing Incidence of Cancer; Rising Prevalence of Autoimmune Diseases; Technological Progressions in Antibody Therapeutics
- 3.3. Market Restrains
- 3.3.1. Stringent Regulatory Framework; High costs of Next-Generation Antibody Therapeutics
- 3.4. Market Trends
- 3.4.1. Antibody-Drug Conjugates Segment is Expected to Hold the Largest Market Share in the Next-Generation Antibody Therapeutics Market
- 4. Market Factor Analysis
- 4.1. Porters Five Forces
- 4.2. Supply/Value Chain
- 4.3. PESTEL analysis
- 4.4. Market Entropy
- 4.5. Patent/Trademark Analysis
- 5. Global Next-Generation Antibody Therapeutics Market Analysis, Insights and Forecast, 2019-2031
- 5.1. Market Analysis, Insights and Forecast - by Therapeutic Area
- 5.1.1. Oncology
- 5.1.2. Autoimmune/Inflammatory
- 5.2. Market Analysis, Insights and Forecast - by Technology
- 5.2.1. Antibody-Drug Conjugates (ADCs)
- 5.2.2. Bispecific Antibodies (BsAbs)
- 5.2.3. Fc-Engineered Antibodies
- 5.2.4. Antibody
- 5.2.5. Biosimilar Antibody Products
- 5.3. Market Analysis, Insights and Forecast - by Region
- 5.3.1. North America
- 5.3.2. Europe
- 5.3.3. Asia Pacific
- 5.3.4. Middle East and Africa
- 5.3.5. South America
- 5.1. Market Analysis, Insights and Forecast - by Therapeutic Area
- 6. North America Next-Generation Antibody Therapeutics Market Analysis, Insights and Forecast, 2019-2031
- 6.1. Market Analysis, Insights and Forecast - by Therapeutic Area
- 6.1.1. Oncology
- 6.1.2. Autoimmune/Inflammatory
- 6.2. Market Analysis, Insights and Forecast - by Technology
- 6.2.1. Antibody-Drug Conjugates (ADCs)
- 6.2.2. Bispecific Antibodies (BsAbs)
- 6.2.3. Fc-Engineered Antibodies
- 6.2.4. Antibody
- 6.2.5. Biosimilar Antibody Products
- 6.1. Market Analysis, Insights and Forecast - by Therapeutic Area
- 7. Europe Next-Generation Antibody Therapeutics Market Analysis, Insights and Forecast, 2019-2031
- 7.1. Market Analysis, Insights and Forecast - by Therapeutic Area
- 7.1.1. Oncology
- 7.1.2. Autoimmune/Inflammatory
- 7.2. Market Analysis, Insights and Forecast - by Technology
- 7.2.1. Antibody-Drug Conjugates (ADCs)
- 7.2.2. Bispecific Antibodies (BsAbs)
- 7.2.3. Fc-Engineered Antibodies
- 7.2.4. Antibody
- 7.2.5. Biosimilar Antibody Products
- 7.1. Market Analysis, Insights and Forecast - by Therapeutic Area
- 8. Asia Pacific Next-Generation Antibody Therapeutics Market Analysis, Insights and Forecast, 2019-2031
- 8.1. Market Analysis, Insights and Forecast - by Therapeutic Area
- 8.1.1. Oncology
- 8.1.2. Autoimmune/Inflammatory
- 8.2. Market Analysis, Insights and Forecast - by Technology
- 8.2.1. Antibody-Drug Conjugates (ADCs)
- 8.2.2. Bispecific Antibodies (BsAbs)
- 8.2.3. Fc-Engineered Antibodies
- 8.2.4. Antibody
- 8.2.5. Biosimilar Antibody Products
- 8.1. Market Analysis, Insights and Forecast - by Therapeutic Area
- 9. Middle East and Africa Next-Generation Antibody Therapeutics Market Analysis, Insights and Forecast, 2019-2031
- 9.1. Market Analysis, Insights and Forecast - by Therapeutic Area
- 9.1.1. Oncology
- 9.1.2. Autoimmune/Inflammatory
- 9.2. Market Analysis, Insights and Forecast - by Technology
- 9.2.1. Antibody-Drug Conjugates (ADCs)
- 9.2.2. Bispecific Antibodies (BsAbs)
- 9.2.3. Fc-Engineered Antibodies
- 9.2.4. Antibody
- 9.2.5. Biosimilar Antibody Products
- 9.1. Market Analysis, Insights and Forecast - by Therapeutic Area
- 10. South America Next-Generation Antibody Therapeutics Market Analysis, Insights and Forecast, 2019-2031
- 10.1. Market Analysis, Insights and Forecast - by Therapeutic Area
- 10.1.1. Oncology
- 10.1.2. Autoimmune/Inflammatory
- 10.2. Market Analysis, Insights and Forecast - by Technology
- 10.2.1. Antibody-Drug Conjugates (ADCs)
- 10.2.2. Bispecific Antibodies (BsAbs)
- 10.2.3. Fc-Engineered Antibodies
- 10.2.4. Antibody
- 10.2.5. Biosimilar Antibody Products
- 10.1. Market Analysis, Insights and Forecast - by Therapeutic Area
- 11. North America Next-Generation Antibody Therapeutics Market Analysis, Insights and Forecast, 2019-2031
- 11.1. Market Analysis, Insights and Forecast - By Country/Sub-region
- 11.1.1 United States
- 11.1.2 Canada
- 11.1.3 Mexico
- 12. Europe Next-Generation Antibody Therapeutics Market Analysis, Insights and Forecast, 2019-2031
- 12.1. Market Analysis, Insights and Forecast - By Country/Sub-region
- 12.1.1 Germany
- 12.1.2 United Kingdom
- 12.1.3 France
- 12.1.4 Italy
- 12.1.5 Spain
- 12.1.6 Rest of Europe
- 13. Asia Pacific Next-Generation Antibody Therapeutics Market Analysis, Insights and Forecast, 2019-2031
- 13.1. Market Analysis, Insights and Forecast - By Country/Sub-region
- 13.1.1 China
- 13.1.2 Japan
- 13.1.3 India
- 13.1.4 Australia
- 13.1.5 South Korea
- 13.1.6 Rest of Asia Pacific
- 14. Middle East and Africa Next-Generation Antibody Therapeutics Market Analysis, Insights and Forecast, 2019-2031
- 14.1. Market Analysis, Insights and Forecast - By Country/Sub-region
- 14.1.1 GCC
- 14.1.2 South Africa
- 14.1.3 Rest of Middle East and Africa
- 15. South America Next-Generation Antibody Therapeutics Market Analysis, Insights and Forecast, 2019-2031
- 15.1. Market Analysis, Insights and Forecast - By Country/Sub-region
- 15.1.1 Brazil
- 15.1.2 Argentina
- 15.1.3 Rest of South America
- 16. Competitive Analysis
- 16.1. Global Market Share Analysis 2024
- 16.2. Company Profiles
- 16.2.1 Kyowa Hakko Kirin Co Ltd
- 16.2.1.1. Overview
- 16.2.1.2. Products
- 16.2.1.3. SWOT Analysis
- 16.2.1.4. Recent Developments
- 16.2.1.5. Financials (Based on Availability)
- 16.2.2 Bayer AG
- 16.2.2.1. Overview
- 16.2.2.2. Products
- 16.2.2.3. SWOT Analysis
- 16.2.2.4. Recent Developments
- 16.2.2.5. Financials (Based on Availability)
- 16.2.3 Amgen Inc
- 16.2.3.1. Overview
- 16.2.3.2. Products
- 16.2.3.3. SWOT Analysis
- 16.2.3.4. Recent Developments
- 16.2.3.5. Financials (Based on Availability)
- 16.2.4 ImmunoGen Inc
- 16.2.4.1. Overview
- 16.2.4.2. Products
- 16.2.4.3. SWOT Analysis
- 16.2.4.4. Recent Developments
- 16.2.4.5. Financials (Based on Availability)
- 16.2.5 Xencor Inc
- 16.2.5.1. Overview
- 16.2.5.2. Products
- 16.2.5.3. SWOT Analysis
- 16.2.5.4. Recent Developments
- 16.2.5.5. Financials (Based on Availability)
- 16.2.6 F Hoffmann-La Roche Ltd
- 16.2.6.1. Overview
- 16.2.6.2. Products
- 16.2.6.3. SWOT Analysis
- 16.2.6.4. Recent Developments
- 16.2.6.5. Financials (Based on Availability)
- 16.2.7 GlaxoSmithKline Plc
- 16.2.7.1. Overview
- 16.2.7.2. Products
- 16.2.7.3. SWOT Analysis
- 16.2.7.4. Recent Developments
- 16.2.7.5. Financials (Based on Availability)
- 16.2.8 Biogen
- 16.2.8.1. Overview
- 16.2.8.2. Products
- 16.2.8.3. SWOT Analysis
- 16.2.8.4. Recent Developments
- 16.2.8.5. Financials (Based on Availability)
- 16.2.9 AstraZeneca Plc
- 16.2.9.1. Overview
- 16.2.9.2. Products
- 16.2.9.3. SWOT Analysis
- 16.2.9.4. Recent Developments
- 16.2.9.5. Financials (Based on Availability)
- 16.2.10 Seagen Inc
- 16.2.10.1. Overview
- 16.2.10.2. Products
- 16.2.10.3. SWOT Analysis
- 16.2.10.4. Recent Developments
- 16.2.10.5. Financials (Based on Availability)
- 16.2.11 Bristol-Myers Squibb Company
- 16.2.11.1. Overview
- 16.2.11.2. Products
- 16.2.11.3. SWOT Analysis
- 16.2.11.4. Recent Developments
- 16.2.11.5. Financials (Based on Availability)
- 16.2.12 Pfizer Inc
- 16.2.12.1. Overview
- 16.2.12.2. Products
- 16.2.12.3. SWOT Analysis
- 16.2.12.4. Recent Developments
- 16.2.12.5. Financials (Based on Availability)
- 16.2.1 Kyowa Hakko Kirin Co Ltd
List of Figures
- Figure 1: Global Next-Generation Antibody Therapeutics Market Revenue Breakdown (Million, %) by Region 2024 & 2032
- Figure 2: Global Next-Generation Antibody Therapeutics Market Volume Breakdown (K Unit, %) by Region 2024 & 2032
- Figure 3: North America Next-Generation Antibody Therapeutics Market Revenue (Million), by Country 2024 & 2032
- Figure 4: North America Next-Generation Antibody Therapeutics Market Volume (K Unit), by Country 2024 & 2032
- Figure 5: North America Next-Generation Antibody Therapeutics Market Revenue Share (%), by Country 2024 & 2032
- Figure 6: North America Next-Generation Antibody Therapeutics Market Volume Share (%), by Country 2024 & 2032
- Figure 7: Europe Next-Generation Antibody Therapeutics Market Revenue (Million), by Country 2024 & 2032
- Figure 8: Europe Next-Generation Antibody Therapeutics Market Volume (K Unit), by Country 2024 & 2032
- Figure 9: Europe Next-Generation Antibody Therapeutics Market Revenue Share (%), by Country 2024 & 2032
- Figure 10: Europe Next-Generation Antibody Therapeutics Market Volume Share (%), by Country 2024 & 2032
- Figure 11: Asia Pacific Next-Generation Antibody Therapeutics Market Revenue (Million), by Country 2024 & 2032
- Figure 12: Asia Pacific Next-Generation Antibody Therapeutics Market Volume (K Unit), by Country 2024 & 2032
- Figure 13: Asia Pacific Next-Generation Antibody Therapeutics Market Revenue Share (%), by Country 2024 & 2032
- Figure 14: Asia Pacific Next-Generation Antibody Therapeutics Market Volume Share (%), by Country 2024 & 2032
- Figure 15: Middle East and Africa Next-Generation Antibody Therapeutics Market Revenue (Million), by Country 2024 & 2032
- Figure 16: Middle East and Africa Next-Generation Antibody Therapeutics Market Volume (K Unit), by Country 2024 & 2032
- Figure 17: Middle East and Africa Next-Generation Antibody Therapeutics Market Revenue Share (%), by Country 2024 & 2032
- Figure 18: Middle East and Africa Next-Generation Antibody Therapeutics Market Volume Share (%), by Country 2024 & 2032
- Figure 19: South America Next-Generation Antibody Therapeutics Market Revenue (Million), by Country 2024 & 2032
- Figure 20: South America Next-Generation Antibody Therapeutics Market Volume (K Unit), by Country 2024 & 2032
- Figure 21: South America Next-Generation Antibody Therapeutics Market Revenue Share (%), by Country 2024 & 2032
- Figure 22: South America Next-Generation Antibody Therapeutics Market Volume Share (%), by Country 2024 & 2032
- Figure 23: North America Next-Generation Antibody Therapeutics Market Revenue (Million), by Therapeutic Area 2024 & 2032
- Figure 24: North America Next-Generation Antibody Therapeutics Market Volume (K Unit), by Therapeutic Area 2024 & 2032
- Figure 25: North America Next-Generation Antibody Therapeutics Market Revenue Share (%), by Therapeutic Area 2024 & 2032
- Figure 26: North America Next-Generation Antibody Therapeutics Market Volume Share (%), by Therapeutic Area 2024 & 2032
- Figure 27: North America Next-Generation Antibody Therapeutics Market Revenue (Million), by Technology 2024 & 2032
- Figure 28: North America Next-Generation Antibody Therapeutics Market Volume (K Unit), by Technology 2024 & 2032
- Figure 29: North America Next-Generation Antibody Therapeutics Market Revenue Share (%), by Technology 2024 & 2032
- Figure 30: North America Next-Generation Antibody Therapeutics Market Volume Share (%), by Technology 2024 & 2032
- Figure 31: North America Next-Generation Antibody Therapeutics Market Revenue (Million), by Country 2024 & 2032
- Figure 32: North America Next-Generation Antibody Therapeutics Market Volume (K Unit), by Country 2024 & 2032
- Figure 33: North America Next-Generation Antibody Therapeutics Market Revenue Share (%), by Country 2024 & 2032
- Figure 34: North America Next-Generation Antibody Therapeutics Market Volume Share (%), by Country 2024 & 2032
- Figure 35: Europe Next-Generation Antibody Therapeutics Market Revenue (Million), by Therapeutic Area 2024 & 2032
- Figure 36: Europe Next-Generation Antibody Therapeutics Market Volume (K Unit), by Therapeutic Area 2024 & 2032
- Figure 37: Europe Next-Generation Antibody Therapeutics Market Revenue Share (%), by Therapeutic Area 2024 & 2032
- Figure 38: Europe Next-Generation Antibody Therapeutics Market Volume Share (%), by Therapeutic Area 2024 & 2032
- Figure 39: Europe Next-Generation Antibody Therapeutics Market Revenue (Million), by Technology 2024 & 2032
- Figure 40: Europe Next-Generation Antibody Therapeutics Market Volume (K Unit), by Technology 2024 & 2032
- Figure 41: Europe Next-Generation Antibody Therapeutics Market Revenue Share (%), by Technology 2024 & 2032
- Figure 42: Europe Next-Generation Antibody Therapeutics Market Volume Share (%), by Technology 2024 & 2032
- Figure 43: Europe Next-Generation Antibody Therapeutics Market Revenue (Million), by Country 2024 & 2032
- Figure 44: Europe Next-Generation Antibody Therapeutics Market Volume (K Unit), by Country 2024 & 2032
- Figure 45: Europe Next-Generation Antibody Therapeutics Market Revenue Share (%), by Country 2024 & 2032
- Figure 46: Europe Next-Generation Antibody Therapeutics Market Volume Share (%), by Country 2024 & 2032
- Figure 47: Asia Pacific Next-Generation Antibody Therapeutics Market Revenue (Million), by Therapeutic Area 2024 & 2032
- Figure 48: Asia Pacific Next-Generation Antibody Therapeutics Market Volume (K Unit), by Therapeutic Area 2024 & 2032
- Figure 49: Asia Pacific Next-Generation Antibody Therapeutics Market Revenue Share (%), by Therapeutic Area 2024 & 2032
- Figure 50: Asia Pacific Next-Generation Antibody Therapeutics Market Volume Share (%), by Therapeutic Area 2024 & 2032
- Figure 51: Asia Pacific Next-Generation Antibody Therapeutics Market Revenue (Million), by Technology 2024 & 2032
- Figure 52: Asia Pacific Next-Generation Antibody Therapeutics Market Volume (K Unit), by Technology 2024 & 2032
- Figure 53: Asia Pacific Next-Generation Antibody Therapeutics Market Revenue Share (%), by Technology 2024 & 2032
- Figure 54: Asia Pacific Next-Generation Antibody Therapeutics Market Volume Share (%), by Technology 2024 & 2032
- Figure 55: Asia Pacific Next-Generation Antibody Therapeutics Market Revenue (Million), by Country 2024 & 2032
- Figure 56: Asia Pacific Next-Generation Antibody Therapeutics Market Volume (K Unit), by Country 2024 & 2032
- Figure 57: Asia Pacific Next-Generation Antibody Therapeutics Market Revenue Share (%), by Country 2024 & 2032
- Figure 58: Asia Pacific Next-Generation Antibody Therapeutics Market Volume Share (%), by Country 2024 & 2032
- Figure 59: Middle East and Africa Next-Generation Antibody Therapeutics Market Revenue (Million), by Therapeutic Area 2024 & 2032
- Figure 60: Middle East and Africa Next-Generation Antibody Therapeutics Market Volume (K Unit), by Therapeutic Area 2024 & 2032
- Figure 61: Middle East and Africa Next-Generation Antibody Therapeutics Market Revenue Share (%), by Therapeutic Area 2024 & 2032
- Figure 62: Middle East and Africa Next-Generation Antibody Therapeutics Market Volume Share (%), by Therapeutic Area 2024 & 2032
- Figure 63: Middle East and Africa Next-Generation Antibody Therapeutics Market Revenue (Million), by Technology 2024 & 2032
- Figure 64: Middle East and Africa Next-Generation Antibody Therapeutics Market Volume (K Unit), by Technology 2024 & 2032
- Figure 65: Middle East and Africa Next-Generation Antibody Therapeutics Market Revenue Share (%), by Technology 2024 & 2032
- Figure 66: Middle East and Africa Next-Generation Antibody Therapeutics Market Volume Share (%), by Technology 2024 & 2032
- Figure 67: Middle East and Africa Next-Generation Antibody Therapeutics Market Revenue (Million), by Country 2024 & 2032
- Figure 68: Middle East and Africa Next-Generation Antibody Therapeutics Market Volume (K Unit), by Country 2024 & 2032
- Figure 69: Middle East and Africa Next-Generation Antibody Therapeutics Market Revenue Share (%), by Country 2024 & 2032
- Figure 70: Middle East and Africa Next-Generation Antibody Therapeutics Market Volume Share (%), by Country 2024 & 2032
- Figure 71: South America Next-Generation Antibody Therapeutics Market Revenue (Million), by Therapeutic Area 2024 & 2032
- Figure 72: South America Next-Generation Antibody Therapeutics Market Volume (K Unit), by Therapeutic Area 2024 & 2032
- Figure 73: South America Next-Generation Antibody Therapeutics Market Revenue Share (%), by Therapeutic Area 2024 & 2032
- Figure 74: South America Next-Generation Antibody Therapeutics Market Volume Share (%), by Therapeutic Area 2024 & 2032
- Figure 75: South America Next-Generation Antibody Therapeutics Market Revenue (Million), by Technology 2024 & 2032
- Figure 76: South America Next-Generation Antibody Therapeutics Market Volume (K Unit), by Technology 2024 & 2032
- Figure 77: South America Next-Generation Antibody Therapeutics Market Revenue Share (%), by Technology 2024 & 2032
- Figure 78: South America Next-Generation Antibody Therapeutics Market Volume Share (%), by Technology 2024 & 2032
- Figure 79: South America Next-Generation Antibody Therapeutics Market Revenue (Million), by Country 2024 & 2032
- Figure 80: South America Next-Generation Antibody Therapeutics Market Volume (K Unit), by Country 2024 & 2032
- Figure 81: South America Next-Generation Antibody Therapeutics Market Revenue Share (%), by Country 2024 & 2032
- Figure 82: South America Next-Generation Antibody Therapeutics Market Volume Share (%), by Country 2024 & 2032
List of Tables
- Table 1: Global Next-Generation Antibody Therapeutics Market Revenue Million Forecast, by Region 2019 & 2032
- Table 2: Global Next-Generation Antibody Therapeutics Market Volume K Unit Forecast, by Region 2019 & 2032
- Table 3: Global Next-Generation Antibody Therapeutics Market Revenue Million Forecast, by Therapeutic Area 2019 & 2032
- Table 4: Global Next-Generation Antibody Therapeutics Market Volume K Unit Forecast, by Therapeutic Area 2019 & 2032
- Table 5: Global Next-Generation Antibody Therapeutics Market Revenue Million Forecast, by Technology 2019 & 2032
- Table 6: Global Next-Generation Antibody Therapeutics Market Volume K Unit Forecast, by Technology 2019 & 2032
- Table 7: Global Next-Generation Antibody Therapeutics Market Revenue Million Forecast, by Region 2019 & 2032
- Table 8: Global Next-Generation Antibody Therapeutics Market Volume K Unit Forecast, by Region 2019 & 2032
- Table 9: Global Next-Generation Antibody Therapeutics Market Revenue Million Forecast, by Country 2019 & 2032
- Table 10: Global Next-Generation Antibody Therapeutics Market Volume K Unit Forecast, by Country 2019 & 2032
- Table 11: United States Next-Generation Antibody Therapeutics Market Revenue (Million) Forecast, by Application 2019 & 2032
- Table 12: United States Next-Generation Antibody Therapeutics Market Volume (K Unit) Forecast, by Application 2019 & 2032
- Table 13: Canada Next-Generation Antibody Therapeutics Market Revenue (Million) Forecast, by Application 2019 & 2032
- Table 14: Canada Next-Generation Antibody Therapeutics Market Volume (K Unit) Forecast, by Application 2019 & 2032
- Table 15: Mexico Next-Generation Antibody Therapeutics Market Revenue (Million) Forecast, by Application 2019 & 2032
- Table 16: Mexico Next-Generation Antibody Therapeutics Market Volume (K Unit) Forecast, by Application 2019 & 2032
- Table 17: Global Next-Generation Antibody Therapeutics Market Revenue Million Forecast, by Country 2019 & 2032
- Table 18: Global Next-Generation Antibody Therapeutics Market Volume K Unit Forecast, by Country 2019 & 2032
- Table 19: Germany Next-Generation Antibody Therapeutics Market Revenue (Million) Forecast, by Application 2019 & 2032
- Table 20: Germany Next-Generation Antibody Therapeutics Market Volume (K Unit) Forecast, by Application 2019 & 2032
- Table 21: United Kingdom Next-Generation Antibody Therapeutics Market Revenue (Million) Forecast, by Application 2019 & 2032
- Table 22: United Kingdom Next-Generation Antibody Therapeutics Market Volume (K Unit) Forecast, by Application 2019 & 2032
- Table 23: France Next-Generation Antibody Therapeutics Market Revenue (Million) Forecast, by Application 2019 & 2032
- Table 24: France Next-Generation Antibody Therapeutics Market Volume (K Unit) Forecast, by Application 2019 & 2032
- Table 25: Italy Next-Generation Antibody Therapeutics Market Revenue (Million) Forecast, by Application 2019 & 2032
- Table 26: Italy Next-Generation Antibody Therapeutics Market Volume (K Unit) Forecast, by Application 2019 & 2032
- Table 27: Spain Next-Generation Antibody Therapeutics Market Revenue (Million) Forecast, by Application 2019 & 2032
- Table 28: Spain Next-Generation Antibody Therapeutics Market Volume (K Unit) Forecast, by Application 2019 & 2032
- Table 29: Rest of Europe Next-Generation Antibody Therapeutics Market Revenue (Million) Forecast, by Application 2019 & 2032
- Table 30: Rest of Europe Next-Generation Antibody Therapeutics Market Volume (K Unit) Forecast, by Application 2019 & 2032
- Table 31: Global Next-Generation Antibody Therapeutics Market Revenue Million Forecast, by Country 2019 & 2032
- Table 32: Global Next-Generation Antibody Therapeutics Market Volume K Unit Forecast, by Country 2019 & 2032
- Table 33: China Next-Generation Antibody Therapeutics Market Revenue (Million) Forecast, by Application 2019 & 2032
- Table 34: China Next-Generation Antibody Therapeutics Market Volume (K Unit) Forecast, by Application 2019 & 2032
- Table 35: Japan Next-Generation Antibody Therapeutics Market Revenue (Million) Forecast, by Application 2019 & 2032
- Table 36: Japan Next-Generation Antibody Therapeutics Market Volume (K Unit) Forecast, by Application 2019 & 2032
- Table 37: India Next-Generation Antibody Therapeutics Market Revenue (Million) Forecast, by Application 2019 & 2032
- Table 38: India Next-Generation Antibody Therapeutics Market Volume (K Unit) Forecast, by Application 2019 & 2032
- Table 39: Australia Next-Generation Antibody Therapeutics Market Revenue (Million) Forecast, by Application 2019 & 2032
- Table 40: Australia Next-Generation Antibody Therapeutics Market Volume (K Unit) Forecast, by Application 2019 & 2032
- Table 41: South Korea Next-Generation Antibody Therapeutics Market Revenue (Million) Forecast, by Application 2019 & 2032
- Table 42: South Korea Next-Generation Antibody Therapeutics Market Volume (K Unit) Forecast, by Application 2019 & 2032
- Table 43: Rest of Asia Pacific Next-Generation Antibody Therapeutics Market Revenue (Million) Forecast, by Application 2019 & 2032
- Table 44: Rest of Asia Pacific Next-Generation Antibody Therapeutics Market Volume (K Unit) Forecast, by Application 2019 & 2032
- Table 45: Global Next-Generation Antibody Therapeutics Market Revenue Million Forecast, by Country 2019 & 2032
- Table 46: Global Next-Generation Antibody Therapeutics Market Volume K Unit Forecast, by Country 2019 & 2032
- Table 47: GCC Next-Generation Antibody Therapeutics Market Revenue (Million) Forecast, by Application 2019 & 2032
- Table 48: GCC Next-Generation Antibody Therapeutics Market Volume (K Unit) Forecast, by Application 2019 & 2032
- Table 49: South Africa Next-Generation Antibody Therapeutics Market Revenue (Million) Forecast, by Application 2019 & 2032
- Table 50: South Africa Next-Generation Antibody Therapeutics Market Volume (K Unit) Forecast, by Application 2019 & 2032
- Table 51: Rest of Middle East and Africa Next-Generation Antibody Therapeutics Market Revenue (Million) Forecast, by Application 2019 & 2032
- Table 52: Rest of Middle East and Africa Next-Generation Antibody Therapeutics Market Volume (K Unit) Forecast, by Application 2019 & 2032
- Table 53: Global Next-Generation Antibody Therapeutics Market Revenue Million Forecast, by Country 2019 & 2032
- Table 54: Global Next-Generation Antibody Therapeutics Market Volume K Unit Forecast, by Country 2019 & 2032
- Table 55: Brazil Next-Generation Antibody Therapeutics Market Revenue (Million) Forecast, by Application 2019 & 2032
- Table 56: Brazil Next-Generation Antibody Therapeutics Market Volume (K Unit) Forecast, by Application 2019 & 2032
- Table 57: Argentina Next-Generation Antibody Therapeutics Market Revenue (Million) Forecast, by Application 2019 & 2032
- Table 58: Argentina Next-Generation Antibody Therapeutics Market Volume (K Unit) Forecast, by Application 2019 & 2032
- Table 59: Rest of South America Next-Generation Antibody Therapeutics Market Revenue (Million) Forecast, by Application 2019 & 2032
- Table 60: Rest of South America Next-Generation Antibody Therapeutics Market Volume (K Unit) Forecast, by Application 2019 & 2032
- Table 61: Global Next-Generation Antibody Therapeutics Market Revenue Million Forecast, by Therapeutic Area 2019 & 2032
- Table 62: Global Next-Generation Antibody Therapeutics Market Volume K Unit Forecast, by Therapeutic Area 2019 & 2032
- Table 63: Global Next-Generation Antibody Therapeutics Market Revenue Million Forecast, by Technology 2019 & 2032
- Table 64: Global Next-Generation Antibody Therapeutics Market Volume K Unit Forecast, by Technology 2019 & 2032
- Table 65: Global Next-Generation Antibody Therapeutics Market Revenue Million Forecast, by Country 2019 & 2032
- Table 66: Global Next-Generation Antibody Therapeutics Market Volume K Unit Forecast, by Country 2019 & 2032
- Table 67: United States Next-Generation Antibody Therapeutics Market Revenue (Million) Forecast, by Application 2019 & 2032
- Table 68: United States Next-Generation Antibody Therapeutics Market Volume (K Unit) Forecast, by Application 2019 & 2032
- Table 69: Canada Next-Generation Antibody Therapeutics Market Revenue (Million) Forecast, by Application 2019 & 2032
- Table 70: Canada Next-Generation Antibody Therapeutics Market Volume (K Unit) Forecast, by Application 2019 & 2032
- Table 71: Mexico Next-Generation Antibody Therapeutics Market Revenue (Million) Forecast, by Application 2019 & 2032
- Table 72: Mexico Next-Generation Antibody Therapeutics Market Volume (K Unit) Forecast, by Application 2019 & 2032
- Table 73: Global Next-Generation Antibody Therapeutics Market Revenue Million Forecast, by Therapeutic Area 2019 & 2032
- Table 74: Global Next-Generation Antibody Therapeutics Market Volume K Unit Forecast, by Therapeutic Area 2019 & 2032
- Table 75: Global Next-Generation Antibody Therapeutics Market Revenue Million Forecast, by Technology 2019 & 2032
- Table 76: Global Next-Generation Antibody Therapeutics Market Volume K Unit Forecast, by Technology 2019 & 2032
- Table 77: Global Next-Generation Antibody Therapeutics Market Revenue Million Forecast, by Country 2019 & 2032
- Table 78: Global Next-Generation Antibody Therapeutics Market Volume K Unit Forecast, by Country 2019 & 2032
- Table 79: Germany Next-Generation Antibody Therapeutics Market Revenue (Million) Forecast, by Application 2019 & 2032
- Table 80: Germany Next-Generation Antibody Therapeutics Market Volume (K Unit) Forecast, by Application 2019 & 2032
- Table 81: United Kingdom Next-Generation Antibody Therapeutics Market Revenue (Million) Forecast, by Application 2019 & 2032
- Table 82: United Kingdom Next-Generation Antibody Therapeutics Market Volume (K Unit) Forecast, by Application 2019 & 2032
- Table 83: France Next-Generation Antibody Therapeutics Market Revenue (Million) Forecast, by Application 2019 & 2032
- Table 84: France Next-Generation Antibody Therapeutics Market Volume (K Unit) Forecast, by Application 2019 & 2032
- Table 85: Italy Next-Generation Antibody Therapeutics Market Revenue (Million) Forecast, by Application 2019 & 2032
- Table 86: Italy Next-Generation Antibody Therapeutics Market Volume (K Unit) Forecast, by Application 2019 & 2032
- Table 87: Spain Next-Generation Antibody Therapeutics Market Revenue (Million) Forecast, by Application 2019 & 2032
- Table 88: Spain Next-Generation Antibody Therapeutics Market Volume (K Unit) Forecast, by Application 2019 & 2032
- Table 89: Rest of Europe Next-Generation Antibody Therapeutics Market Revenue (Million) Forecast, by Application 2019 & 2032
- Table 90: Rest of Europe Next-Generation Antibody Therapeutics Market Volume (K Unit) Forecast, by Application 2019 & 2032
- Table 91: Global Next-Generation Antibody Therapeutics Market Revenue Million Forecast, by Therapeutic Area 2019 & 2032
- Table 92: Global Next-Generation Antibody Therapeutics Market Volume K Unit Forecast, by Therapeutic Area 2019 & 2032
- Table 93: Global Next-Generation Antibody Therapeutics Market Revenue Million Forecast, by Technology 2019 & 2032
- Table 94: Global Next-Generation Antibody Therapeutics Market Volume K Unit Forecast, by Technology 2019 & 2032
- Table 95: Global Next-Generation Antibody Therapeutics Market Revenue Million Forecast, by Country 2019 & 2032
- Table 96: Global Next-Generation Antibody Therapeutics Market Volume K Unit Forecast, by Country 2019 & 2032
- Table 97: China Next-Generation Antibody Therapeutics Market Revenue (Million) Forecast, by Application 2019 & 2032
- Table 98: China Next-Generation Antibody Therapeutics Market Volume (K Unit) Forecast, by Application 2019 & 2032
- Table 99: Japan Next-Generation Antibody Therapeutics Market Revenue (Million) Forecast, by Application 2019 & 2032
- Table 100: Japan Next-Generation Antibody Therapeutics Market Volume (K Unit) Forecast, by Application 2019 & 2032
- Table 101: India Next-Generation Antibody Therapeutics Market Revenue (Million) Forecast, by Application 2019 & 2032
- Table 102: India Next-Generation Antibody Therapeutics Market Volume (K Unit) Forecast, by Application 2019 & 2032
- Table 103: Australia Next-Generation Antibody Therapeutics Market Revenue (Million) Forecast, by Application 2019 & 2032
- Table 104: Australia Next-Generation Antibody Therapeutics Market Volume (K Unit) Forecast, by Application 2019 & 2032
- Table 105: South Korea Next-Generation Antibody Therapeutics Market Revenue (Million) Forecast, by Application 2019 & 2032
- Table 106: South Korea Next-Generation Antibody Therapeutics Market Volume (K Unit) Forecast, by Application 2019 & 2032
- Table 107: Rest of Asia Pacific Next-Generation Antibody Therapeutics Market Revenue (Million) Forecast, by Application 2019 & 2032
- Table 108: Rest of Asia Pacific Next-Generation Antibody Therapeutics Market Volume (K Unit) Forecast, by Application 2019 & 2032
- Table 109: Global Next-Generation Antibody Therapeutics Market Revenue Million Forecast, by Therapeutic Area 2019 & 2032
- Table 110: Global Next-Generation Antibody Therapeutics Market Volume K Unit Forecast, by Therapeutic Area 2019 & 2032
- Table 111: Global Next-Generation Antibody Therapeutics Market Revenue Million Forecast, by Technology 2019 & 2032
- Table 112: Global Next-Generation Antibody Therapeutics Market Volume K Unit Forecast, by Technology 2019 & 2032
- Table 113: Global Next-Generation Antibody Therapeutics Market Revenue Million Forecast, by Country 2019 & 2032
- Table 114: Global Next-Generation Antibody Therapeutics Market Volume K Unit Forecast, by Country 2019 & 2032
- Table 115: GCC Next-Generation Antibody Therapeutics Market Revenue (Million) Forecast, by Application 2019 & 2032
- Table 116: GCC Next-Generation Antibody Therapeutics Market Volume (K Unit) Forecast, by Application 2019 & 2032
- Table 117: South Africa Next-Generation Antibody Therapeutics Market Revenue (Million) Forecast, by Application 2019 & 2032
- Table 118: South Africa Next-Generation Antibody Therapeutics Market Volume (K Unit) Forecast, by Application 2019 & 2032
- Table 119: Rest of Middle East and Africa Next-Generation Antibody Therapeutics Market Revenue (Million) Forecast, by Application 2019 & 2032
- Table 120: Rest of Middle East and Africa Next-Generation Antibody Therapeutics Market Volume (K Unit) Forecast, by Application 2019 & 2032
- Table 121: Global Next-Generation Antibody Therapeutics Market Revenue Million Forecast, by Therapeutic Area 2019 & 2032
- Table 122: Global Next-Generation Antibody Therapeutics Market Volume K Unit Forecast, by Therapeutic Area 2019 & 2032
- Table 123: Global Next-Generation Antibody Therapeutics Market Revenue Million Forecast, by Technology 2019 & 2032
- Table 124: Global Next-Generation Antibody Therapeutics Market Volume K Unit Forecast, by Technology 2019 & 2032
- Table 125: Global Next-Generation Antibody Therapeutics Market Revenue Million Forecast, by Country 2019 & 2032
- Table 126: Global Next-Generation Antibody Therapeutics Market Volume K Unit Forecast, by Country 2019 & 2032
- Table 127: Brazil Next-Generation Antibody Therapeutics Market Revenue (Million) Forecast, by Application 2019 & 2032
- Table 128: Brazil Next-Generation Antibody Therapeutics Market Volume (K Unit) Forecast, by Application 2019 & 2032
- Table 129: Argentina Next-Generation Antibody Therapeutics Market Revenue (Million) Forecast, by Application 2019 & 2032
- Table 130: Argentina Next-Generation Antibody Therapeutics Market Volume (K Unit) Forecast, by Application 2019 & 2032
- Table 131: Rest of South America Next-Generation Antibody Therapeutics Market Revenue (Million) Forecast, by Application 2019 & 2032
- Table 132: Rest of South America Next-Generation Antibody Therapeutics Market Volume (K Unit) Forecast, by Application 2019 & 2032
Frequently Asked Questions
1. What is the projected Compound Annual Growth Rate (CAGR) of the Next-Generation Antibody Therapeutics Market?
The projected CAGR is approximately 12.10%.
2. Which companies are prominent players in the Next-Generation Antibody Therapeutics Market?
Key companies in the market include Kyowa Hakko Kirin Co Ltd, Bayer AG, Amgen Inc, ImmunoGen Inc, Xencor Inc, F Hoffmann-La Roche Ltd, GlaxoSmithKline Plc, Biogen, AstraZeneca Plc, Seagen Inc, Bristol-Myers Squibb Company, Pfizer Inc.
3. What are the main segments of the Next-Generation Antibody Therapeutics Market?
The market segments include Therapeutic Area, Technology.
4. Can you provide details about the market size?
The market size is estimated to be USD XX Million as of 2022.
5. What are some drivers contributing to market growth?
Increasing Incidence of Cancer; Rising Prevalence of Autoimmune Diseases; Technological Progressions in Antibody Therapeutics.
6. What are the notable trends driving market growth?
Antibody-Drug Conjugates Segment is Expected to Hold the Largest Market Share in the Next-Generation Antibody Therapeutics Market.
7. Are there any restraints impacting market growth?
Stringent Regulatory Framework; High costs of Next-Generation Antibody Therapeutics.
8. Can you provide examples of recent developments in the market?
December 2022: Sorrento Therapeutics, Inc. received clearance from the U.S. FDA to initiate clinical trials with its next-generation mRNA (STI-1557) vaccine against SARS-CoV-2 Omicron variants.
9. What pricing options are available for accessing the report?
Pricing options include single-user, multi-user, and enterprise licenses priced at USD 4750, USD 5250, and USD 8750 respectively.
10. Is the market size provided in terms of value or volume?
The market size is provided in terms of value, measured in Million and volume, measured in K Unit.
11. Are there any specific market keywords associated with the report?
Yes, the market keyword associated with the report is "Next-Generation Antibody Therapeutics Market," which aids in identifying and referencing the specific market segment covered.
12. How do I determine which pricing option suits my needs best?
The pricing options vary based on user requirements and access needs. Individual users may opt for single-user licenses, while businesses requiring broader access may choose multi-user or enterprise licenses for cost-effective access to the report.
13. Are there any additional resources or data provided in the Next-Generation Antibody Therapeutics Market report?
While the report offers comprehensive insights, it's advisable to review the specific contents or supplementary materials provided to ascertain if additional resources or data are available.
14. How can I stay updated on further developments or reports in the Next-Generation Antibody Therapeutics Market?
To stay informed about further developments, trends, and reports in the Next-Generation Antibody Therapeutics Market, consider subscribing to industry newsletters, following relevant companies and organizations, or regularly checking reputable industry news sources and publications.
Methodology
Step 1 - Identification of Relevant Samples Size from Population Database


Step 2 - Approaches for Defining Global Market Size (Value, Volume* & Price*)

Note*: In applicable scenarios
Step 3 - Data Sources
Primary Research
- Web Analytics
- Survey Reports
- Research Institute
- Latest Research Reports
- Opinion Leaders
Secondary Research
- Annual Reports
- White Paper
- Latest Press Release
- Industry Association
- Paid Database
- Investor Presentations

Step 4 - Data Triangulation
Involves using different sources of information in order to increase the validity of a study
These sources are likely to be stakeholders in a program - participants, other researchers, program staff, other community members, and so on.
Then we put all data in single framework & apply various statistical tools to find out the dynamic on the market.
During the analysis stage, feedback from the stakeholder groups would be compared to determine areas of agreement as well as areas of divergence
