

Key Insights
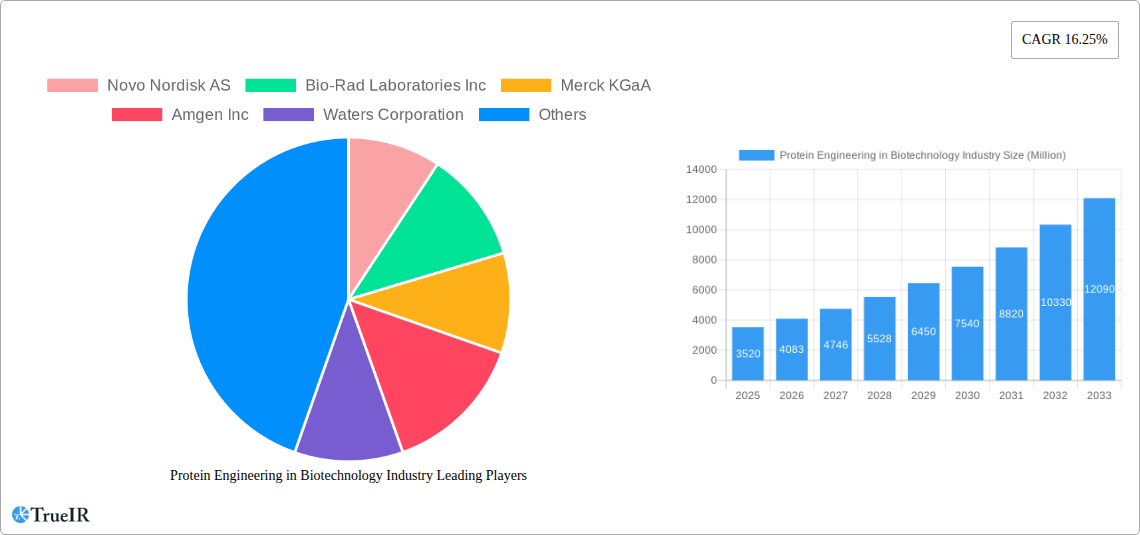
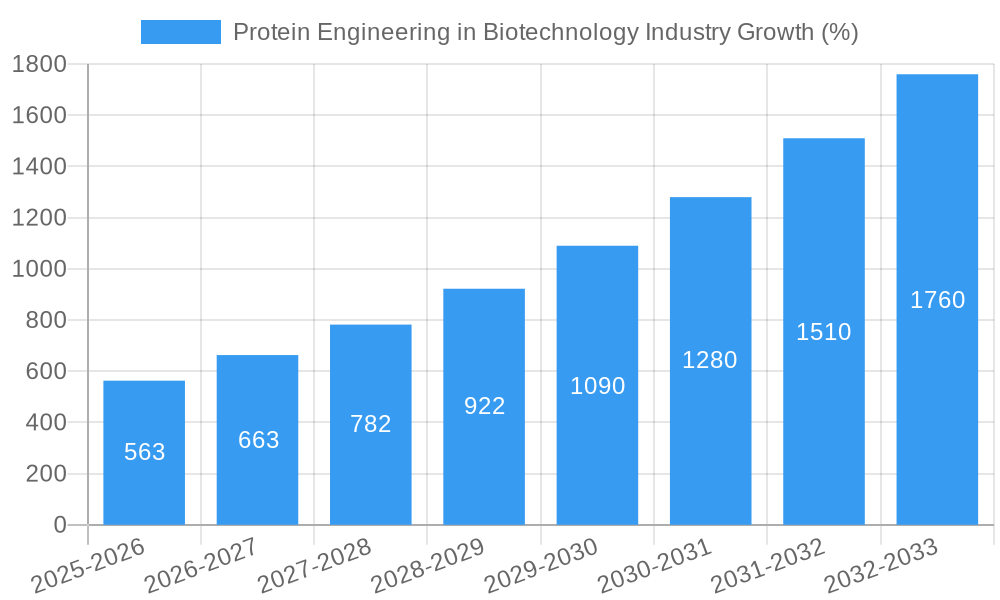
The Protein Engineering in Biotechnology market, valued at $3.52 billion in 2025, is poised for significant growth, exhibiting a Compound Annual Growth Rate (CAGR) of 16.25% from 2025 to 2033. This robust expansion is driven by several key factors. The increasing prevalence of chronic diseases like diabetes and cancer fuels demand for innovative biologics, such as insulin, monoclonal antibodies, and coagulation factors, all heavily reliant on protein engineering techniques. Furthermore, advancements in rational and irrational protein design technologies are enabling the creation of highly specific and effective therapeutic proteins, accelerating drug discovery and development. The pharmaceutical and biotechnology sector is the primary end-user, investing heavily in R&D to leverage these advancements. Contract Research Organizations (CROs) also play a vital role, providing specialized protein engineering services to these companies. Growth is further spurred by academic institutions conducting fundamental research and contributing to the advancement of protein engineering technologies. Geographic expansion, particularly in rapidly developing economies of Asia-Pacific, is also anticipated to significantly contribute to market growth.
However, challenges exist. The high cost of developing and manufacturing engineered proteins, coupled with rigorous regulatory hurdles for approval, can hinder market penetration. The complexity of protein engineering processes and the need for specialized expertise can also present barriers to entry for smaller companies. Despite these restraints, the long-term outlook remains positive, driven by continuous innovation in protein design, increased funding for biotechnology research, and a growing global demand for effective biotherapeutics. The market segmentation by product type (insulin, monoclonal antibodies, etc.), technology (rational and irrational protein design), and end-user (pharmaceutical companies, CROs, etc.) provides a nuanced understanding of the diverse applications and opportunities within this rapidly evolving field. The market is expected to surpass $10 billion by 2033, solidifying its position as a crucial component of the biotechnology landscape.
Protein Engineering in Biotechnology Industry: A Comprehensive Market Report (2019-2033)
This dynamic report provides a detailed analysis of the Protein Engineering in Biotechnology Industry, offering invaluable insights for investors, industry professionals, and researchers. With a comprehensive study period spanning 2019-2033, including a base year of 2025 and a forecast period of 2025-2033, this report leverages high-volume keywords to ensure maximum visibility and engagement. The market is projected to reach a staggering $XX Million by 2033.
Protein Engineering in Biotechnology Industry Market Structure & Competitive Landscape
The Protein Engineering in Biotechnology market is characterized by a moderately concentrated landscape, with several major players holding significant market share. The Herfindahl-Hirschman Index (HHI) for 2024 is estimated at xx, indicating a moderately consolidated market. Innovation is a key driver, with companies continually investing in research and development to improve protein design technologies and expand product portfolios. Stringent regulatory approvals and intellectual property rights significantly impact market dynamics. Substitutes, such as small molecule drugs, pose some competitive pressure but are limited due to the unique advantages of protein-based therapeutics.
End-User Segmentation: The market is primarily driven by Pharmaceutical and Biotechnology companies (xx Million in 2024), followed by Academic Institutions (xx Million in 2024) and Contract Research Organizations (xx Million in 2024).
M&A Trends: The past five years have witnessed an average of xx M&A transactions annually, with total deal value exceeding $XX Million. These transactions demonstrate the strategic importance of protein engineering capabilities and the consolidation trends within the industry. Larger pharmaceutical companies are frequently acquiring smaller biotech firms with specialized expertise in protein design.
- Market Concentration: Moderately concentrated, with a few dominant players.
- Innovation Drivers: R&D investments in advanced protein design technologies (AI, machine learning).
- Regulatory Impacts: Stringent regulatory approvals for biologics shape market entry.
- Product Substitutes: Limited substitutes, but small molecule drugs present some competition.
- M&A Activity: Significant M&A activity, driven by strategic acquisitions by larger players.
Protein Engineering in Biotechnology Industry Market Trends & Opportunities
The Protein Engineering in Biotechnology market is experiencing robust growth, driven by technological advancements, increasing demand for targeted therapies, and the rising prevalence of chronic diseases. The market size is projected to expand at a Compound Annual Growth Rate (CAGR) of xx% from 2025 to 2033, reaching $XX Million by 2033. This growth is further fueled by the increasing adoption of rational and irrational protein design technologies, coupled with the development of innovative protein-based therapeutics.
Market penetration rates for protein-based drugs are increasing, particularly in areas like oncology, immunology, and endocrinology. Consumer preferences are shifting towards more targeted and effective therapies with minimized side effects, bolstering the demand for advanced protein engineering techniques. Competitive dynamics are characterized by intense R&D efforts and strategic partnerships, aiming to develop superior protein therapeutics and secure market leadership. The emergence of AI and machine learning further accelerates the pace of innovation and drives growth.
Dominant Markets & Segments in Protein Engineering in Biotechnology Industry
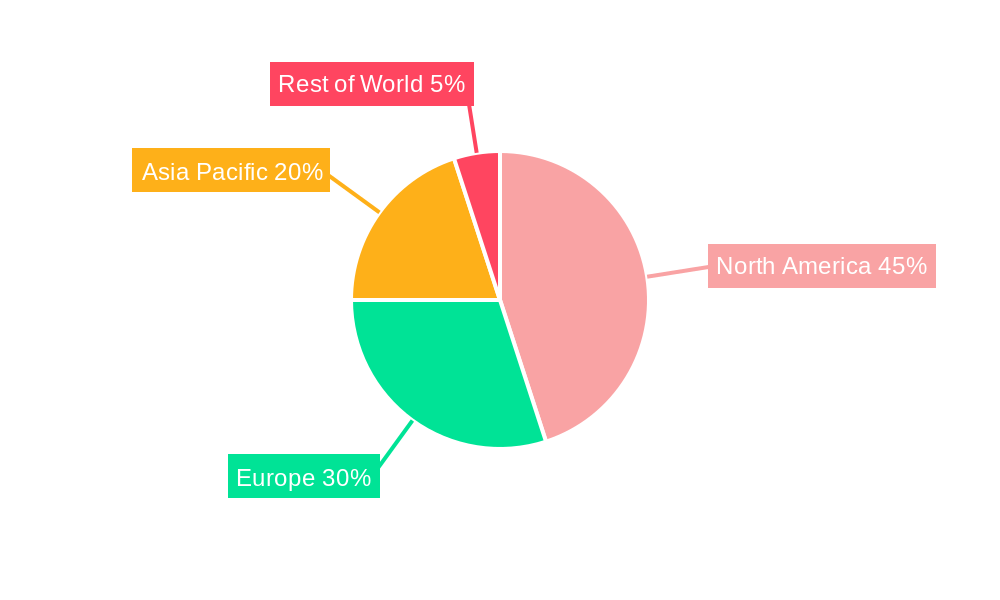
The North American market holds the largest share (xx%) of the global Protein Engineering in Biotechnology market in 2025 due to strong R&D investments, presence of major players, and a robust regulatory framework. Within product types, Monoclonal Antibodies (MAbs) dominate, accounting for xx% of the market, followed by Insulin (xx%), and other protein therapeutics. Rational protein design currently holds a larger market share compared to irrational design due to its higher predictability and efficiency.
Key Growth Drivers (North America):
- Substantial R&D investment in biotechnology.
- Strong regulatory support for innovative therapies.
- High prevalence of chronic diseases.
- Presence of key industry players and research institutions.
Leading Product Types:
- Monoclonal Antibodies (MAbs): High market share due to diverse applications in oncology, immunology, and other therapeutic areas.
- Insulin: Established market with ongoing innovation for improved efficacy and delivery systems.
Dominant Technology:
- Rational Protein Design: Wider adoption due to its predictable outcome and higher efficiency compared to irrational design.
Protein Engineering in Biotechnology Industry Product Analysis
The latest advancements in protein engineering technologies, such as directed evolution and computational protein design, are driving the development of novel protein-based therapeutics with enhanced efficacy, stability, and safety profiles. This has led to the creation of targeted therapies with improved patient outcomes and a higher market acceptance rate compared to traditional methods. The market is seeing increasing adoption of biosimilars and biobetters, further shaping the product landscape.
Key Drivers, Barriers & Challenges in Protein Engineering in Biotechnology Industry
Key Drivers:
- Technological advancements in protein design (AI, machine learning).
- Rising prevalence of chronic diseases necessitating targeted therapies.
- Growing demand for biosimilars and biobetters.
- Favorable regulatory landscapes in several regions promoting innovation.
Challenges:
- High cost and complexity associated with protein engineering and production.
- Stringent regulatory approvals and long development timelines.
- Competition from other therapeutic modalities (e.g., small molecules).
- Supply chain disruptions impacting the availability of raw materials. Estimated impact: xx% reduction in production capacity in 2024 due to supply chain issues.
Growth Drivers in the Protein Engineering in Biotechnology Industry Market
The key drivers propelling market growth include increased R&D spending by pharmaceutical and biotech companies, the rise of personalized medicine, the growing demand for biosimilars and biobetters, and supportive government regulations. Technological advances, like AI-powered protein design, are also pivotal in accelerating innovation and driving market expansion. The market size for protein engineering services is also estimated to experience growth at a CAGR of xx%.
Challenges Impacting Protein Engineering in Biotechnology Industry Growth
Significant barriers include the high cost of drug development, stringent regulatory hurdles that lengthen the time-to-market, and the challenges associated with scaling up production. Competition from other treatment modalities like small molecule drugs and gene therapies also poses a significant challenge. The complexity of protein characterization and potential immunogenicity concerns also impact market growth.
Key Players Shaping the Protein Engineering in Biotechnology Market
- Novo Nordisk AS
- Bio-Rad Laboratories Inc
- Merck KGaA
- Amgen Inc
- Waters Corporation
- Thermo Fisher Scientific Inc
- Eli Lilly and Company
- GenScript Biotech Corporation
- Agilent Technologies Inc
- PerkinElmer Inc
- Bruker Corporation
- GE HealthCare
Significant Protein Engineering in Biotechnology Industry Milestones
April 2024: Northpond-funded Laboratory for Bioengineering Research and Innovation invests in the Wyss Institute's AmnioX project, accelerating protein-based drug development. This significantly enhances accessibility of protein-based medicines.
March 2023: Arzeda and Takeda collaborate, leveraging AI-based protein design to optimize protein biologics, potentially revolutionizing therapeutic protein development. This collaboration exemplifies the rising role of AI in protein engineering.
Future Outlook for Protein Engineering in Biotechnology Industry Market
The future of the Protein Engineering in Biotechnology market is bright, fueled by ongoing technological advancements, a growing pipeline of innovative protein therapeutics, and increasing demand driven by the rising prevalence of chronic diseases. Strategic partnerships and collaborations will further accelerate innovation, while the growing adoption of AI and machine learning will streamline protein design and development processes. This market is poised for significant growth in the coming years.
Protein Engineering in Biotechnology Industry Segmentation
-
1. Product Type
- 1.1. Insulin
- 1.2. Monoclonal Antibodies
- 1.3. Coagulation Factors
- 1.4. Vaccines
- 1.5. Growth Factors
- 1.6. Other Product Types
-
2. Technology
- 2.1. Irrational Protein Design
- 2.2. Rational Protein Design
-
3. End User
- 3.1. Pharmaceutical and Biotechnology Companies
- 3.2. Academic Institutions
- 3.3. Contract Research Organizations
Protein Engineering in Biotechnology Industry Segmentation By Geography
-
1. North America
- 1.1. United States
- 1.2. Canada
- 1.3. Mexico
-
2. Europe
- 2.1. Germany
- 2.2. United Kingdom
- 2.3. France
- 2.4. Italy
- 2.5. Spain
- 2.6. Rest of Europe
-
3. Asia Pacific
- 3.1. China
- 3.2. Japan
- 3.3. India
- 3.4. Australia
- 3.5. South Korea
- 3.6. Rest of Asia Pacific
-
4. Middle East and Africa
- 4.1. GCC
- 4.2. South Africa
- 4.3. Rest of Middle East and Africa
-
5. South America
- 5.1. Brazil
- 5.2. Argentina
- 5.3. Rest of South America
Protein Engineering in Biotechnology Industry REPORT HIGHLIGHTS
| Aspects | Details |
|---|---|
| Study Period | 2019-2033 |
| Base Year | 2024 |
| Estimated Year | 2025 |
| Forecast Period | 2025-2033 |
| Historical Period | 2019-2024 |
| Growth Rate | CAGR of 16.25% from 2019-2033 |
| Segmentation |
|
Table of Contents
- 1. Introduction
- 1.1. Research Scope
- 1.2. Market Segmentation
- 1.3. Research Methodology
- 1.4. Definitions and Assumptions
- 2. Executive Summary
- 2.1. Introduction
- 3. Market Dynamics
- 3.1. Introduction
- 3.2. Market Drivers
- 3.2.1. Increasing Prevalence of Chronic Diseases and Rise in Demand for Targeted Therapies; Rising Government Funding for Protein Engineering Studies
- 3.3. Market Restrains
- 3.3.1. High Costs of Protein Engineering Techniques
- 3.4. Market Trends
- 3.4.1. The Monoclonal Antibodies Segment is Anticipated to Witness Notable Growth Over the Forecast Period
- 4. Market Factor Analysis
- 4.1. Porters Five Forces
- 4.2. Supply/Value Chain
- 4.3. PESTEL analysis
- 4.4. Market Entropy
- 4.5. Patent/Trademark Analysis
- 5. Global Protein Engineering in Biotechnology Industry Analysis, Insights and Forecast, 2019-2031
- 5.1. Market Analysis, Insights and Forecast - by Product Type
- 5.1.1. Insulin
- 5.1.2. Monoclonal Antibodies
- 5.1.3. Coagulation Factors
- 5.1.4. Vaccines
- 5.1.5. Growth Factors
- 5.1.6. Other Product Types
- 5.2. Market Analysis, Insights and Forecast - by Technology
- 5.2.1. Irrational Protein Design
- 5.2.2. Rational Protein Design
- 5.3. Market Analysis, Insights and Forecast - by End User
- 5.3.1. Pharmaceutical and Biotechnology Companies
- 5.3.2. Academic Institutions
- 5.3.3. Contract Research Organizations
- 5.4. Market Analysis, Insights and Forecast - by Region
- 5.4.1. North America
- 5.4.2. Europe
- 5.4.3. Asia Pacific
- 5.4.4. Middle East and Africa
- 5.4.5. South America
- 5.1. Market Analysis, Insights and Forecast - by Product Type
- 6. North America Protein Engineering in Biotechnology Industry Analysis, Insights and Forecast, 2019-2031
- 6.1. Market Analysis, Insights and Forecast - by Product Type
- 6.1.1. Insulin
- 6.1.2. Monoclonal Antibodies
- 6.1.3. Coagulation Factors
- 6.1.4. Vaccines
- 6.1.5. Growth Factors
- 6.1.6. Other Product Types
- 6.2. Market Analysis, Insights and Forecast - by Technology
- 6.2.1. Irrational Protein Design
- 6.2.2. Rational Protein Design
- 6.3. Market Analysis, Insights and Forecast - by End User
- 6.3.1. Pharmaceutical and Biotechnology Companies
- 6.3.2. Academic Institutions
- 6.3.3. Contract Research Organizations
- 6.1. Market Analysis, Insights and Forecast - by Product Type
- 7. Europe Protein Engineering in Biotechnology Industry Analysis, Insights and Forecast, 2019-2031
- 7.1. Market Analysis, Insights and Forecast - by Product Type
- 7.1.1. Insulin
- 7.1.2. Monoclonal Antibodies
- 7.1.3. Coagulation Factors
- 7.1.4. Vaccines
- 7.1.5. Growth Factors
- 7.1.6. Other Product Types
- 7.2. Market Analysis, Insights and Forecast - by Technology
- 7.2.1. Irrational Protein Design
- 7.2.2. Rational Protein Design
- 7.3. Market Analysis, Insights and Forecast - by End User
- 7.3.1. Pharmaceutical and Biotechnology Companies
- 7.3.2. Academic Institutions
- 7.3.3. Contract Research Organizations
- 7.1. Market Analysis, Insights and Forecast - by Product Type
- 8. Asia Pacific Protein Engineering in Biotechnology Industry Analysis, Insights and Forecast, 2019-2031
- 8.1. Market Analysis, Insights and Forecast - by Product Type
- 8.1.1. Insulin
- 8.1.2. Monoclonal Antibodies
- 8.1.3. Coagulation Factors
- 8.1.4. Vaccines
- 8.1.5. Growth Factors
- 8.1.6. Other Product Types
- 8.2. Market Analysis, Insights and Forecast - by Technology
- 8.2.1. Irrational Protein Design
- 8.2.2. Rational Protein Design
- 8.3. Market Analysis, Insights and Forecast - by End User
- 8.3.1. Pharmaceutical and Biotechnology Companies
- 8.3.2. Academic Institutions
- 8.3.3. Contract Research Organizations
- 8.1. Market Analysis, Insights and Forecast - by Product Type
- 9. Middle East and Africa Protein Engineering in Biotechnology Industry Analysis, Insights and Forecast, 2019-2031
- 9.1. Market Analysis, Insights and Forecast - by Product Type
- 9.1.1. Insulin
- 9.1.2. Monoclonal Antibodies
- 9.1.3. Coagulation Factors
- 9.1.4. Vaccines
- 9.1.5. Growth Factors
- 9.1.6. Other Product Types
- 9.2. Market Analysis, Insights and Forecast - by Technology
- 9.2.1. Irrational Protein Design
- 9.2.2. Rational Protein Design
- 9.3. Market Analysis, Insights and Forecast - by End User
- 9.3.1. Pharmaceutical and Biotechnology Companies
- 9.3.2. Academic Institutions
- 9.3.3. Contract Research Organizations
- 9.1. Market Analysis, Insights and Forecast - by Product Type
- 10. South America Protein Engineering in Biotechnology Industry Analysis, Insights and Forecast, 2019-2031
- 10.1. Market Analysis, Insights and Forecast - by Product Type
- 10.1.1. Insulin
- 10.1.2. Monoclonal Antibodies
- 10.1.3. Coagulation Factors
- 10.1.4. Vaccines
- 10.1.5. Growth Factors
- 10.1.6. Other Product Types
- 10.2. Market Analysis, Insights and Forecast - by Technology
- 10.2.1. Irrational Protein Design
- 10.2.2. Rational Protein Design
- 10.3. Market Analysis, Insights and Forecast - by End User
- 10.3.1. Pharmaceutical and Biotechnology Companies
- 10.3.2. Academic Institutions
- 10.3.3. Contract Research Organizations
- 10.1. Market Analysis, Insights and Forecast - by Product Type
- 11. North America Protein Engineering in Biotechnology Industry Analysis, Insights and Forecast, 2019-2031
- 11.1. Market Analysis, Insights and Forecast - By Country/Sub-region
- 11.1.1 United States
- 11.1.2 Canada
- 11.1.3 Mexico
- 12. Europe Protein Engineering in Biotechnology Industry Analysis, Insights and Forecast, 2019-2031
- 12.1. Market Analysis, Insights and Forecast - By Country/Sub-region
- 12.1.1 Germany
- 12.1.2 United Kingdom
- 12.1.3 France
- 12.1.4 Italy
- 12.1.5 Spain
- 12.1.6 Rest of Europe
- 13. Asia Pacific Protein Engineering in Biotechnology Industry Analysis, Insights and Forecast, 2019-2031
- 13.1. Market Analysis, Insights and Forecast - By Country/Sub-region
- 13.1.1 China
- 13.1.2 Japan
- 13.1.3 India
- 13.1.4 Australia
- 13.1.5 South Korea
- 13.1.6 Rest of Asia Pacific
- 14. Middle East and Africa Protein Engineering in Biotechnology Industry Analysis, Insights and Forecast, 2019-2031
- 14.1. Market Analysis, Insights and Forecast - By Country/Sub-region
- 14.1.1 GCC
- 14.1.2 South Africa
- 14.1.3 Rest of Middle East and Africa
- 15. South America Protein Engineering in Biotechnology Industry Analysis, Insights and Forecast, 2019-2031
- 15.1. Market Analysis, Insights and Forecast - By Country/Sub-region
- 15.1.1 Brazil
- 15.1.2 Argentina
- 15.1.3 Rest of South America
- 16. Competitive Analysis
- 16.1. Global Market Share Analysis 2024
- 16.2. Company Profiles
- 16.2.1 Novo Nordisk AS
- 16.2.1.1. Overview
- 16.2.1.2. Products
- 16.2.1.3. SWOT Analysis
- 16.2.1.4. Recent Developments
- 16.2.1.5. Financials (Based on Availability)
- 16.2.2 Bio-Rad Laboratories Inc
- 16.2.2.1. Overview
- 16.2.2.2. Products
- 16.2.2.3. SWOT Analysis
- 16.2.2.4. Recent Developments
- 16.2.2.5. Financials (Based on Availability)
- 16.2.3 Merck KGaA
- 16.2.3.1. Overview
- 16.2.3.2. Products
- 16.2.3.3. SWOT Analysis
- 16.2.3.4. Recent Developments
- 16.2.3.5. Financials (Based on Availability)
- 16.2.4 Amgen Inc
- 16.2.4.1. Overview
- 16.2.4.2. Products
- 16.2.4.3. SWOT Analysis
- 16.2.4.4. Recent Developments
- 16.2.4.5. Financials (Based on Availability)
- 16.2.5 Waters Corporation
- 16.2.5.1. Overview
- 16.2.5.2. Products
- 16.2.5.3. SWOT Analysis
- 16.2.5.4. Recent Developments
- 16.2.5.5. Financials (Based on Availability)
- 16.2.6 Thermo Fisher Scientific Inc
- 16.2.6.1. Overview
- 16.2.6.2. Products
- 16.2.6.3. SWOT Analysis
- 16.2.6.4. Recent Developments
- 16.2.6.5. Financials (Based on Availability)
- 16.2.7 Eli Lilly and Company
- 16.2.7.1. Overview
- 16.2.7.2. Products
- 16.2.7.3. SWOT Analysis
- 16.2.7.4. Recent Developments
- 16.2.7.5. Financials (Based on Availability)
- 16.2.8 GenScript Biotech Corporation
- 16.2.8.1. Overview
- 16.2.8.2. Products
- 16.2.8.3. SWOT Analysis
- 16.2.8.4. Recent Developments
- 16.2.8.5. Financials (Based on Availability)
- 16.2.9 Agilent Technologies Inc
- 16.2.9.1. Overview
- 16.2.9.2. Products
- 16.2.9.3. SWOT Analysis
- 16.2.9.4. Recent Developments
- 16.2.9.5. Financials (Based on Availability)
- 16.2.10 PerkinElmer Inc
- 16.2.10.1. Overview
- 16.2.10.2. Products
- 16.2.10.3. SWOT Analysis
- 16.2.10.4. Recent Developments
- 16.2.10.5. Financials (Based on Availability)
- 16.2.11 Bruker Corporation
- 16.2.11.1. Overview
- 16.2.11.2. Products
- 16.2.11.3. SWOT Analysis
- 16.2.11.4. Recent Developments
- 16.2.11.5. Financials (Based on Availability)
- 16.2.12 GE HealthCare
- 16.2.12.1. Overview
- 16.2.12.2. Products
- 16.2.12.3. SWOT Analysis
- 16.2.12.4. Recent Developments
- 16.2.12.5. Financials (Based on Availability)
- 16.2.1 Novo Nordisk AS
List of Figures
- Figure 1: Global Protein Engineering in Biotechnology Industry Revenue Breakdown (Million, %) by Region 2024 & 2032
- Figure 2: Global Protein Engineering in Biotechnology Industry Volume Breakdown (K Unit, %) by Region 2024 & 2032
- Figure 3: North America Protein Engineering in Biotechnology Industry Revenue (Million), by Country 2024 & 2032
- Figure 4: North America Protein Engineering in Biotechnology Industry Volume (K Unit), by Country 2024 & 2032
- Figure 5: North America Protein Engineering in Biotechnology Industry Revenue Share (%), by Country 2024 & 2032
- Figure 6: North America Protein Engineering in Biotechnology Industry Volume Share (%), by Country 2024 & 2032
- Figure 7: Europe Protein Engineering in Biotechnology Industry Revenue (Million), by Country 2024 & 2032
- Figure 8: Europe Protein Engineering in Biotechnology Industry Volume (K Unit), by Country 2024 & 2032
- Figure 9: Europe Protein Engineering in Biotechnology Industry Revenue Share (%), by Country 2024 & 2032
- Figure 10: Europe Protein Engineering in Biotechnology Industry Volume Share (%), by Country 2024 & 2032
- Figure 11: Asia Pacific Protein Engineering in Biotechnology Industry Revenue (Million), by Country 2024 & 2032
- Figure 12: Asia Pacific Protein Engineering in Biotechnology Industry Volume (K Unit), by Country 2024 & 2032
- Figure 13: Asia Pacific Protein Engineering in Biotechnology Industry Revenue Share (%), by Country 2024 & 2032
- Figure 14: Asia Pacific Protein Engineering in Biotechnology Industry Volume Share (%), by Country 2024 & 2032
- Figure 15: Middle East and Africa Protein Engineering in Biotechnology Industry Revenue (Million), by Country 2024 & 2032
- Figure 16: Middle East and Africa Protein Engineering in Biotechnology Industry Volume (K Unit), by Country 2024 & 2032
- Figure 17: Middle East and Africa Protein Engineering in Biotechnology Industry Revenue Share (%), by Country 2024 & 2032
- Figure 18: Middle East and Africa Protein Engineering in Biotechnology Industry Volume Share (%), by Country 2024 & 2032
- Figure 19: South America Protein Engineering in Biotechnology Industry Revenue (Million), by Country 2024 & 2032
- Figure 20: South America Protein Engineering in Biotechnology Industry Volume (K Unit), by Country 2024 & 2032
- Figure 21: South America Protein Engineering in Biotechnology Industry Revenue Share (%), by Country 2024 & 2032
- Figure 22: South America Protein Engineering in Biotechnology Industry Volume Share (%), by Country 2024 & 2032
- Figure 23: North America Protein Engineering in Biotechnology Industry Revenue (Million), by Product Type 2024 & 2032
- Figure 24: North America Protein Engineering in Biotechnology Industry Volume (K Unit), by Product Type 2024 & 2032
- Figure 25: North America Protein Engineering in Biotechnology Industry Revenue Share (%), by Product Type 2024 & 2032
- Figure 26: North America Protein Engineering in Biotechnology Industry Volume Share (%), by Product Type 2024 & 2032
- Figure 27: North America Protein Engineering in Biotechnology Industry Revenue (Million), by Technology 2024 & 2032
- Figure 28: North America Protein Engineering in Biotechnology Industry Volume (K Unit), by Technology 2024 & 2032
- Figure 29: North America Protein Engineering in Biotechnology Industry Revenue Share (%), by Technology 2024 & 2032
- Figure 30: North America Protein Engineering in Biotechnology Industry Volume Share (%), by Technology 2024 & 2032
- Figure 31: North America Protein Engineering in Biotechnology Industry Revenue (Million), by End User 2024 & 2032
- Figure 32: North America Protein Engineering in Biotechnology Industry Volume (K Unit), by End User 2024 & 2032
- Figure 33: North America Protein Engineering in Biotechnology Industry Revenue Share (%), by End User 2024 & 2032
- Figure 34: North America Protein Engineering in Biotechnology Industry Volume Share (%), by End User 2024 & 2032
- Figure 35: North America Protein Engineering in Biotechnology Industry Revenue (Million), by Country 2024 & 2032
- Figure 36: North America Protein Engineering in Biotechnology Industry Volume (K Unit), by Country 2024 & 2032
- Figure 37: North America Protein Engineering in Biotechnology Industry Revenue Share (%), by Country 2024 & 2032
- Figure 38: North America Protein Engineering in Biotechnology Industry Volume Share (%), by Country 2024 & 2032
- Figure 39: Europe Protein Engineering in Biotechnology Industry Revenue (Million), by Product Type 2024 & 2032
- Figure 40: Europe Protein Engineering in Biotechnology Industry Volume (K Unit), by Product Type 2024 & 2032
- Figure 41: Europe Protein Engineering in Biotechnology Industry Revenue Share (%), by Product Type 2024 & 2032
- Figure 42: Europe Protein Engineering in Biotechnology Industry Volume Share (%), by Product Type 2024 & 2032
- Figure 43: Europe Protein Engineering in Biotechnology Industry Revenue (Million), by Technology 2024 & 2032
- Figure 44: Europe Protein Engineering in Biotechnology Industry Volume (K Unit), by Technology 2024 & 2032
- Figure 45: Europe Protein Engineering in Biotechnology Industry Revenue Share (%), by Technology 2024 & 2032
- Figure 46: Europe Protein Engineering in Biotechnology Industry Volume Share (%), by Technology 2024 & 2032
- Figure 47: Europe Protein Engineering in Biotechnology Industry Revenue (Million), by End User 2024 & 2032
- Figure 48: Europe Protein Engineering in Biotechnology Industry Volume (K Unit), by End User 2024 & 2032
- Figure 49: Europe Protein Engineering in Biotechnology Industry Revenue Share (%), by End User 2024 & 2032
- Figure 50: Europe Protein Engineering in Biotechnology Industry Volume Share (%), by End User 2024 & 2032
- Figure 51: Europe Protein Engineering in Biotechnology Industry Revenue (Million), by Country 2024 & 2032
- Figure 52: Europe Protein Engineering in Biotechnology Industry Volume (K Unit), by Country 2024 & 2032
- Figure 53: Europe Protein Engineering in Biotechnology Industry Revenue Share (%), by Country 2024 & 2032
- Figure 54: Europe Protein Engineering in Biotechnology Industry Volume Share (%), by Country 2024 & 2032
- Figure 55: Asia Pacific Protein Engineering in Biotechnology Industry Revenue (Million), by Product Type 2024 & 2032
- Figure 56: Asia Pacific Protein Engineering in Biotechnology Industry Volume (K Unit), by Product Type 2024 & 2032
- Figure 57: Asia Pacific Protein Engineering in Biotechnology Industry Revenue Share (%), by Product Type 2024 & 2032
- Figure 58: Asia Pacific Protein Engineering in Biotechnology Industry Volume Share (%), by Product Type 2024 & 2032
- Figure 59: Asia Pacific Protein Engineering in Biotechnology Industry Revenue (Million), by Technology 2024 & 2032
- Figure 60: Asia Pacific Protein Engineering in Biotechnology Industry Volume (K Unit), by Technology 2024 & 2032
- Figure 61: Asia Pacific Protein Engineering in Biotechnology Industry Revenue Share (%), by Technology 2024 & 2032
- Figure 62: Asia Pacific Protein Engineering in Biotechnology Industry Volume Share (%), by Technology 2024 & 2032
- Figure 63: Asia Pacific Protein Engineering in Biotechnology Industry Revenue (Million), by End User 2024 & 2032
- Figure 64: Asia Pacific Protein Engineering in Biotechnology Industry Volume (K Unit), by End User 2024 & 2032
- Figure 65: Asia Pacific Protein Engineering in Biotechnology Industry Revenue Share (%), by End User 2024 & 2032
- Figure 66: Asia Pacific Protein Engineering in Biotechnology Industry Volume Share (%), by End User 2024 & 2032
- Figure 67: Asia Pacific Protein Engineering in Biotechnology Industry Revenue (Million), by Country 2024 & 2032
- Figure 68: Asia Pacific Protein Engineering in Biotechnology Industry Volume (K Unit), by Country 2024 & 2032
- Figure 69: Asia Pacific Protein Engineering in Biotechnology Industry Revenue Share (%), by Country 2024 & 2032
- Figure 70: Asia Pacific Protein Engineering in Biotechnology Industry Volume Share (%), by Country 2024 & 2032
- Figure 71: Middle East and Africa Protein Engineering in Biotechnology Industry Revenue (Million), by Product Type 2024 & 2032
- Figure 72: Middle East and Africa Protein Engineering in Biotechnology Industry Volume (K Unit), by Product Type 2024 & 2032
- Figure 73: Middle East and Africa Protein Engineering in Biotechnology Industry Revenue Share (%), by Product Type 2024 & 2032
- Figure 74: Middle East and Africa Protein Engineering in Biotechnology Industry Volume Share (%), by Product Type 2024 & 2032
- Figure 75: Middle East and Africa Protein Engineering in Biotechnology Industry Revenue (Million), by Technology 2024 & 2032
- Figure 76: Middle East and Africa Protein Engineering in Biotechnology Industry Volume (K Unit), by Technology 2024 & 2032
- Figure 77: Middle East and Africa Protein Engineering in Biotechnology Industry Revenue Share (%), by Technology 2024 & 2032
- Figure 78: Middle East and Africa Protein Engineering in Biotechnology Industry Volume Share (%), by Technology 2024 & 2032
- Figure 79: Middle East and Africa Protein Engineering in Biotechnology Industry Revenue (Million), by End User 2024 & 2032
- Figure 80: Middle East and Africa Protein Engineering in Biotechnology Industry Volume (K Unit), by End User 2024 & 2032
- Figure 81: Middle East and Africa Protein Engineering in Biotechnology Industry Revenue Share (%), by End User 2024 & 2032
- Figure 82: Middle East and Africa Protein Engineering in Biotechnology Industry Volume Share (%), by End User 2024 & 2032
- Figure 83: Middle East and Africa Protein Engineering in Biotechnology Industry Revenue (Million), by Country 2024 & 2032
- Figure 84: Middle East and Africa Protein Engineering in Biotechnology Industry Volume (K Unit), by Country 2024 & 2032
- Figure 85: Middle East and Africa Protein Engineering in Biotechnology Industry Revenue Share (%), by Country 2024 & 2032
- Figure 86: Middle East and Africa Protein Engineering in Biotechnology Industry Volume Share (%), by Country 2024 & 2032
- Figure 87: South America Protein Engineering in Biotechnology Industry Revenue (Million), by Product Type 2024 & 2032
- Figure 88: South America Protein Engineering in Biotechnology Industry Volume (K Unit), by Product Type 2024 & 2032
- Figure 89: South America Protein Engineering in Biotechnology Industry Revenue Share (%), by Product Type 2024 & 2032
- Figure 90: South America Protein Engineering in Biotechnology Industry Volume Share (%), by Product Type 2024 & 2032
- Figure 91: South America Protein Engineering in Biotechnology Industry Revenue (Million), by Technology 2024 & 2032
- Figure 92: South America Protein Engineering in Biotechnology Industry Volume (K Unit), by Technology 2024 & 2032
- Figure 93: South America Protein Engineering in Biotechnology Industry Revenue Share (%), by Technology 2024 & 2032
- Figure 94: South America Protein Engineering in Biotechnology Industry Volume Share (%), by Technology 2024 & 2032
- Figure 95: South America Protein Engineering in Biotechnology Industry Revenue (Million), by End User 2024 & 2032
- Figure 96: South America Protein Engineering in Biotechnology Industry Volume (K Unit), by End User 2024 & 2032
- Figure 97: South America Protein Engineering in Biotechnology Industry Revenue Share (%), by End User 2024 & 2032
- Figure 98: South America Protein Engineering in Biotechnology Industry Volume Share (%), by End User 2024 & 2032
- Figure 99: South America Protein Engineering in Biotechnology Industry Revenue (Million), by Country 2024 & 2032
- Figure 100: South America Protein Engineering in Biotechnology Industry Volume (K Unit), by Country 2024 & 2032
- Figure 101: South America Protein Engineering in Biotechnology Industry Revenue Share (%), by Country 2024 & 2032
- Figure 102: South America Protein Engineering in Biotechnology Industry Volume Share (%), by Country 2024 & 2032
List of Tables
- Table 1: Global Protein Engineering in Biotechnology Industry Revenue Million Forecast, by Region 2019 & 2032
- Table 2: Global Protein Engineering in Biotechnology Industry Volume K Unit Forecast, by Region 2019 & 2032
- Table 3: Global Protein Engineering in Biotechnology Industry Revenue Million Forecast, by Product Type 2019 & 2032
- Table 4: Global Protein Engineering in Biotechnology Industry Volume K Unit Forecast, by Product Type 2019 & 2032
- Table 5: Global Protein Engineering in Biotechnology Industry Revenue Million Forecast, by Technology 2019 & 2032
- Table 6: Global Protein Engineering in Biotechnology Industry Volume K Unit Forecast, by Technology 2019 & 2032
- Table 7: Global Protein Engineering in Biotechnology Industry Revenue Million Forecast, by End User 2019 & 2032
- Table 8: Global Protein Engineering in Biotechnology Industry Volume K Unit Forecast, by End User 2019 & 2032
- Table 9: Global Protein Engineering in Biotechnology Industry Revenue Million Forecast, by Region 2019 & 2032
- Table 10: Global Protein Engineering in Biotechnology Industry Volume K Unit Forecast, by Region 2019 & 2032
- Table 11: Global Protein Engineering in Biotechnology Industry Revenue Million Forecast, by Country 2019 & 2032
- Table 12: Global Protein Engineering in Biotechnology Industry Volume K Unit Forecast, by Country 2019 & 2032
- Table 13: United States Protein Engineering in Biotechnology Industry Revenue (Million) Forecast, by Application 2019 & 2032
- Table 14: United States Protein Engineering in Biotechnology Industry Volume (K Unit) Forecast, by Application 2019 & 2032
- Table 15: Canada Protein Engineering in Biotechnology Industry Revenue (Million) Forecast, by Application 2019 & 2032
- Table 16: Canada Protein Engineering in Biotechnology Industry Volume (K Unit) Forecast, by Application 2019 & 2032
- Table 17: Mexico Protein Engineering in Biotechnology Industry Revenue (Million) Forecast, by Application 2019 & 2032
- Table 18: Mexico Protein Engineering in Biotechnology Industry Volume (K Unit) Forecast, by Application 2019 & 2032
- Table 19: Global Protein Engineering in Biotechnology Industry Revenue Million Forecast, by Country 2019 & 2032
- Table 20: Global Protein Engineering in Biotechnology Industry Volume K Unit Forecast, by Country 2019 & 2032
- Table 21: Germany Protein Engineering in Biotechnology Industry Revenue (Million) Forecast, by Application 2019 & 2032
- Table 22: Germany Protein Engineering in Biotechnology Industry Volume (K Unit) Forecast, by Application 2019 & 2032
- Table 23: United Kingdom Protein Engineering in Biotechnology Industry Revenue (Million) Forecast, by Application 2019 & 2032
- Table 24: United Kingdom Protein Engineering in Biotechnology Industry Volume (K Unit) Forecast, by Application 2019 & 2032
- Table 25: France Protein Engineering in Biotechnology Industry Revenue (Million) Forecast, by Application 2019 & 2032
- Table 26: France Protein Engineering in Biotechnology Industry Volume (K Unit) Forecast, by Application 2019 & 2032
- Table 27: Italy Protein Engineering in Biotechnology Industry Revenue (Million) Forecast, by Application 2019 & 2032
- Table 28: Italy Protein Engineering in Biotechnology Industry Volume (K Unit) Forecast, by Application 2019 & 2032
- Table 29: Spain Protein Engineering in Biotechnology Industry Revenue (Million) Forecast, by Application 2019 & 2032
- Table 30: Spain Protein Engineering in Biotechnology Industry Volume (K Unit) Forecast, by Application 2019 & 2032
- Table 31: Rest of Europe Protein Engineering in Biotechnology Industry Revenue (Million) Forecast, by Application 2019 & 2032
- Table 32: Rest of Europe Protein Engineering in Biotechnology Industry Volume (K Unit) Forecast, by Application 2019 & 2032
- Table 33: Global Protein Engineering in Biotechnology Industry Revenue Million Forecast, by Country 2019 & 2032
- Table 34: Global Protein Engineering in Biotechnology Industry Volume K Unit Forecast, by Country 2019 & 2032
- Table 35: China Protein Engineering in Biotechnology Industry Revenue (Million) Forecast, by Application 2019 & 2032
- Table 36: China Protein Engineering in Biotechnology Industry Volume (K Unit) Forecast, by Application 2019 & 2032
- Table 37: Japan Protein Engineering in Biotechnology Industry Revenue (Million) Forecast, by Application 2019 & 2032
- Table 38: Japan Protein Engineering in Biotechnology Industry Volume (K Unit) Forecast, by Application 2019 & 2032
- Table 39: India Protein Engineering in Biotechnology Industry Revenue (Million) Forecast, by Application 2019 & 2032
- Table 40: India Protein Engineering in Biotechnology Industry Volume (K Unit) Forecast, by Application 2019 & 2032
- Table 41: Australia Protein Engineering in Biotechnology Industry Revenue (Million) Forecast, by Application 2019 & 2032
- Table 42: Australia Protein Engineering in Biotechnology Industry Volume (K Unit) Forecast, by Application 2019 & 2032
- Table 43: South Korea Protein Engineering in Biotechnology Industry Revenue (Million) Forecast, by Application 2019 & 2032
- Table 44: South Korea Protein Engineering in Biotechnology Industry Volume (K Unit) Forecast, by Application 2019 & 2032
- Table 45: Rest of Asia Pacific Protein Engineering in Biotechnology Industry Revenue (Million) Forecast, by Application 2019 & 2032
- Table 46: Rest of Asia Pacific Protein Engineering in Biotechnology Industry Volume (K Unit) Forecast, by Application 2019 & 2032
- Table 47: Global Protein Engineering in Biotechnology Industry Revenue Million Forecast, by Country 2019 & 2032
- Table 48: Global Protein Engineering in Biotechnology Industry Volume K Unit Forecast, by Country 2019 & 2032
- Table 49: GCC Protein Engineering in Biotechnology Industry Revenue (Million) Forecast, by Application 2019 & 2032
- Table 50: GCC Protein Engineering in Biotechnology Industry Volume (K Unit) Forecast, by Application 2019 & 2032
- Table 51: South Africa Protein Engineering in Biotechnology Industry Revenue (Million) Forecast, by Application 2019 & 2032
- Table 52: South Africa Protein Engineering in Biotechnology Industry Volume (K Unit) Forecast, by Application 2019 & 2032
- Table 53: Rest of Middle East and Africa Protein Engineering in Biotechnology Industry Revenue (Million) Forecast, by Application 2019 & 2032
- Table 54: Rest of Middle East and Africa Protein Engineering in Biotechnology Industry Volume (K Unit) Forecast, by Application 2019 & 2032
- Table 55: Global Protein Engineering in Biotechnology Industry Revenue Million Forecast, by Country 2019 & 2032
- Table 56: Global Protein Engineering in Biotechnology Industry Volume K Unit Forecast, by Country 2019 & 2032
- Table 57: Brazil Protein Engineering in Biotechnology Industry Revenue (Million) Forecast, by Application 2019 & 2032
- Table 58: Brazil Protein Engineering in Biotechnology Industry Volume (K Unit) Forecast, by Application 2019 & 2032
- Table 59: Argentina Protein Engineering in Biotechnology Industry Revenue (Million) Forecast, by Application 2019 & 2032
- Table 60: Argentina Protein Engineering in Biotechnology Industry Volume (K Unit) Forecast, by Application 2019 & 2032
- Table 61: Rest of South America Protein Engineering in Biotechnology Industry Revenue (Million) Forecast, by Application 2019 & 2032
- Table 62: Rest of South America Protein Engineering in Biotechnology Industry Volume (K Unit) Forecast, by Application 2019 & 2032
- Table 63: Global Protein Engineering in Biotechnology Industry Revenue Million Forecast, by Product Type 2019 & 2032
- Table 64: Global Protein Engineering in Biotechnology Industry Volume K Unit Forecast, by Product Type 2019 & 2032
- Table 65: Global Protein Engineering in Biotechnology Industry Revenue Million Forecast, by Technology 2019 & 2032
- Table 66: Global Protein Engineering in Biotechnology Industry Volume K Unit Forecast, by Technology 2019 & 2032
- Table 67: Global Protein Engineering in Biotechnology Industry Revenue Million Forecast, by End User 2019 & 2032
- Table 68: Global Protein Engineering in Biotechnology Industry Volume K Unit Forecast, by End User 2019 & 2032
- Table 69: Global Protein Engineering in Biotechnology Industry Revenue Million Forecast, by Country 2019 & 2032
- Table 70: Global Protein Engineering in Biotechnology Industry Volume K Unit Forecast, by Country 2019 & 2032
- Table 71: United States Protein Engineering in Biotechnology Industry Revenue (Million) Forecast, by Application 2019 & 2032
- Table 72: United States Protein Engineering in Biotechnology Industry Volume (K Unit) Forecast, by Application 2019 & 2032
- Table 73: Canada Protein Engineering in Biotechnology Industry Revenue (Million) Forecast, by Application 2019 & 2032
- Table 74: Canada Protein Engineering in Biotechnology Industry Volume (K Unit) Forecast, by Application 2019 & 2032
- Table 75: Mexico Protein Engineering in Biotechnology Industry Revenue (Million) Forecast, by Application 2019 & 2032
- Table 76: Mexico Protein Engineering in Biotechnology Industry Volume (K Unit) Forecast, by Application 2019 & 2032
- Table 77: Global Protein Engineering in Biotechnology Industry Revenue Million Forecast, by Product Type 2019 & 2032
- Table 78: Global Protein Engineering in Biotechnology Industry Volume K Unit Forecast, by Product Type 2019 & 2032
- Table 79: Global Protein Engineering in Biotechnology Industry Revenue Million Forecast, by Technology 2019 & 2032
- Table 80: Global Protein Engineering in Biotechnology Industry Volume K Unit Forecast, by Technology 2019 & 2032
- Table 81: Global Protein Engineering in Biotechnology Industry Revenue Million Forecast, by End User 2019 & 2032
- Table 82: Global Protein Engineering in Biotechnology Industry Volume K Unit Forecast, by End User 2019 & 2032
- Table 83: Global Protein Engineering in Biotechnology Industry Revenue Million Forecast, by Country 2019 & 2032
- Table 84: Global Protein Engineering in Biotechnology Industry Volume K Unit Forecast, by Country 2019 & 2032
- Table 85: Germany Protein Engineering in Biotechnology Industry Revenue (Million) Forecast, by Application 2019 & 2032
- Table 86: Germany Protein Engineering in Biotechnology Industry Volume (K Unit) Forecast, by Application 2019 & 2032
- Table 87: United Kingdom Protein Engineering in Biotechnology Industry Revenue (Million) Forecast, by Application 2019 & 2032
- Table 88: United Kingdom Protein Engineering in Biotechnology Industry Volume (K Unit) Forecast, by Application 2019 & 2032
- Table 89: France Protein Engineering in Biotechnology Industry Revenue (Million) Forecast, by Application 2019 & 2032
- Table 90: France Protein Engineering in Biotechnology Industry Volume (K Unit) Forecast, by Application 2019 & 2032
- Table 91: Italy Protein Engineering in Biotechnology Industry Revenue (Million) Forecast, by Application 2019 & 2032
- Table 92: Italy Protein Engineering in Biotechnology Industry Volume (K Unit) Forecast, by Application 2019 & 2032
- Table 93: Spain Protein Engineering in Biotechnology Industry Revenue (Million) Forecast, by Application 2019 & 2032
- Table 94: Spain Protein Engineering in Biotechnology Industry Volume (K Unit) Forecast, by Application 2019 & 2032
- Table 95: Rest of Europe Protein Engineering in Biotechnology Industry Revenue (Million) Forecast, by Application 2019 & 2032
- Table 96: Rest of Europe Protein Engineering in Biotechnology Industry Volume (K Unit) Forecast, by Application 2019 & 2032
- Table 97: Global Protein Engineering in Biotechnology Industry Revenue Million Forecast, by Product Type 2019 & 2032
- Table 98: Global Protein Engineering in Biotechnology Industry Volume K Unit Forecast, by Product Type 2019 & 2032
- Table 99: Global Protein Engineering in Biotechnology Industry Revenue Million Forecast, by Technology 2019 & 2032
- Table 100: Global Protein Engineering in Biotechnology Industry Volume K Unit Forecast, by Technology 2019 & 2032
- Table 101: Global Protein Engineering in Biotechnology Industry Revenue Million Forecast, by End User 2019 & 2032
- Table 102: Global Protein Engineering in Biotechnology Industry Volume K Unit Forecast, by End User 2019 & 2032
- Table 103: Global Protein Engineering in Biotechnology Industry Revenue Million Forecast, by Country 2019 & 2032
- Table 104: Global Protein Engineering in Biotechnology Industry Volume K Unit Forecast, by Country 2019 & 2032
- Table 105: China Protein Engineering in Biotechnology Industry Revenue (Million) Forecast, by Application 2019 & 2032
- Table 106: China Protein Engineering in Biotechnology Industry Volume (K Unit) Forecast, by Application 2019 & 2032
- Table 107: Japan Protein Engineering in Biotechnology Industry Revenue (Million) Forecast, by Application 2019 & 2032
- Table 108: Japan Protein Engineering in Biotechnology Industry Volume (K Unit) Forecast, by Application 2019 & 2032
- Table 109: India Protein Engineering in Biotechnology Industry Revenue (Million) Forecast, by Application 2019 & 2032
- Table 110: India Protein Engineering in Biotechnology Industry Volume (K Unit) Forecast, by Application 2019 & 2032
- Table 111: Australia Protein Engineering in Biotechnology Industry Revenue (Million) Forecast, by Application 2019 & 2032
- Table 112: Australia Protein Engineering in Biotechnology Industry Volume (K Unit) Forecast, by Application 2019 & 2032
- Table 113: South Korea Protein Engineering in Biotechnology Industry Revenue (Million) Forecast, by Application 2019 & 2032
- Table 114: South Korea Protein Engineering in Biotechnology Industry Volume (K Unit) Forecast, by Application 2019 & 2032
- Table 115: Rest of Asia Pacific Protein Engineering in Biotechnology Industry Revenue (Million) Forecast, by Application 2019 & 2032
- Table 116: Rest of Asia Pacific Protein Engineering in Biotechnology Industry Volume (K Unit) Forecast, by Application 2019 & 2032
- Table 117: Global Protein Engineering in Biotechnology Industry Revenue Million Forecast, by Product Type 2019 & 2032
- Table 118: Global Protein Engineering in Biotechnology Industry Volume K Unit Forecast, by Product Type 2019 & 2032
- Table 119: Global Protein Engineering in Biotechnology Industry Revenue Million Forecast, by Technology 2019 & 2032
- Table 120: Global Protein Engineering in Biotechnology Industry Volume K Unit Forecast, by Technology 2019 & 2032
- Table 121: Global Protein Engineering in Biotechnology Industry Revenue Million Forecast, by End User 2019 & 2032
- Table 122: Global Protein Engineering in Biotechnology Industry Volume K Unit Forecast, by End User 2019 & 2032
- Table 123: Global Protein Engineering in Biotechnology Industry Revenue Million Forecast, by Country 2019 & 2032
- Table 124: Global Protein Engineering in Biotechnology Industry Volume K Unit Forecast, by Country 2019 & 2032
- Table 125: GCC Protein Engineering in Biotechnology Industry Revenue (Million) Forecast, by Application 2019 & 2032
- Table 126: GCC Protein Engineering in Biotechnology Industry Volume (K Unit) Forecast, by Application 2019 & 2032
- Table 127: South Africa Protein Engineering in Biotechnology Industry Revenue (Million) Forecast, by Application 2019 & 2032
- Table 128: South Africa Protein Engineering in Biotechnology Industry Volume (K Unit) Forecast, by Application 2019 & 2032
- Table 129: Rest of Middle East and Africa Protein Engineering in Biotechnology Industry Revenue (Million) Forecast, by Application 2019 & 2032
- Table 130: Rest of Middle East and Africa Protein Engineering in Biotechnology Industry Volume (K Unit) Forecast, by Application 2019 & 2032
- Table 131: Global Protein Engineering in Biotechnology Industry Revenue Million Forecast, by Product Type 2019 & 2032
- Table 132: Global Protein Engineering in Biotechnology Industry Volume K Unit Forecast, by Product Type 2019 & 2032
- Table 133: Global Protein Engineering in Biotechnology Industry Revenue Million Forecast, by Technology 2019 & 2032
- Table 134: Global Protein Engineering in Biotechnology Industry Volume K Unit Forecast, by Technology 2019 & 2032
- Table 135: Global Protein Engineering in Biotechnology Industry Revenue Million Forecast, by End User 2019 & 2032
- Table 136: Global Protein Engineering in Biotechnology Industry Volume K Unit Forecast, by End User 2019 & 2032
- Table 137: Global Protein Engineering in Biotechnology Industry Revenue Million Forecast, by Country 2019 & 2032
- Table 138: Global Protein Engineering in Biotechnology Industry Volume K Unit Forecast, by Country 2019 & 2032
- Table 139: Brazil Protein Engineering in Biotechnology Industry Revenue (Million) Forecast, by Application 2019 & 2032
- Table 140: Brazil Protein Engineering in Biotechnology Industry Volume (K Unit) Forecast, by Application 2019 & 2032
- Table 141: Argentina Protein Engineering in Biotechnology Industry Revenue (Million) Forecast, by Application 2019 & 2032
- Table 142: Argentina Protein Engineering in Biotechnology Industry Volume (K Unit) Forecast, by Application 2019 & 2032
- Table 143: Rest of South America Protein Engineering in Biotechnology Industry Revenue (Million) Forecast, by Application 2019 & 2032
- Table 144: Rest of South America Protein Engineering in Biotechnology Industry Volume (K Unit) Forecast, by Application 2019 & 2032
Frequently Asked Questions
1. What is the projected Compound Annual Growth Rate (CAGR) of the Protein Engineering in Biotechnology Industry?
The projected CAGR is approximately 16.25%.
2. Which companies are prominent players in the Protein Engineering in Biotechnology Industry?
Key companies in the market include Novo Nordisk AS, Bio-Rad Laboratories Inc, Merck KGaA, Amgen Inc, Waters Corporation, Thermo Fisher Scientific Inc, Eli Lilly and Company, GenScript Biotech Corporation, Agilent Technologies Inc, PerkinElmer Inc, Bruker Corporation, GE HealthCare.
3. What are the main segments of the Protein Engineering in Biotechnology Industry?
The market segments include Product Type, Technology, End User.
4. Can you provide details about the market size?
The market size is estimated to be USD 3.52 Million as of 2022.
5. What are some drivers contributing to market growth?
Increasing Prevalence of Chronic Diseases and Rise in Demand for Targeted Therapies; Rising Government Funding for Protein Engineering Studies.
6. What are the notable trends driving market growth?
The Monoclonal Antibodies Segment is Anticipated to Witness Notable Growth Over the Forecast Period.
7. Are there any restraints impacting market growth?
High Costs of Protein Engineering Techniques.
8. Can you provide examples of recent developments in the market?
April 2024: Northpond-funded Laboratory for Bioengineering Research and Innovation made an investment with the Wyss Institute for the AmnioX project to facilitate the development of protein-based drugs, thus improving the accessibility of medicines to patients.
9. What pricing options are available for accessing the report?
Pricing options include single-user, multi-user, and enterprise licenses priced at USD 4750, USD 5250, and USD 8750 respectively.
10. Is the market size provided in terms of value or volume?
The market size is provided in terms of value, measured in Million and volume, measured in K Unit.
11. Are there any specific market keywords associated with the report?
Yes, the market keyword associated with the report is "Protein Engineering in Biotechnology Industry," which aids in identifying and referencing the specific market segment covered.
12. How do I determine which pricing option suits my needs best?
The pricing options vary based on user requirements and access needs. Individual users may opt for single-user licenses, while businesses requiring broader access may choose multi-user or enterprise licenses for cost-effective access to the report.
13. Are there any additional resources or data provided in the Protein Engineering in Biotechnology Industry report?
While the report offers comprehensive insights, it's advisable to review the specific contents or supplementary materials provided to ascertain if additional resources or data are available.
14. How can I stay updated on further developments or reports in the Protein Engineering in Biotechnology Industry?
To stay informed about further developments, trends, and reports in the Protein Engineering in Biotechnology Industry, consider subscribing to industry newsletters, following relevant companies and organizations, or regularly checking reputable industry news sources and publications.
Methodology
Step 1 - Identification of Relevant Samples Size from Population Database


Step 2 - Approaches for Defining Global Market Size (Value, Volume* & Price*)

Note*: In applicable scenarios
Step 3 - Data Sources
Primary Research
- Web Analytics
- Survey Reports
- Research Institute
- Latest Research Reports
- Opinion Leaders
Secondary Research
- Annual Reports
- White Paper
- Latest Press Release
- Industry Association
- Paid Database
- Investor Presentations

Step 4 - Data Triangulation
Involves using different sources of information in order to increase the validity of a study
These sources are likely to be stakeholders in a program - participants, other researchers, program staff, other community members, and so on.
Then we put all data in single framework & apply various statistical tools to find out the dynamic on the market.
During the analysis stage, feedback from the stakeholder groups would be compared to determine areas of agreement as well as areas of divergence
