

Key Insights
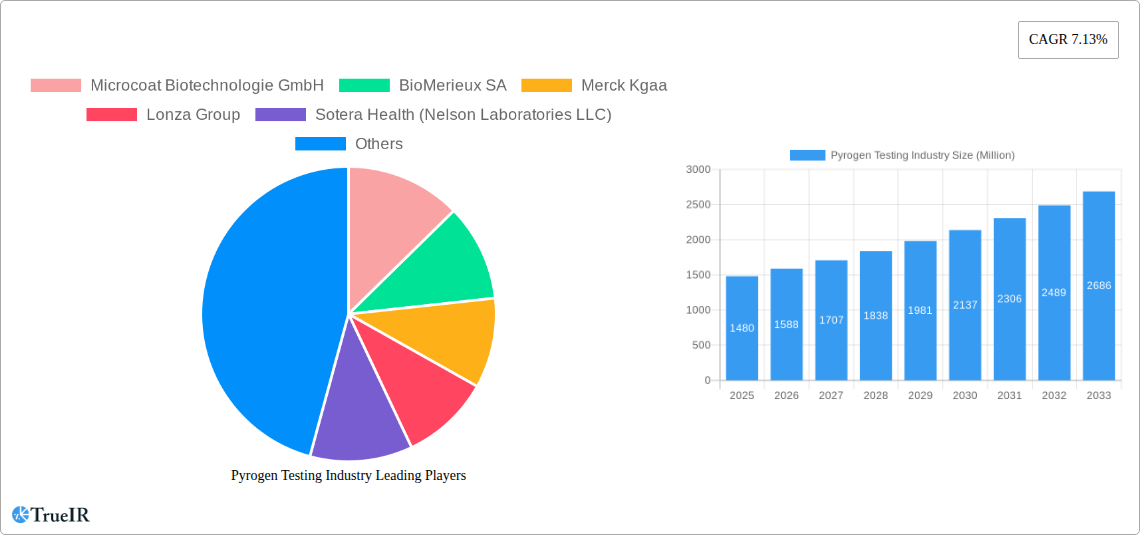
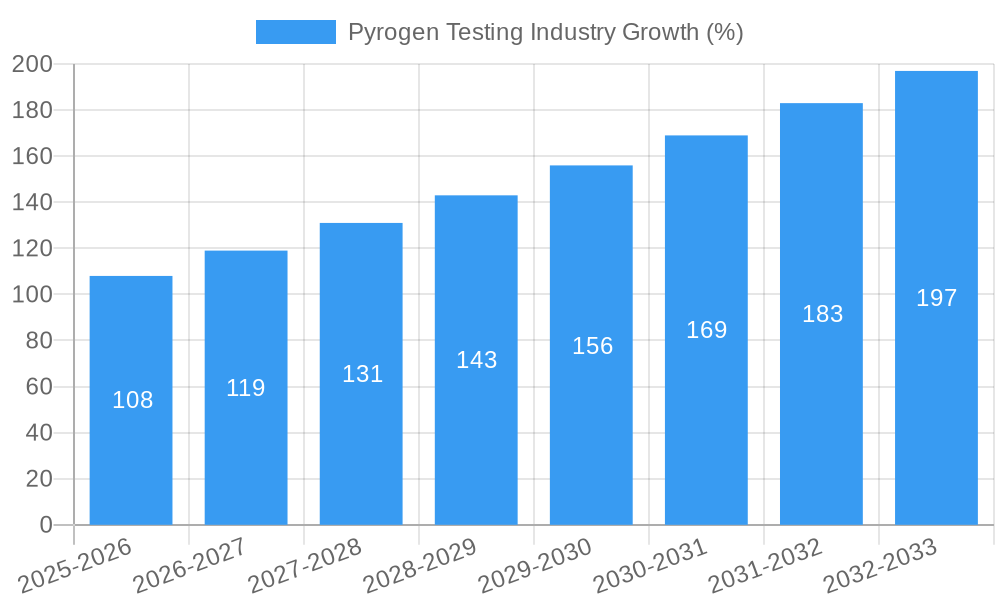
The pyrogen testing market, valued at $1.48 billion in 2025, is experiencing robust growth, projected to expand at a Compound Annual Growth Rate (CAGR) of 7.13% from 2025 to 2033. This expansion is fueled by several key factors. The increasing stringency of regulatory requirements for pharmaceutical and biotech products globally is a major driver, demanding rigorous pyrogen testing to ensure product safety and efficacy. Furthermore, the rising prevalence of chronic diseases and the consequent surge in drug development and manufacturing activities contribute significantly to market growth. Technological advancements in pyrogen testing methods, such as the development of more sensitive and automated systems, are also enhancing efficiency and accuracy, boosting market adoption. The market is segmented by test type (Gel Clot, LAL, Monocyte Activation Test etc.), product (kits, reagents, services, instruments), and end-user (pharmaceutical and biotechnology companies, medical device companies). The pharmaceutical and biotechnology sector constitutes the largest segment, driven by their critical need for pyrogen-free products. Geographic expansion, particularly in emerging markets with growing healthcare infrastructure, presents substantial growth opportunities. However, the market faces certain challenges, including the high cost of advanced testing technologies and the potential for variability in test results depending on methodologies employed. Nonetheless, the overall outlook for the pyrogen testing market remains strongly positive, driven by unwavering regulatory scrutiny and the expanding biopharmaceutical industry.
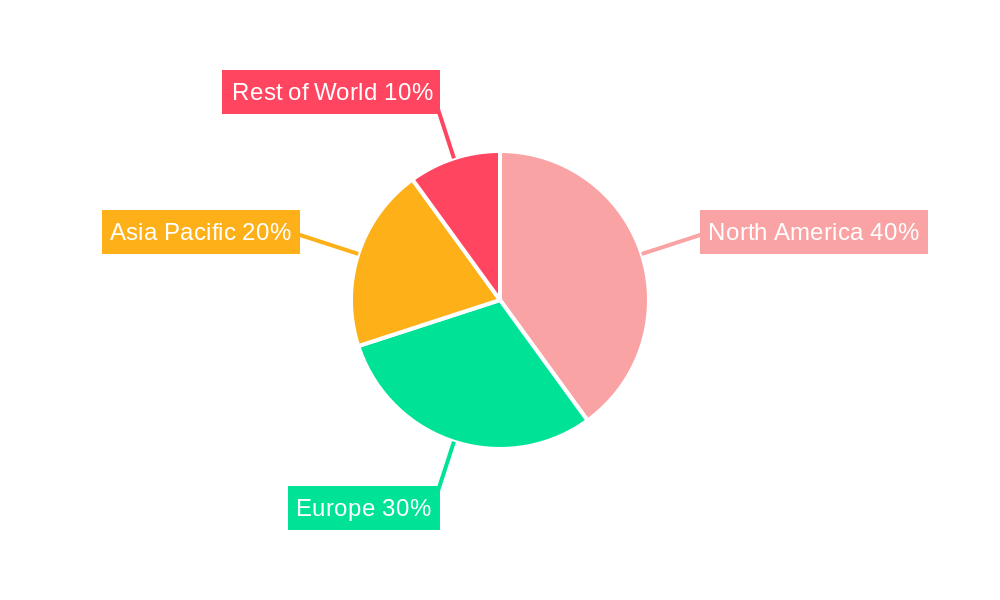
The North American region currently holds a significant market share, largely due to the presence of established pharmaceutical companies and robust regulatory frameworks. However, the Asia-Pacific region is expected to witness the fastest growth rate during the forecast period, driven by increasing healthcare spending, a burgeoning pharmaceutical industry, and rising adoption of advanced pyrogen testing technologies. Competition among established players like BioMerieux SA, Merck Kgaa, and Thermo Fisher Scientific Inc., alongside the emergence of specialized niche players, is fostering innovation and creating a dynamic market landscape. Strategic collaborations, mergers and acquisitions, and the continuous development of improved testing methodologies are all expected to shape the future of the pyrogen testing market, ensuring its sustained expansion.
Pyrogen Testing Industry Market Report: 2019-2033
This comprehensive report provides a detailed analysis of the global pyrogen testing industry, encompassing market size, segmentation, competitive landscape, and future projections. The study period covers 2019-2033, with 2025 serving as the base and estimated year. The forecast period extends from 2025 to 2033, while the historical period analyzed is 2019-2024. This report projects a market value exceeding $XX Million by 2033, representing a significant growth trajectory.
Pyrogen Testing Industry Market Structure & Competitive Landscape
The global pyrogen testing market is characterized by a moderately concentrated structure, with several key players holding significant market share. The market’s estimated value in 2025 is $XX Million. The top 10 companies account for an estimated XX% of the market share. Key drivers of innovation include the development of more sensitive and rapid pyrogen detection methods, and the increasing demand for automated and high-throughput testing systems. Regulatory bodies like the FDA and EMA exert significant influence, mandating stringent quality control measures and driving the adoption of advanced technologies. Product substitutes, such as alternative endotoxin detection methods, pose a moderate competitive threat. The market witnesses continuous M&A activity, with a total estimated M&A volume of $XX Million in deals in the last five years. This activity reflects the strategic consolidation of the industry and the expansion of service offerings.
- High Market Concentration: Top 10 players hold approximately XX% of market share in 2025.
- Key Innovation Drivers: Development of rapid and sensitive pyrogen detection methods, automation, and high-throughput systems.
- Regulatory Impact: Stringent regulations from FDA and EMA drive adoption of advanced technologies.
- End-User Segmentation: Pharmaceutical and biotechnology companies constitute the largest end-user segment.
- M&A Activity: Significant M&A activity observed, with estimated $XX Million in deals over the past five years.
Pyrogen Testing Industry Market Trends & Opportunities
The pyrogen testing market is experiencing robust growth, driven by several factors. The market size is projected to reach $XX Million by 2033, exhibiting a Compound Annual Growth Rate (CAGR) of XX% during the forecast period. This growth is fueled by rising demand from the pharmaceutical and biotechnology sectors, particularly with the increase in biopharmaceutical production and the stringent regulatory requirements for drug safety. Technological advancements, such as the development of automated systems and rapid testing methods, are increasing testing efficiency and reducing turnaround times. The shift towards outsourcing pyrogen testing to specialized laboratories also contributes to market expansion. Consumer preferences are increasingly favoring rapid, reliable, and cost-effective pyrogen testing solutions, driving innovation within the industry. Competitive dynamics are characterized by a mix of established players and emerging companies, fostering innovation and price competition. Market penetration rates are projected to increase steadily, particularly in emerging economies with growing pharmaceutical industries.
Dominant Markets & Segments in Pyrogen Testing Industry
The North American region holds a dominant position in the global pyrogen testing market, driven by robust pharmaceutical and biotechnology sectors, stringent regulatory environments, and high investment in R&D. Within the segments, LAL (Limulus Amebocyte Lysate) tests are the most widely used method, capturing the largest market share, followed by the Monocyte Activation Test (MAT). Pharmaceutical and Biotechnology companies represent the largest end-user segment, while Kits and Reagents constitute the largest product category.
- Key Growth Drivers in North America:
- Stringent regulatory environment.
- Large pharmaceutical and biotechnology industry.
- High R&D investment.
- Dominant Segments:
- Test Type: LAL Tests (largest market share)
- End-User: Pharmaceutical and Biotechnology Companies
- Product: Kits and Reagents
Pyrogen Testing Industry Product Analysis
The pyrogen testing market offers a diverse range of products, including kits and reagents, instruments, and services. Recent innovations focus on improving sensitivity, speed, and automation of testing methods. Products like automated LAL systems and advanced MAT kits are gaining popularity due to their increased efficiency and reduced manual handling. The competitive advantage lies in offering superior sensitivity, accuracy, speed, and cost-effectiveness. Miniaturization and disposables are also emerging trends impacting this field.
Key Drivers, Barriers & Challenges in Pyrogen Testing Industry
Key Drivers: The increasing demand for safe and effective pharmaceutical and biopharmaceutical products is a primary driver, pushing for accurate and reliable pyrogen testing. Stringent regulatory compliance necessitates accurate testing methods. Technological advancements, like automation and rapid testing technologies, improve efficiency and reduce costs.
Challenges: Regulatory hurdles and complexities concerning test validation and standardization pose significant challenges. Supply chain disruptions, particularly concerning the availability of LAL reagents derived from horseshoe crabs, can impact testing capacity. Intense competition and price pressures necessitate continuous innovation and cost optimization. These challenges impact the market by limiting growth and increasing the operational costs of testing laboratories.
Growth Drivers in the Pyrogen Testing Industry Market
Several factors fuel the growth of the pyrogen testing industry. The increasing prevalence of injectable drugs and biopharmaceuticals boosts demand for pyrogen testing services. Stringent regulations from health agencies worldwide necessitate rigorous quality control measures. Technological advancements in testing methods increase testing efficiency, sensitivity, and speed. The outsourcing of pyrogen testing by pharmaceutical companies to specialized laboratories creates additional market opportunities.
Challenges Impacting Pyrogen Testing Industry Growth
Regulatory hurdles, particularly the complexities of obtaining approvals for new testing methods, represent a major challenge. Supply chain vulnerabilities in sourcing LAL reagents, a critical component in many pyrogen tests, threaten market stability. The intense competition among testing service providers and reagent manufacturers necessitates continuous innovation and cost optimization, adding another layer of complexity.
Key Players Shaping the Pyrogen Testing Industry Market
- Microcoat Biotechnologie GmbH
- BioMerieux SA
- Merck Kgaa
- Lonza Group
- Sotera Health (Nelson Laboratories LLC)
- Fujifilm Holdings Corporation (FUJIFILM Wako Pure Chemical Corporation)
- Eurofins Scientific
- Thermo Fisher Scientific Inc
- WUXI Pharmatech (Cayman) Inc
- Genscript
- Associates of Cape Cod Inc (Seikagaku Biobusiness Corporation)
- Charles River Laboratories Inc
- Sanquin
- Pyrostar
- Ellab AS
Significant Pyrogen Testing Industry Milestones
- 2020: Several companies launched automated LAL testing systems, increasing throughput and reducing turnaround time.
- 2021: New regulatory guidelines on pyrogen testing were issued by the EMA, driving adoption of more sensitive methods.
- 2022: A major merger between two key players reshaped the competitive landscape.
- 2023: Several significant product launches occurred in the rapid pyrogen testing segment.
Future Outlook for Pyrogen Testing Industry Market
The future outlook for the pyrogen testing industry remains positive, driven by sustained growth in the pharmaceutical and biotechnology sectors, increased regulatory scrutiny, and continuous technological advancements. Opportunities lie in developing more sensitive, rapid, and cost-effective testing methods, as well as expanding into emerging markets. The industry is poised for significant growth, spurred by the increasing demand for reliable pyrogen testing to ensure the safety and efficacy of pharmaceutical products.
Pyrogen Testing Industry Segmentation
-
1. Product
- 1.1. Kits and Reagents
- 1.2. Services
- 1.3. Instruments
-
2. Test Type
-
2.1. LAL Tests
- 2.1.1. Chromogenic Tests
- 2.1.2. Turbidimetric Tests
- 2.1.3. Gel Clot Tests
- 2.2. Rabbit Pyrogen Test
- 2.3. Monocyte Activation Test
- 2.4. Other Test Types
-
2.1. LAL Tests
-
3. End User
- 3.1. Pharmaceutical and Biotechnology Companies
- 3.2. Medical Device Companies
- 3.3. Other End Users
Pyrogen Testing Industry Segmentation By Geography
-
1. North America
- 1.1. United States
- 1.2. Canada
- 1.3. Mexico
-
2. Europe
- 2.1. Germany
- 2.2. United Kingdom
- 2.3. France
- 2.4. Italy
- 2.5. Spain
- 2.6. Rest of Europe
-
3. Asia Pacific
- 3.1. China
- 3.2. Japan
- 3.3. India
- 3.4. Australia
- 3.5. South Korea
- 3.6. Rest of Asia Pacific
-
4. Middle East and Africa
- 4.1. GCC
- 4.2. South Africa
- 4.3. Rest of Middle East and Africa
-
5. South America
- 5.1. Brazil
- 5.2. Argentina
- 5.3. Rest of South America
Pyrogen Testing Industry REPORT HIGHLIGHTS
| Aspects | Details |
|---|---|
| Study Period | 2019-2033 |
| Base Year | 2024 |
| Estimated Year | 2025 |
| Forecast Period | 2025-2033 |
| Historical Period | 2019-2024 |
| Growth Rate | CAGR of 7.13% from 2019-2033 |
| Segmentation |
|
Table of Contents
- 1. Introduction
- 1.1. Research Scope
- 1.2. Market Segmentation
- 1.3. Research Methodology
- 1.4. Definitions and Assumptions
- 2. Executive Summary
- 2.1. Introduction
- 3. Market Dynamics
- 3.1. Introduction
- 3.2. Market Drivers
- 3.2.1. Rapid Growth in Pharmaceutical and Biotechnology Industries; Rising R&D Expenditure in Life Science
- 3.3. Market Restrains
- 3.3.1. Stringent Government Regulations
- 3.4. Market Trends
- 3.4.1. The Monocyte Activation Test Segment is Expected to Witness Good Growth Over the Forecast Period
- 4. Market Factor Analysis
- 4.1. Porters Five Forces
- 4.2. Supply/Value Chain
- 4.3. PESTEL analysis
- 4.4. Market Entropy
- 4.5. Patent/Trademark Analysis
- 5. Global Pyrogen Testing Industry Analysis, Insights and Forecast, 2019-2031
- 5.1. Market Analysis, Insights and Forecast - by Product
- 5.1.1. Kits and Reagents
- 5.1.2. Services
- 5.1.3. Instruments
- 5.2. Market Analysis, Insights and Forecast - by Test Type
- 5.2.1. LAL Tests
- 5.2.1.1. Chromogenic Tests
- 5.2.1.2. Turbidimetric Tests
- 5.2.1.3. Gel Clot Tests
- 5.2.2. Rabbit Pyrogen Test
- 5.2.3. Monocyte Activation Test
- 5.2.4. Other Test Types
- 5.2.1. LAL Tests
- 5.3. Market Analysis, Insights and Forecast - by End User
- 5.3.1. Pharmaceutical and Biotechnology Companies
- 5.3.2. Medical Device Companies
- 5.3.3. Other End Users
- 5.4. Market Analysis, Insights and Forecast - by Region
- 5.4.1. North America
- 5.4.2. Europe
- 5.4.3. Asia Pacific
- 5.4.4. Middle East and Africa
- 5.4.5. South America
- 5.1. Market Analysis, Insights and Forecast - by Product
- 6. North America Pyrogen Testing Industry Analysis, Insights and Forecast, 2019-2031
- 6.1. Market Analysis, Insights and Forecast - by Product
- 6.1.1. Kits and Reagents
- 6.1.2. Services
- 6.1.3. Instruments
- 6.2. Market Analysis, Insights and Forecast - by Test Type
- 6.2.1. LAL Tests
- 6.2.1.1. Chromogenic Tests
- 6.2.1.2. Turbidimetric Tests
- 6.2.1.3. Gel Clot Tests
- 6.2.2. Rabbit Pyrogen Test
- 6.2.3. Monocyte Activation Test
- 6.2.4. Other Test Types
- 6.2.1. LAL Tests
- 6.3. Market Analysis, Insights and Forecast - by End User
- 6.3.1. Pharmaceutical and Biotechnology Companies
- 6.3.2. Medical Device Companies
- 6.3.3. Other End Users
- 6.1. Market Analysis, Insights and Forecast - by Product
- 7. Europe Pyrogen Testing Industry Analysis, Insights and Forecast, 2019-2031
- 7.1. Market Analysis, Insights and Forecast - by Product
- 7.1.1. Kits and Reagents
- 7.1.2. Services
- 7.1.3. Instruments
- 7.2. Market Analysis, Insights and Forecast - by Test Type
- 7.2.1. LAL Tests
- 7.2.1.1. Chromogenic Tests
- 7.2.1.2. Turbidimetric Tests
- 7.2.1.3. Gel Clot Tests
- 7.2.2. Rabbit Pyrogen Test
- 7.2.3. Monocyte Activation Test
- 7.2.4. Other Test Types
- 7.2.1. LAL Tests
- 7.3. Market Analysis, Insights and Forecast - by End User
- 7.3.1. Pharmaceutical and Biotechnology Companies
- 7.3.2. Medical Device Companies
- 7.3.3. Other End Users
- 7.1. Market Analysis, Insights and Forecast - by Product
- 8. Asia Pacific Pyrogen Testing Industry Analysis, Insights and Forecast, 2019-2031
- 8.1. Market Analysis, Insights and Forecast - by Product
- 8.1.1. Kits and Reagents
- 8.1.2. Services
- 8.1.3. Instruments
- 8.2. Market Analysis, Insights and Forecast - by Test Type
- 8.2.1. LAL Tests
- 8.2.1.1. Chromogenic Tests
- 8.2.1.2. Turbidimetric Tests
- 8.2.1.3. Gel Clot Tests
- 8.2.2. Rabbit Pyrogen Test
- 8.2.3. Monocyte Activation Test
- 8.2.4. Other Test Types
- 8.2.1. LAL Tests
- 8.3. Market Analysis, Insights and Forecast - by End User
- 8.3.1. Pharmaceutical and Biotechnology Companies
- 8.3.2. Medical Device Companies
- 8.3.3. Other End Users
- 8.1. Market Analysis, Insights and Forecast - by Product
- 9. Middle East and Africa Pyrogen Testing Industry Analysis, Insights and Forecast, 2019-2031
- 9.1. Market Analysis, Insights and Forecast - by Product
- 9.1.1. Kits and Reagents
- 9.1.2. Services
- 9.1.3. Instruments
- 9.2. Market Analysis, Insights and Forecast - by Test Type
- 9.2.1. LAL Tests
- 9.2.1.1. Chromogenic Tests
- 9.2.1.2. Turbidimetric Tests
- 9.2.1.3. Gel Clot Tests
- 9.2.2. Rabbit Pyrogen Test
- 9.2.3. Monocyte Activation Test
- 9.2.4. Other Test Types
- 9.2.1. LAL Tests
- 9.3. Market Analysis, Insights and Forecast - by End User
- 9.3.1. Pharmaceutical and Biotechnology Companies
- 9.3.2. Medical Device Companies
- 9.3.3. Other End Users
- 9.1. Market Analysis, Insights and Forecast - by Product
- 10. South America Pyrogen Testing Industry Analysis, Insights and Forecast, 2019-2031
- 10.1. Market Analysis, Insights and Forecast - by Product
- 10.1.1. Kits and Reagents
- 10.1.2. Services
- 10.1.3. Instruments
- 10.2. Market Analysis, Insights and Forecast - by Test Type
- 10.2.1. LAL Tests
- 10.2.1.1. Chromogenic Tests
- 10.2.1.2. Turbidimetric Tests
- 10.2.1.3. Gel Clot Tests
- 10.2.2. Rabbit Pyrogen Test
- 10.2.3. Monocyte Activation Test
- 10.2.4. Other Test Types
- 10.2.1. LAL Tests
- 10.3. Market Analysis, Insights and Forecast - by End User
- 10.3.1. Pharmaceutical and Biotechnology Companies
- 10.3.2. Medical Device Companies
- 10.3.3. Other End Users
- 10.1. Market Analysis, Insights and Forecast - by Product
- 11. North America Pyrogen Testing Industry Analysis, Insights and Forecast, 2019-2031
- 11.1. Market Analysis, Insights and Forecast - By Country/Sub-region
- 11.1.1. undefined
- 12. Europe Pyrogen Testing Industry Analysis, Insights and Forecast, 2019-2031
- 12.1. Market Analysis, Insights and Forecast - By Country/Sub-region
- 12.1.1. undefined
- 13. Asia Pacific Pyrogen Testing Industry Analysis, Insights and Forecast, 2019-2031
- 13.1. Market Analysis, Insights and Forecast - By Country/Sub-region
- 13.1.1. undefined
- 14. Middle East and Africa Pyrogen Testing Industry Analysis, Insights and Forecast, 2019-2031
- 14.1. Market Analysis, Insights and Forecast - By Country/Sub-region
- 14.1.1. undefined
- 15. South America Pyrogen Testing Industry Analysis, Insights and Forecast, 2019-2031
- 15.1. Market Analysis, Insights and Forecast - By Country/Sub-region
- 15.1.1. undefined
- 16. Competitive Analysis
- 16.1. Global Market Share Analysis 2024
- 16.2. Company Profiles
- 16.2.1 Microcoat Biotechnologie GmbH
- 16.2.1.1. Overview
- 16.2.1.2. Products
- 16.2.1.3. SWOT Analysis
- 16.2.1.4. Recent Developments
- 16.2.1.5. Financials (Based on Availability)
- 16.2.2 BioMerieux SA
- 16.2.2.1. Overview
- 16.2.2.2. Products
- 16.2.2.3. SWOT Analysis
- 16.2.2.4. Recent Developments
- 16.2.2.5. Financials (Based on Availability)
- 16.2.3 Merck Kgaa
- 16.2.3.1. Overview
- 16.2.3.2. Products
- 16.2.3.3. SWOT Analysis
- 16.2.3.4. Recent Developments
- 16.2.3.5. Financials (Based on Availability)
- 16.2.4 Lonza Group
- 16.2.4.1. Overview
- 16.2.4.2. Products
- 16.2.4.3. SWOT Analysis
- 16.2.4.4. Recent Developments
- 16.2.4.5. Financials (Based on Availability)
- 16.2.5 Sotera Health (Nelson Laboratories LLC)
- 16.2.5.1. Overview
- 16.2.5.2. Products
- 16.2.5.3. SWOT Analysis
- 16.2.5.4. Recent Developments
- 16.2.5.5. Financials (Based on Availability)
- 16.2.6 Fujifilm Holdings Corporation (FUJIFILM Wako Pure Chemical Corporation)
- 16.2.6.1. Overview
- 16.2.6.2. Products
- 16.2.6.3. SWOT Analysis
- 16.2.6.4. Recent Developments
- 16.2.6.5. Financials (Based on Availability)
- 16.2.7 Eurofins Scientific
- 16.2.7.1. Overview
- 16.2.7.2. Products
- 16.2.7.3. SWOT Analysis
- 16.2.7.4. Recent Developments
- 16.2.7.5. Financials (Based on Availability)
- 16.2.8 Thermo Fisher Scientific Inc
- 16.2.8.1. Overview
- 16.2.8.2. Products
- 16.2.8.3. SWOT Analysis
- 16.2.8.4. Recent Developments
- 16.2.8.5. Financials (Based on Availability)
- 16.2.9 WUXI Pharmatech (Cayman) Inc
- 16.2.9.1. Overview
- 16.2.9.2. Products
- 16.2.9.3. SWOT Analysis
- 16.2.9.4. Recent Developments
- 16.2.9.5. Financials (Based on Availability)
- 16.2.10 Genscript
- 16.2.10.1. Overview
- 16.2.10.2. Products
- 16.2.10.3. SWOT Analysis
- 16.2.10.4. Recent Developments
- 16.2.10.5. Financials (Based on Availability)
- 16.2.11 Associates of Cape Cod Inc (Seikagaku Biobusiness Corporation)
- 16.2.11.1. Overview
- 16.2.11.2. Products
- 16.2.11.3. SWOT Analysis
- 16.2.11.4. Recent Developments
- 16.2.11.5. Financials (Based on Availability)
- 16.2.12 Microcoat Biotechnologie GmbH
- 16.2.12.1. Overview
- 16.2.12.2. Products
- 16.2.12.3. SWOT Analysis
- 16.2.12.4. Recent Developments
- 16.2.12.5. Financials (Based on Availability)
- 16.2.13 Charles River Laboratories Inc
- 16.2.13.1. Overview
- 16.2.13.2. Products
- 16.2.13.3. SWOT Analysis
- 16.2.13.4. Recent Developments
- 16.2.13.5. Financials (Based on Availability)
- 16.2.14 Sanquin
- 16.2.14.1. Overview
- 16.2.14.2. Products
- 16.2.14.3. SWOT Analysis
- 16.2.14.4. Recent Developments
- 16.2.14.5. Financials (Based on Availability)
- 16.2.15 Pyrostar
- 16.2.15.1. Overview
- 16.2.15.2. Products
- 16.2.15.3. SWOT Analysis
- 16.2.15.4. Recent Developments
- 16.2.15.5. Financials (Based on Availability)
- 16.2.16 Ellab AS
- 16.2.16.1. Overview
- 16.2.16.2. Products
- 16.2.16.3. SWOT Analysis
- 16.2.16.4. Recent Developments
- 16.2.16.5. Financials (Based on Availability)
- 16.2.1 Microcoat Biotechnologie GmbH
List of Figures
- Figure 1: Global Pyrogen Testing Industry Revenue Breakdown (Million, %) by Region 2024 & 2032
- Figure 2: Global Pyrogen Testing Industry Volume Breakdown (K Unit, %) by Region 2024 & 2032
- Figure 3: North America Pyrogen Testing Industry Revenue (Million), by Country 2024 & 2032
- Figure 4: North America Pyrogen Testing Industry Volume (K Unit), by Country 2024 & 2032
- Figure 5: North America Pyrogen Testing Industry Revenue Share (%), by Country 2024 & 2032
- Figure 6: North America Pyrogen Testing Industry Volume Share (%), by Country 2024 & 2032
- Figure 7: Europe Pyrogen Testing Industry Revenue (Million), by Country 2024 & 2032
- Figure 8: Europe Pyrogen Testing Industry Volume (K Unit), by Country 2024 & 2032
- Figure 9: Europe Pyrogen Testing Industry Revenue Share (%), by Country 2024 & 2032
- Figure 10: Europe Pyrogen Testing Industry Volume Share (%), by Country 2024 & 2032
- Figure 11: Asia Pacific Pyrogen Testing Industry Revenue (Million), by Country 2024 & 2032
- Figure 12: Asia Pacific Pyrogen Testing Industry Volume (K Unit), by Country 2024 & 2032
- Figure 13: Asia Pacific Pyrogen Testing Industry Revenue Share (%), by Country 2024 & 2032
- Figure 14: Asia Pacific Pyrogen Testing Industry Volume Share (%), by Country 2024 & 2032
- Figure 15: Middle East and Africa Pyrogen Testing Industry Revenue (Million), by Country 2024 & 2032
- Figure 16: Middle East and Africa Pyrogen Testing Industry Volume (K Unit), by Country 2024 & 2032
- Figure 17: Middle East and Africa Pyrogen Testing Industry Revenue Share (%), by Country 2024 & 2032
- Figure 18: Middle East and Africa Pyrogen Testing Industry Volume Share (%), by Country 2024 & 2032
- Figure 19: South America Pyrogen Testing Industry Revenue (Million), by Country 2024 & 2032
- Figure 20: South America Pyrogen Testing Industry Volume (K Unit), by Country 2024 & 2032
- Figure 21: South America Pyrogen Testing Industry Revenue Share (%), by Country 2024 & 2032
- Figure 22: South America Pyrogen Testing Industry Volume Share (%), by Country 2024 & 2032
- Figure 23: North America Pyrogen Testing Industry Revenue (Million), by Product 2024 & 2032
- Figure 24: North America Pyrogen Testing Industry Volume (K Unit), by Product 2024 & 2032
- Figure 25: North America Pyrogen Testing Industry Revenue Share (%), by Product 2024 & 2032
- Figure 26: North America Pyrogen Testing Industry Volume Share (%), by Product 2024 & 2032
- Figure 27: North America Pyrogen Testing Industry Revenue (Million), by Test Type 2024 & 2032
- Figure 28: North America Pyrogen Testing Industry Volume (K Unit), by Test Type 2024 & 2032
- Figure 29: North America Pyrogen Testing Industry Revenue Share (%), by Test Type 2024 & 2032
- Figure 30: North America Pyrogen Testing Industry Volume Share (%), by Test Type 2024 & 2032
- Figure 31: North America Pyrogen Testing Industry Revenue (Million), by End User 2024 & 2032
- Figure 32: North America Pyrogen Testing Industry Volume (K Unit), by End User 2024 & 2032
- Figure 33: North America Pyrogen Testing Industry Revenue Share (%), by End User 2024 & 2032
- Figure 34: North America Pyrogen Testing Industry Volume Share (%), by End User 2024 & 2032
- Figure 35: North America Pyrogen Testing Industry Revenue (Million), by Country 2024 & 2032
- Figure 36: North America Pyrogen Testing Industry Volume (K Unit), by Country 2024 & 2032
- Figure 37: North America Pyrogen Testing Industry Revenue Share (%), by Country 2024 & 2032
- Figure 38: North America Pyrogen Testing Industry Volume Share (%), by Country 2024 & 2032
- Figure 39: Europe Pyrogen Testing Industry Revenue (Million), by Product 2024 & 2032
- Figure 40: Europe Pyrogen Testing Industry Volume (K Unit), by Product 2024 & 2032
- Figure 41: Europe Pyrogen Testing Industry Revenue Share (%), by Product 2024 & 2032
- Figure 42: Europe Pyrogen Testing Industry Volume Share (%), by Product 2024 & 2032
- Figure 43: Europe Pyrogen Testing Industry Revenue (Million), by Test Type 2024 & 2032
- Figure 44: Europe Pyrogen Testing Industry Volume (K Unit), by Test Type 2024 & 2032
- Figure 45: Europe Pyrogen Testing Industry Revenue Share (%), by Test Type 2024 & 2032
- Figure 46: Europe Pyrogen Testing Industry Volume Share (%), by Test Type 2024 & 2032
- Figure 47: Europe Pyrogen Testing Industry Revenue (Million), by End User 2024 & 2032
- Figure 48: Europe Pyrogen Testing Industry Volume (K Unit), by End User 2024 & 2032
- Figure 49: Europe Pyrogen Testing Industry Revenue Share (%), by End User 2024 & 2032
- Figure 50: Europe Pyrogen Testing Industry Volume Share (%), by End User 2024 & 2032
- Figure 51: Europe Pyrogen Testing Industry Revenue (Million), by Country 2024 & 2032
- Figure 52: Europe Pyrogen Testing Industry Volume (K Unit), by Country 2024 & 2032
- Figure 53: Europe Pyrogen Testing Industry Revenue Share (%), by Country 2024 & 2032
- Figure 54: Europe Pyrogen Testing Industry Volume Share (%), by Country 2024 & 2032
- Figure 55: Asia Pacific Pyrogen Testing Industry Revenue (Million), by Product 2024 & 2032
- Figure 56: Asia Pacific Pyrogen Testing Industry Volume (K Unit), by Product 2024 & 2032
- Figure 57: Asia Pacific Pyrogen Testing Industry Revenue Share (%), by Product 2024 & 2032
- Figure 58: Asia Pacific Pyrogen Testing Industry Volume Share (%), by Product 2024 & 2032
- Figure 59: Asia Pacific Pyrogen Testing Industry Revenue (Million), by Test Type 2024 & 2032
- Figure 60: Asia Pacific Pyrogen Testing Industry Volume (K Unit), by Test Type 2024 & 2032
- Figure 61: Asia Pacific Pyrogen Testing Industry Revenue Share (%), by Test Type 2024 & 2032
- Figure 62: Asia Pacific Pyrogen Testing Industry Volume Share (%), by Test Type 2024 & 2032
- Figure 63: Asia Pacific Pyrogen Testing Industry Revenue (Million), by End User 2024 & 2032
- Figure 64: Asia Pacific Pyrogen Testing Industry Volume (K Unit), by End User 2024 & 2032
- Figure 65: Asia Pacific Pyrogen Testing Industry Revenue Share (%), by End User 2024 & 2032
- Figure 66: Asia Pacific Pyrogen Testing Industry Volume Share (%), by End User 2024 & 2032
- Figure 67: Asia Pacific Pyrogen Testing Industry Revenue (Million), by Country 2024 & 2032
- Figure 68: Asia Pacific Pyrogen Testing Industry Volume (K Unit), by Country 2024 & 2032
- Figure 69: Asia Pacific Pyrogen Testing Industry Revenue Share (%), by Country 2024 & 2032
- Figure 70: Asia Pacific Pyrogen Testing Industry Volume Share (%), by Country 2024 & 2032
- Figure 71: Middle East and Africa Pyrogen Testing Industry Revenue (Million), by Product 2024 & 2032
- Figure 72: Middle East and Africa Pyrogen Testing Industry Volume (K Unit), by Product 2024 & 2032
- Figure 73: Middle East and Africa Pyrogen Testing Industry Revenue Share (%), by Product 2024 & 2032
- Figure 74: Middle East and Africa Pyrogen Testing Industry Volume Share (%), by Product 2024 & 2032
- Figure 75: Middle East and Africa Pyrogen Testing Industry Revenue (Million), by Test Type 2024 & 2032
- Figure 76: Middle East and Africa Pyrogen Testing Industry Volume (K Unit), by Test Type 2024 & 2032
- Figure 77: Middle East and Africa Pyrogen Testing Industry Revenue Share (%), by Test Type 2024 & 2032
- Figure 78: Middle East and Africa Pyrogen Testing Industry Volume Share (%), by Test Type 2024 & 2032
- Figure 79: Middle East and Africa Pyrogen Testing Industry Revenue (Million), by End User 2024 & 2032
- Figure 80: Middle East and Africa Pyrogen Testing Industry Volume (K Unit), by End User 2024 & 2032
- Figure 81: Middle East and Africa Pyrogen Testing Industry Revenue Share (%), by End User 2024 & 2032
- Figure 82: Middle East and Africa Pyrogen Testing Industry Volume Share (%), by End User 2024 & 2032
- Figure 83: Middle East and Africa Pyrogen Testing Industry Revenue (Million), by Country 2024 & 2032
- Figure 84: Middle East and Africa Pyrogen Testing Industry Volume (K Unit), by Country 2024 & 2032
- Figure 85: Middle East and Africa Pyrogen Testing Industry Revenue Share (%), by Country 2024 & 2032
- Figure 86: Middle East and Africa Pyrogen Testing Industry Volume Share (%), by Country 2024 & 2032
- Figure 87: South America Pyrogen Testing Industry Revenue (Million), by Product 2024 & 2032
- Figure 88: South America Pyrogen Testing Industry Volume (K Unit), by Product 2024 & 2032
- Figure 89: South America Pyrogen Testing Industry Revenue Share (%), by Product 2024 & 2032
- Figure 90: South America Pyrogen Testing Industry Volume Share (%), by Product 2024 & 2032
- Figure 91: South America Pyrogen Testing Industry Revenue (Million), by Test Type 2024 & 2032
- Figure 92: South America Pyrogen Testing Industry Volume (K Unit), by Test Type 2024 & 2032
- Figure 93: South America Pyrogen Testing Industry Revenue Share (%), by Test Type 2024 & 2032
- Figure 94: South America Pyrogen Testing Industry Volume Share (%), by Test Type 2024 & 2032
- Figure 95: South America Pyrogen Testing Industry Revenue (Million), by End User 2024 & 2032
- Figure 96: South America Pyrogen Testing Industry Volume (K Unit), by End User 2024 & 2032
- Figure 97: South America Pyrogen Testing Industry Revenue Share (%), by End User 2024 & 2032
- Figure 98: South America Pyrogen Testing Industry Volume Share (%), by End User 2024 & 2032
- Figure 99: South America Pyrogen Testing Industry Revenue (Million), by Country 2024 & 2032
- Figure 100: South America Pyrogen Testing Industry Volume (K Unit), by Country 2024 & 2032
- Figure 101: South America Pyrogen Testing Industry Revenue Share (%), by Country 2024 & 2032
- Figure 102: South America Pyrogen Testing Industry Volume Share (%), by Country 2024 & 2032
List of Tables
- Table 1: Global Pyrogen Testing Industry Revenue Million Forecast, by Region 2019 & 2032
- Table 2: Global Pyrogen Testing Industry Volume K Unit Forecast, by Region 2019 & 2032
- Table 3: Global Pyrogen Testing Industry Revenue Million Forecast, by Product 2019 & 2032
- Table 4: Global Pyrogen Testing Industry Volume K Unit Forecast, by Product 2019 & 2032
- Table 5: Global Pyrogen Testing Industry Revenue Million Forecast, by Test Type 2019 & 2032
- Table 6: Global Pyrogen Testing Industry Volume K Unit Forecast, by Test Type 2019 & 2032
- Table 7: Global Pyrogen Testing Industry Revenue Million Forecast, by End User 2019 & 2032
- Table 8: Global Pyrogen Testing Industry Volume K Unit Forecast, by End User 2019 & 2032
- Table 9: Global Pyrogen Testing Industry Revenue Million Forecast, by Region 2019 & 2032
- Table 10: Global Pyrogen Testing Industry Volume K Unit Forecast, by Region 2019 & 2032
- Table 11: Global Pyrogen Testing Industry Revenue Million Forecast, by Country 2019 & 2032
- Table 12: Global Pyrogen Testing Industry Volume K Unit Forecast, by Country 2019 & 2032
- Table 13: Global Pyrogen Testing Industry Revenue Million Forecast, by Country 2019 & 2032
- Table 14: Global Pyrogen Testing Industry Volume K Unit Forecast, by Country 2019 & 2032
- Table 15: Global Pyrogen Testing Industry Revenue Million Forecast, by Country 2019 & 2032
- Table 16: Global Pyrogen Testing Industry Volume K Unit Forecast, by Country 2019 & 2032
- Table 17: Global Pyrogen Testing Industry Revenue Million Forecast, by Country 2019 & 2032
- Table 18: Global Pyrogen Testing Industry Volume K Unit Forecast, by Country 2019 & 2032
- Table 19: Global Pyrogen Testing Industry Revenue Million Forecast, by Country 2019 & 2032
- Table 20: Global Pyrogen Testing Industry Volume K Unit Forecast, by Country 2019 & 2032
- Table 21: Global Pyrogen Testing Industry Revenue Million Forecast, by Product 2019 & 2032
- Table 22: Global Pyrogen Testing Industry Volume K Unit Forecast, by Product 2019 & 2032
- Table 23: Global Pyrogen Testing Industry Revenue Million Forecast, by Test Type 2019 & 2032
- Table 24: Global Pyrogen Testing Industry Volume K Unit Forecast, by Test Type 2019 & 2032
- Table 25: Global Pyrogen Testing Industry Revenue Million Forecast, by End User 2019 & 2032
- Table 26: Global Pyrogen Testing Industry Volume K Unit Forecast, by End User 2019 & 2032
- Table 27: Global Pyrogen Testing Industry Revenue Million Forecast, by Country 2019 & 2032
- Table 28: Global Pyrogen Testing Industry Volume K Unit Forecast, by Country 2019 & 2032
- Table 29: United States Pyrogen Testing Industry Revenue (Million) Forecast, by Application 2019 & 2032
- Table 30: United States Pyrogen Testing Industry Volume (K Unit) Forecast, by Application 2019 & 2032
- Table 31: Canada Pyrogen Testing Industry Revenue (Million) Forecast, by Application 2019 & 2032
- Table 32: Canada Pyrogen Testing Industry Volume (K Unit) Forecast, by Application 2019 & 2032
- Table 33: Mexico Pyrogen Testing Industry Revenue (Million) Forecast, by Application 2019 & 2032
- Table 34: Mexico Pyrogen Testing Industry Volume (K Unit) Forecast, by Application 2019 & 2032
- Table 35: Global Pyrogen Testing Industry Revenue Million Forecast, by Product 2019 & 2032
- Table 36: Global Pyrogen Testing Industry Volume K Unit Forecast, by Product 2019 & 2032
- Table 37: Global Pyrogen Testing Industry Revenue Million Forecast, by Test Type 2019 & 2032
- Table 38: Global Pyrogen Testing Industry Volume K Unit Forecast, by Test Type 2019 & 2032
- Table 39: Global Pyrogen Testing Industry Revenue Million Forecast, by End User 2019 & 2032
- Table 40: Global Pyrogen Testing Industry Volume K Unit Forecast, by End User 2019 & 2032
- Table 41: Global Pyrogen Testing Industry Revenue Million Forecast, by Country 2019 & 2032
- Table 42: Global Pyrogen Testing Industry Volume K Unit Forecast, by Country 2019 & 2032
- Table 43: Germany Pyrogen Testing Industry Revenue (Million) Forecast, by Application 2019 & 2032
- Table 44: Germany Pyrogen Testing Industry Volume (K Unit) Forecast, by Application 2019 & 2032
- Table 45: United Kingdom Pyrogen Testing Industry Revenue (Million) Forecast, by Application 2019 & 2032
- Table 46: United Kingdom Pyrogen Testing Industry Volume (K Unit) Forecast, by Application 2019 & 2032
- Table 47: France Pyrogen Testing Industry Revenue (Million) Forecast, by Application 2019 & 2032
- Table 48: France Pyrogen Testing Industry Volume (K Unit) Forecast, by Application 2019 & 2032
- Table 49: Italy Pyrogen Testing Industry Revenue (Million) Forecast, by Application 2019 & 2032
- Table 50: Italy Pyrogen Testing Industry Volume (K Unit) Forecast, by Application 2019 & 2032
- Table 51: Spain Pyrogen Testing Industry Revenue (Million) Forecast, by Application 2019 & 2032
- Table 52: Spain Pyrogen Testing Industry Volume (K Unit) Forecast, by Application 2019 & 2032
- Table 53: Rest of Europe Pyrogen Testing Industry Revenue (Million) Forecast, by Application 2019 & 2032
- Table 54: Rest of Europe Pyrogen Testing Industry Volume (K Unit) Forecast, by Application 2019 & 2032
- Table 55: Global Pyrogen Testing Industry Revenue Million Forecast, by Product 2019 & 2032
- Table 56: Global Pyrogen Testing Industry Volume K Unit Forecast, by Product 2019 & 2032
- Table 57: Global Pyrogen Testing Industry Revenue Million Forecast, by Test Type 2019 & 2032
- Table 58: Global Pyrogen Testing Industry Volume K Unit Forecast, by Test Type 2019 & 2032
- Table 59: Global Pyrogen Testing Industry Revenue Million Forecast, by End User 2019 & 2032
- Table 60: Global Pyrogen Testing Industry Volume K Unit Forecast, by End User 2019 & 2032
- Table 61: Global Pyrogen Testing Industry Revenue Million Forecast, by Country 2019 & 2032
- Table 62: Global Pyrogen Testing Industry Volume K Unit Forecast, by Country 2019 & 2032
- Table 63: China Pyrogen Testing Industry Revenue (Million) Forecast, by Application 2019 & 2032
- Table 64: China Pyrogen Testing Industry Volume (K Unit) Forecast, by Application 2019 & 2032
- Table 65: Japan Pyrogen Testing Industry Revenue (Million) Forecast, by Application 2019 & 2032
- Table 66: Japan Pyrogen Testing Industry Volume (K Unit) Forecast, by Application 2019 & 2032
- Table 67: India Pyrogen Testing Industry Revenue (Million) Forecast, by Application 2019 & 2032
- Table 68: India Pyrogen Testing Industry Volume (K Unit) Forecast, by Application 2019 & 2032
- Table 69: Australia Pyrogen Testing Industry Revenue (Million) Forecast, by Application 2019 & 2032
- Table 70: Australia Pyrogen Testing Industry Volume (K Unit) Forecast, by Application 2019 & 2032
- Table 71: South Korea Pyrogen Testing Industry Revenue (Million) Forecast, by Application 2019 & 2032
- Table 72: South Korea Pyrogen Testing Industry Volume (K Unit) Forecast, by Application 2019 & 2032
- Table 73: Rest of Asia Pacific Pyrogen Testing Industry Revenue (Million) Forecast, by Application 2019 & 2032
- Table 74: Rest of Asia Pacific Pyrogen Testing Industry Volume (K Unit) Forecast, by Application 2019 & 2032
- Table 75: Global Pyrogen Testing Industry Revenue Million Forecast, by Product 2019 & 2032
- Table 76: Global Pyrogen Testing Industry Volume K Unit Forecast, by Product 2019 & 2032
- Table 77: Global Pyrogen Testing Industry Revenue Million Forecast, by Test Type 2019 & 2032
- Table 78: Global Pyrogen Testing Industry Volume K Unit Forecast, by Test Type 2019 & 2032
- Table 79: Global Pyrogen Testing Industry Revenue Million Forecast, by End User 2019 & 2032
- Table 80: Global Pyrogen Testing Industry Volume K Unit Forecast, by End User 2019 & 2032
- Table 81: Global Pyrogen Testing Industry Revenue Million Forecast, by Country 2019 & 2032
- Table 82: Global Pyrogen Testing Industry Volume K Unit Forecast, by Country 2019 & 2032
- Table 83: GCC Pyrogen Testing Industry Revenue (Million) Forecast, by Application 2019 & 2032
- Table 84: GCC Pyrogen Testing Industry Volume (K Unit) Forecast, by Application 2019 & 2032
- Table 85: South Africa Pyrogen Testing Industry Revenue (Million) Forecast, by Application 2019 & 2032
- Table 86: South Africa Pyrogen Testing Industry Volume (K Unit) Forecast, by Application 2019 & 2032
- Table 87: Rest of Middle East and Africa Pyrogen Testing Industry Revenue (Million) Forecast, by Application 2019 & 2032
- Table 88: Rest of Middle East and Africa Pyrogen Testing Industry Volume (K Unit) Forecast, by Application 2019 & 2032
- Table 89: Global Pyrogen Testing Industry Revenue Million Forecast, by Product 2019 & 2032
- Table 90: Global Pyrogen Testing Industry Volume K Unit Forecast, by Product 2019 & 2032
- Table 91: Global Pyrogen Testing Industry Revenue Million Forecast, by Test Type 2019 & 2032
- Table 92: Global Pyrogen Testing Industry Volume K Unit Forecast, by Test Type 2019 & 2032
- Table 93: Global Pyrogen Testing Industry Revenue Million Forecast, by End User 2019 & 2032
- Table 94: Global Pyrogen Testing Industry Volume K Unit Forecast, by End User 2019 & 2032
- Table 95: Global Pyrogen Testing Industry Revenue Million Forecast, by Country 2019 & 2032
- Table 96: Global Pyrogen Testing Industry Volume K Unit Forecast, by Country 2019 & 2032
- Table 97: Brazil Pyrogen Testing Industry Revenue (Million) Forecast, by Application 2019 & 2032
- Table 98: Brazil Pyrogen Testing Industry Volume (K Unit) Forecast, by Application 2019 & 2032
- Table 99: Argentina Pyrogen Testing Industry Revenue (Million) Forecast, by Application 2019 & 2032
- Table 100: Argentina Pyrogen Testing Industry Volume (K Unit) Forecast, by Application 2019 & 2032
- Table 101: Rest of South America Pyrogen Testing Industry Revenue (Million) Forecast, by Application 2019 & 2032
- Table 102: Rest of South America Pyrogen Testing Industry Volume (K Unit) Forecast, by Application 2019 & 2032
Frequently Asked Questions
1. What is the projected Compound Annual Growth Rate (CAGR) of the Pyrogen Testing Industry?
The projected CAGR is approximately 7.13%.
2. Which companies are prominent players in the Pyrogen Testing Industry?
Key companies in the market include Microcoat Biotechnologie GmbH, BioMerieux SA, Merck Kgaa, Lonza Group, Sotera Health (Nelson Laboratories LLC), Fujifilm Holdings Corporation (FUJIFILM Wako Pure Chemical Corporation), Eurofins Scientific, Thermo Fisher Scientific Inc, WUXI Pharmatech (Cayman) Inc, Genscript, Associates of Cape Cod Inc (Seikagaku Biobusiness Corporation), Microcoat Biotechnologie GmbH, Charles River Laboratories Inc, Sanquin, Pyrostar, Ellab AS.
3. What are the main segments of the Pyrogen Testing Industry?
The market segments include Product, Test Type, End User.
4. Can you provide details about the market size?
The market size is estimated to be USD 1.48 Million as of 2022.
5. What are some drivers contributing to market growth?
Rapid Growth in Pharmaceutical and Biotechnology Industries; Rising R&D Expenditure in Life Science.
6. What are the notable trends driving market growth?
The Monocyte Activation Test Segment is Expected to Witness Good Growth Over the Forecast Period.
7. Are there any restraints impacting market growth?
Stringent Government Regulations.
8. Can you provide examples of recent developments in the market?
N/A
9. What pricing options are available for accessing the report?
Pricing options include single-user, multi-user, and enterprise licenses priced at USD 4750, USD 5250, and USD 8750 respectively.
10. Is the market size provided in terms of value or volume?
The market size is provided in terms of value, measured in Million and volume, measured in K Unit.
11. Are there any specific market keywords associated with the report?
Yes, the market keyword associated with the report is "Pyrogen Testing Industry," which aids in identifying and referencing the specific market segment covered.
12. How do I determine which pricing option suits my needs best?
The pricing options vary based on user requirements and access needs. Individual users may opt for single-user licenses, while businesses requiring broader access may choose multi-user or enterprise licenses for cost-effective access to the report.
13. Are there any additional resources or data provided in the Pyrogen Testing Industry report?
While the report offers comprehensive insights, it's advisable to review the specific contents or supplementary materials provided to ascertain if additional resources or data are available.
14. How can I stay updated on further developments or reports in the Pyrogen Testing Industry?
To stay informed about further developments, trends, and reports in the Pyrogen Testing Industry, consider subscribing to industry newsletters, following relevant companies and organizations, or regularly checking reputable industry news sources and publications.
Methodology
Step 1 - Identification of Relevant Samples Size from Population Database


Step 2 - Approaches for Defining Global Market Size (Value, Volume* & Price*)

Note*: In applicable scenarios
Step 3 - Data Sources
Primary Research
- Web Analytics
- Survey Reports
- Research Institute
- Latest Research Reports
- Opinion Leaders
Secondary Research
- Annual Reports
- White Paper
- Latest Press Release
- Industry Association
- Paid Database
- Investor Presentations

Step 4 - Data Triangulation
Involves using different sources of information in order to increase the validity of a study
These sources are likely to be stakeholders in a program - participants, other researchers, program staff, other community members, and so on.
Then we put all data in single framework & apply various statistical tools to find out the dynamic on the market.
During the analysis stage, feedback from the stakeholder groups would be compared to determine areas of agreement as well as areas of divergence
