

Key Insights
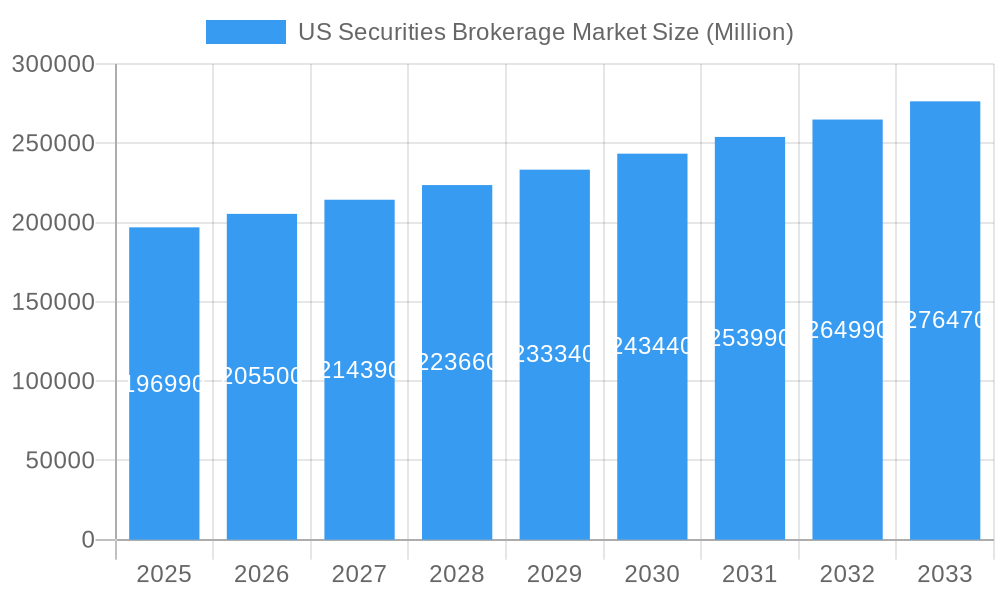
The US Securities Brokerage Market, valued at $196.99 billion in 2025, is projected to experience robust growth, exhibiting a Compound Annual Growth Rate (CAGR) of 4.23% from 2025 to 2033. This expansion is fueled by several key factors. The increasing adoption of online trading platforms, driven by technological advancements and the rise of mobile-first investing, significantly contributes to market growth. Furthermore, a growing millennial and Gen Z investor base, increasingly comfortable with digital financial services, is driving demand. Regulatory changes promoting investor education and accessibility are also positively impacting market expansion. Competitive pressures from established players like Fidelity, Charles Schwab, and E-Trade, alongside the emergence of innovative fintech companies such as Robinhood and Webull, are shaping the market landscape. These newcomers are attracting investors with user-friendly interfaces, commission-free trading, and fractional share offerings. However, challenges remain, including concerns about market volatility, cybersecurity threats, and the need for robust investor protection measures. The market's future growth will depend on navigating these challenges while capitalizing on emerging opportunities like the expanding use of artificial intelligence in investment advice and algorithmic trading.
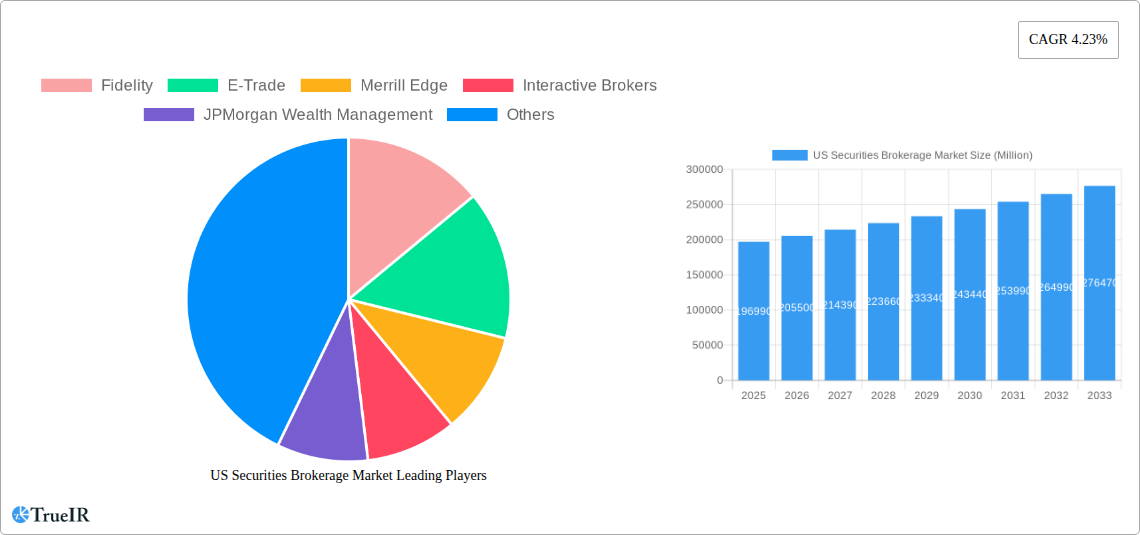
US Securities Brokerage Market Market Size (In Billion)
The market segmentation, while not explicitly provided, likely includes distinct categories based on service offerings (e.g., full-service brokerage, discount brokerage, robo-advisors), client demographics (e.g., high-net-worth individuals, retail investors), and product types (e.g., stocks, bonds, mutual funds, options). Regional variations within the US market also play a crucial role. Concentrations of financial hubs and varying levels of financial literacy across different states may influence regional growth rates. Continued technological innovation, evolving investor preferences, and the regulatory environment will collectively shape the future trajectory of the US Securities Brokerage Market. Maintaining client trust and ensuring data security will remain critical success factors for market participants.
US Securities Brokerage Market Company Market Share
US Securities Brokerage Market Report: 2019-2033
This comprehensive report provides a detailed analysis of the US Securities Brokerage Market, covering its structure, competitive landscape, trends, opportunities, and future outlook. The study period spans from 2019 to 2033, with 2025 serving as the base and estimated year. The report leverages extensive data analysis and expert insights to offer valuable information for investors, market participants, and industry professionals. The market size is projected to reach xx Million by 2033, exhibiting a CAGR of xx% during the forecast period (2025-2033).
US Securities Brokerage Market Market Structure & Competitive Landscape
The US securities brokerage market is a vibrant and evolving ecosystem, shaped by the strategic maneuvers of established financial institutions and the agile innovation of emerging fintech disruptors. While a few leading players command a substantial market share, leading to moderate concentration, the landscape is far from monolithic. A robust cohort of smaller firms actively competes, contributing to a dynamic market environment. For 2024, the Herfindahl-Hirschman Index (HHI) was estimated at [Insert HHI Value Here], underscoring this moderately concentrated structure. Key catalysts for change include the widespread adoption of sophisticated AI-powered trading tools, the proliferation of intuitive mobile-first platforms, and the growing accessibility of fractional share trading, democratizing investment opportunities. The regulatory framework, spearheaded by bodies like the SEC, exerts a significant influence, dictating operational practices and compliance mandates. Traditional brokerage models face continuous evolution due to the increasing prominence of product substitutes such as sophisticated robo-advisors and other automated investment platforms. The market effectively serves a diverse range of end-users, encompassing retail investors, large institutional entities, high-net-worth individuals, and professional financial advisors. Mergers and acquisitions (M&A) remain a pivotal aspect of industry strategy, with approximately [Insert M&A Value Here] billion in transactions recorded in 2024. This activity is strategically motivated by the pursuit of expanded market share, the integration of advanced technological capabilities, and the imperative to tap into new and diverse customer segments. Projections indicate a slight increase in market concentration over the forthcoming forecast period, a trend driven by the ongoing strategic acquisitions undertaken by larger, established firms to consolidate their market positions.
- Market Concentration: Moderate, with a HHI of [Insert HHI Value Here] in 2024, indicating a balanced competitive environment with room for both large and small players.
- Innovation Drivers: The market is actively embracing AI-driven trading solutions, user-friendly mobile trading applications, and the expansion of fractional share offerings to enhance accessibility and engagement.
- Regulatory Impacts: The Securities and Exchange Commission (SEC) and other regulatory bodies play a crucial role in shaping market operations, compliance standards, and investor protection measures.
- Product Substitutes: The competitive landscape is influenced by the growing adoption of robo-advisors and other automated investment management platforms that offer alternative avenues for wealth creation.
- End-User Segmentation: The market caters to a broad spectrum of investors, including individual retail investors, sophisticated institutional investors, affluent high-net-worth individuals, and professional financial advisors.
- M&A Activity: Significant industry consolidation and strategic growth are evident, with approximately [Insert M&A Value Here] billion in M&A transactions recorded in 2024.
US Securities Brokerage Market Market Trends & Opportunities
The US securities brokerage market is undergoing a profound transformation, propelled by rapid technological advancements, shifting consumer expectations, and an increasingly competitive operational environment. The market size has demonstrated substantial growth in recent years, reaching an estimated [Insert Market Size Value Here] Million in 2024. Future growth is projected to remain robust, largely fueled by a surge in retail investor participation, particularly among younger demographics who are embracing digital investment tools. Significant technological shifts, such as the ascendancy of intuitive mobile trading applications and the increasing sophistication of algorithmic trading strategies, have effectively lowered entry barriers and broadened market accessibility for a wider range of investors. Consumer preferences are demonstrably leaning towards commission-free trading models, highly personalized investment solutions, and seamless, integrated digital user experiences. The growing adoption of robo-advisors and the strategic integration of artificial intelligence are fundamentally reshaping the competitive contours of the market. The market penetration rate for online brokerage accounts is estimated at [Insert Penetration Rate Value Here]%, a clear indicator of the widespread embrace of digital platforms for investment activities. Competitive dynamics are characterized by intense price competition, a relentless pursuit of technological innovation, and the persistent emergence of disruptive fintech companies challenging established norms.
Dominant Markets & Segments in US Securities Brokerage Market
The US securities brokerage market is predominantly concentrated in urban and suburban areas, reflecting higher levels of financial literacy and wealth concentration. Growth is driven by several factors: robust economic growth, expanding financial inclusion, increasing investment literacy, and technological advancements.
- Key Growth Drivers:
- Increasing retail investor participation.
- Technological advancements (mobile trading apps).
- Growing adoption of robo-advisors.
- Expansion of financial literacy initiatives.
- Market Dominance Analysis: The market exhibits a moderate level of concentration, with several key players controlling a significant portion of the market share. However, the increasing adoption of digital platforms and the rise of fintech companies have created a competitive landscape that provides opportunities for smaller players to emerge.
US Securities Brokerage Market Product Analysis
The US securities brokerage market offers a diverse range of products and services, catering to various investor needs and preferences. Traditional brokerage services are being augmented by advanced trading platforms, sophisticated research tools, and personalized investment advisory solutions. Technological advancements, such as AI-powered portfolio management tools and algorithmic trading strategies, are driving product innovation and enhancing the overall user experience. The market fit for these newer offerings is high, as investors increasingly seek advanced tools and personalized guidance.
Key Drivers, Barriers & Challenges in US Securities Brokerage Market
Key Drivers:
The expansion of the US securities brokerage market is primarily propelled by a confluence of factors including rapid technological advancements, such as the integration of Artificial Intelligence (AI) and the ubiquity of mobile trading platforms. A notable increase in retail investor participation, especially among younger demographics, further fuels growth. Favorable regulatory changes that promote financial inclusion and broader economic growth also play a significant role. The widespread adoption of commission-free trading models has been a pivotal catalyst, drastically improving market accessibility for a wider segment of the population.
Challenges:
Despite the positive growth trajectory, the market faces considerable hurdles. Navigating complex and evolving regulatory landscapes, coupled with the substantial costs associated with maintaining compliance, presents a significant challenge. Intensified competition, characterized by aggressive price wars and the continuous need for technological innovation, exerts pressure on profit margins. Furthermore, the ever-present threat of sophisticated cybersecurity breaches demands constant vigilance and investment in robust security infrastructure. Maintaining profitability in an environment where commissions are increasingly minimized, often to zero, necessitates innovative business models and a strong focus on value-added services.
Growth Drivers in the US Securities Brokerage Market Market
Technological advancements (AI, mobile trading apps), increasing retail investor participation, and government initiatives to promote financial inclusion are major growth drivers. The expansion of the middle class and higher levels of disposable income are also contributing factors.
Challenges Impacting US Securities Brokerage Market Growth
Sustained growth within the US securities brokerage market is significantly influenced by several critical factors. Intense competition among a growing number of service providers necessitates continuous innovation and cost management. Navigating a complex and ever-evolving regulatory environment, which often involves significant compliance costs, remains a primary concern. The persistent threat of cybersecurity risks requires substantial investment in protective measures. Furthermore, the industry must adeptly respond to the evolving preferences of investors, who increasingly demand personalized services and digital-first experiences, creating a dynamic challenge for traditional brokerage models.
Key Players Shaping the US Securities Brokerage Market Market
Significant US Securities Brokerage Market Industry Milestones
- February 2023: Fidelity Investments launched the Fidelity Municipal Core Plus Bond Fund (FMBAX), expanding its fixed-income offerings.
- February 2023: Robinhood announced plans to buy back Sam Bankman-Fried's 7% stake.
Future Outlook for US Securities Brokerage Market Market
The US securities brokerage market is poised for continued growth, driven by technological innovation, evolving investor preferences, and increasing market accessibility. Strategic opportunities lie in personalized investment solutions, leveraging AI and machine learning, and expanding into underserved market segments. The market's potential remains significant, with further growth anticipated in the coming years.
US Securities Brokerage Market Segmentation
-
1. Type
- 1.1. Derivatives & Commodities Brokerage
- 1.2. Stock Exchanges
- 1.3. Bonds Brokerage
- 1.4. Equities Brokerage
- 1.5. Other Types
-
2. Mode
- 2.1. Online
- 2.2. Offline
-
3. Type of Establishment
- 3.1. Exclusive Brokers
- 3.2. Banks
- 3.3. Investment Firms
- 3.4. Other Types of Establishments
US Securities Brokerage Market Segmentation By Geography
-
1. North America
- 1.1. United States
- 1.2. Canada
- 1.3. Mexico
-
2. South America
- 2.1. Brazil
- 2.2. Argentina
- 2.3. Rest of South America
-
3. Europe
- 3.1. United Kingdom
- 3.2. Germany
- 3.3. France
- 3.4. Italy
- 3.5. Spain
- 3.6. Russia
- 3.7. Benelux
- 3.8. Nordics
- 3.9. Rest of Europe
-
4. Middle East & Africa
- 4.1. Turkey
- 4.2. Israel
- 4.3. GCC
- 4.4. North Africa
- 4.5. South Africa
- 4.6. Rest of Middle East & Africa
-
5. Asia Pacific
- 5.1. China
- 5.2. India
- 5.3. Japan
- 5.4. South Korea
- 5.5. ASEAN
- 5.6. Oceania
- 5.7. Rest of Asia Pacific
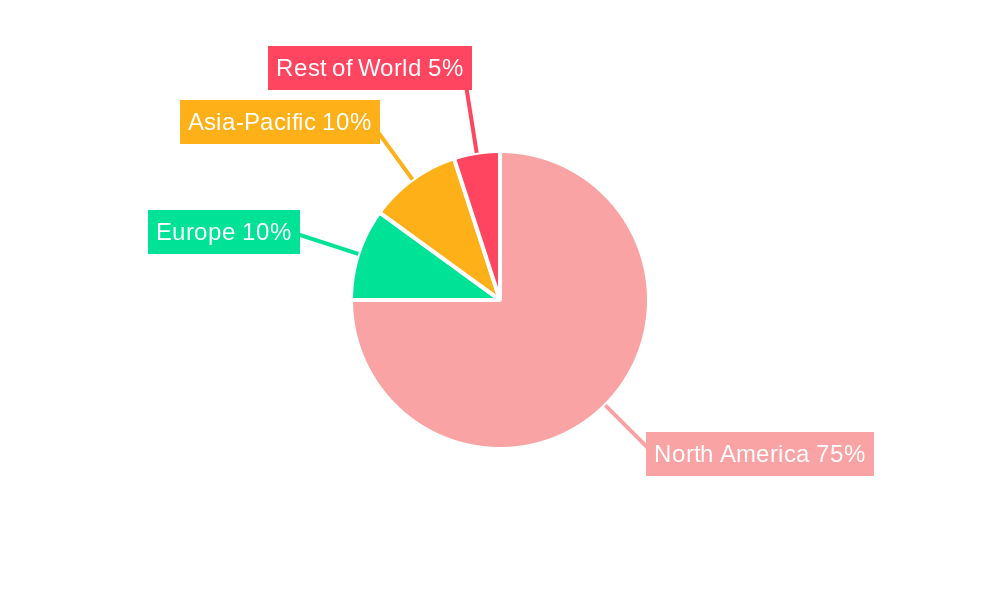
US Securities Brokerage Market Regional Market Share
Geographic Coverage of US Securities Brokerage Market
US Securities Brokerage Market REPORT HIGHLIGHTS
| Aspects | Details |
|---|---|
| Study Period | 2020-2034 |
| Base Year | 2025 |
| Estimated Year | 2026 |
| Forecast Period | 2026-2034 |
| Historical Period | 2020-2025 |
| Growth Rate | CAGR of 4.23% from 2020-2034 |
| Segmentation |
|
Table of Contents
- 1. Introduction
- 1.1. Research Scope
- 1.2. Market Segmentation
- 1.3. Research Objective
- 1.4. Definitions and Assumptions
- 2. Executive Summary
- 2.1. Market Snapshot
- 3. Market Dynamics
- 3.1. Market Drivers
- 3.2. Market Restrains
- 3.3. Market Trends
- 3.4. Market Opportunities
- 4. Market Factor Analysis
- 4.1. Porters Five Forces
- 4.1.1. Bargaining Power of Suppliers
- 4.1.2. Bargaining Power of Buyers
- 4.1.3. Threat of New Entrants
- 4.1.4. Threat of Substitutes
- 4.1.5. Competitive Rivalry
- 4.2. PESTEL analysis
- 4.3. BCG Analysis
- 4.3.1. Stars (High Growth, High Market Share)
- 4.3.2. Cash Cows (Low Growth, High Market Share)
- 4.3.3. Question Mark (High Growth, Low Market Share)
- 4.3.4. Dogs (Low Growth, Low Market Share)
- 4.4. Ansoff Matrix Analysis
- 4.5. Supply Chain Analysis
- 4.6. Regulatory Landscape
- 4.7. Current Market Potential and Opportunity Assessment (TAM–SAM–SOM Framework)
- 4.8. TIR Analyst Note
- 4.1. Porters Five Forces
- 5. Market Analysis, Insights and Forecast 2021-2033
- 5.1. Market Analysis, Insights and Forecast - by Type
- 5.1.1. Derivatives & Commodities Brokerage
- 5.1.2. Stock Exchanges
- 5.1.3. Bonds Brokerage
- 5.1.4. Equities Brokerage
- 5.1.5. Other Types
- 5.2. Market Analysis, Insights and Forecast - by Mode
- 5.2.1. Online
- 5.2.2. Offline
- 5.3. Market Analysis, Insights and Forecast - by Type of Establishment
- 5.3.1. Exclusive Brokers
- 5.3.2. Banks
- 5.3.3. Investment Firms
- 5.3.4. Other Types of Establishments
- 5.4. Market Analysis, Insights and Forecast - by Region
- 5.4.1. North America
- 5.4.2. South America
- 5.4.3. Europe
- 5.4.4. Middle East & Africa
- 5.4.5. Asia Pacific
- 5.1. Market Analysis, Insights and Forecast - by Type
- 6. Global US Securities Brokerage Market Analysis, Insights and Forecast, 2021-2033
- 6.1. Market Analysis, Insights and Forecast - by Type
- 6.1.1. Derivatives & Commodities Brokerage
- 6.1.2. Stock Exchanges
- 6.1.3. Bonds Brokerage
- 6.1.4. Equities Brokerage
- 6.1.5. Other Types
- 6.2. Market Analysis, Insights and Forecast - by Mode
- 6.2.1. Online
- 6.2.2. Offline
- 6.3. Market Analysis, Insights and Forecast - by Type of Establishment
- 6.3.1. Exclusive Brokers
- 6.3.2. Banks
- 6.3.3. Investment Firms
- 6.3.4. Other Types of Establishments
- 6.1. Market Analysis, Insights and Forecast - by Type
- 7. North America US Securities Brokerage Market Analysis, Insights and Forecast, 2020-2032
- 7.1. Market Analysis, Insights and Forecast - by Type
- 7.1.1. Derivatives & Commodities Brokerage
- 7.1.2. Stock Exchanges
- 7.1.3. Bonds Brokerage
- 7.1.4. Equities Brokerage
- 7.1.5. Other Types
- 7.2. Market Analysis, Insights and Forecast - by Mode
- 7.2.1. Online
- 7.2.2. Offline
- 7.3. Market Analysis, Insights and Forecast - by Type of Establishment
- 7.3.1. Exclusive Brokers
- 7.3.2. Banks
- 7.3.3. Investment Firms
- 7.3.4. Other Types of Establishments
- 7.1. Market Analysis, Insights and Forecast - by Type
- 8. South America US Securities Brokerage Market Analysis, Insights and Forecast, 2020-2032
- 8.1. Market Analysis, Insights and Forecast - by Type
- 8.1.1. Derivatives & Commodities Brokerage
- 8.1.2. Stock Exchanges
- 8.1.3. Bonds Brokerage
- 8.1.4. Equities Brokerage
- 8.1.5. Other Types
- 8.2. Market Analysis, Insights and Forecast - by Mode
- 8.2.1. Online
- 8.2.2. Offline
- 8.3. Market Analysis, Insights and Forecast - by Type of Establishment
- 8.3.1. Exclusive Brokers
- 8.3.2. Banks
- 8.3.3. Investment Firms
- 8.3.4. Other Types of Establishments
- 8.1. Market Analysis, Insights and Forecast - by Type
- 9. Europe US Securities Brokerage Market Analysis, Insights and Forecast, 2020-2032
- 9.1. Market Analysis, Insights and Forecast - by Type
- 9.1.1. Derivatives & Commodities Brokerage
- 9.1.2. Stock Exchanges
- 9.1.3. Bonds Brokerage
- 9.1.4. Equities Brokerage
- 9.1.5. Other Types
- 9.2. Market Analysis, Insights and Forecast - by Mode
- 9.2.1. Online
- 9.2.2. Offline
- 9.3. Market Analysis, Insights and Forecast - by Type of Establishment
- 9.3.1. Exclusive Brokers
- 9.3.2. Banks
- 9.3.3. Investment Firms
- 9.3.4. Other Types of Establishments
- 9.1. Market Analysis, Insights and Forecast - by Type
- 10. Middle East & Africa US Securities Brokerage Market Analysis, Insights and Forecast, 2020-2032
- 10.1. Market Analysis, Insights and Forecast - by Type
- 10.1.1. Derivatives & Commodities Brokerage
- 10.1.2. Stock Exchanges
- 10.1.3. Bonds Brokerage
- 10.1.4. Equities Brokerage
- 10.1.5. Other Types
- 10.2. Market Analysis, Insights and Forecast - by Mode
- 10.2.1. Online
- 10.2.2. Offline
- 10.3. Market Analysis, Insights and Forecast - by Type of Establishment
- 10.3.1. Exclusive Brokers
- 10.3.2. Banks
- 10.3.3. Investment Firms
- 10.3.4. Other Types of Establishments
- 10.1. Market Analysis, Insights and Forecast - by Type
- 11. Asia Pacific US Securities Brokerage Market Analysis, Insights and Forecast, 2020-2032
- 11.1. Market Analysis, Insights and Forecast - by Type
- 11.1.1. Derivatives & Commodities Brokerage
- 11.1.2. Stock Exchanges
- 11.1.3. Bonds Brokerage
- 11.1.4. Equities Brokerage
- 11.1.5. Other Types
- 11.2. Market Analysis, Insights and Forecast - by Mode
- 11.2.1. Online
- 11.2.2. Offline
- 11.3. Market Analysis, Insights and Forecast - by Type of Establishment
- 11.3.1. Exclusive Brokers
- 11.3.2. Banks
- 11.3.3. Investment Firms
- 11.3.4. Other Types of Establishments
- 11.1. Market Analysis, Insights and Forecast - by Type
- 12. Competitive Analysis
- 12.1. Company Profiles
- 12.1.1 Fidelity
- 12.1.1.1. Company Overview
- 12.1.1.2. Products
- 12.1.1.3. Company Financials
- 12.1.1.4. SWOT Analysis
- 12.1.2 E-Trade
- 12.1.2.1. Company Overview
- 12.1.2.2. Products
- 12.1.2.3. Company Financials
- 12.1.2.4. SWOT Analysis
- 12.1.3 Merrill Edge
- 12.1.3.1. Company Overview
- 12.1.3.2. Products
- 12.1.3.3. Company Financials
- 12.1.3.4. SWOT Analysis
- 12.1.4 Interactive Brokers
- 12.1.4.1. Company Overview
- 12.1.4.2. Products
- 12.1.4.3. Company Financials
- 12.1.4.4. SWOT Analysis
- 12.1.5 JPMorgan Wealth Management
- 12.1.5.1. Company Overview
- 12.1.5.2. Products
- 12.1.5.3. Company Financials
- 12.1.5.4. SWOT Analysis
- 12.1.6 Webull
- 12.1.6.1. Company Overview
- 12.1.6.2. Products
- 12.1.6.3. Company Financials
- 12.1.6.4. SWOT Analysis
- 12.1.7 Robinhood
- 12.1.7.1. Company Overview
- 12.1.7.2. Products
- 12.1.7.3. Company Financials
- 12.1.7.4. SWOT Analysis
- 12.1.8 Ally Invest
- 12.1.8.1. Company Overview
- 12.1.8.2. Products
- 12.1.8.3. Company Financials
- 12.1.8.4. SWOT Analysis
- 12.1.9 Firstrade
- 12.1.9.1. Company Overview
- 12.1.9.2. Products
- 12.1.9.3. Company Financials
- 12.1.9.4. SWOT Analysis
- 12.1.10 Charles Schwab**List Not Exhaustive
- 12.1.10.1. Company Overview
- 12.1.10.2. Products
- 12.1.10.3. Company Financials
- 12.1.10.4. SWOT Analysis
- 12.1.1 Fidelity
- 12.2. Market Entropy
- 12.2.1 Company's Key Areas Served
- 12.2.2 Recent Developments
- 12.3. Company Market Share Analysis 2025
- 12.3.1 Top 5 Companies Market Share Analysis
- 12.3.2 Top 3 Companies Market Share Analysis
- 12.4. List of Potential Customers
- 13. Research Methodology
List of Figures
- Figure 1: Global US Securities Brokerage Market Revenue Breakdown (Million, %) by Region 2025 & 2033
- Figure 2: Global US Securities Brokerage Market Volume Breakdown (Billion, %) by Region 2025 & 2033
- Figure 3: North America US Securities Brokerage Market Revenue (Million), by Type 2025 & 2033
- Figure 4: North America US Securities Brokerage Market Volume (Billion), by Type 2025 & 2033
- Figure 5: North America US Securities Brokerage Market Revenue Share (%), by Type 2025 & 2033
- Figure 6: North America US Securities Brokerage Market Volume Share (%), by Type 2025 & 2033
- Figure 7: North America US Securities Brokerage Market Revenue (Million), by Mode 2025 & 2033
- Figure 8: North America US Securities Brokerage Market Volume (Billion), by Mode 2025 & 2033
- Figure 9: North America US Securities Brokerage Market Revenue Share (%), by Mode 2025 & 2033
- Figure 10: North America US Securities Brokerage Market Volume Share (%), by Mode 2025 & 2033
- Figure 11: North America US Securities Brokerage Market Revenue (Million), by Type of Establishment 2025 & 2033
- Figure 12: North America US Securities Brokerage Market Volume (Billion), by Type of Establishment 2025 & 2033
- Figure 13: North America US Securities Brokerage Market Revenue Share (%), by Type of Establishment 2025 & 2033
- Figure 14: North America US Securities Brokerage Market Volume Share (%), by Type of Establishment 2025 & 2033
- Figure 15: North America US Securities Brokerage Market Revenue (Million), by Country 2025 & 2033
- Figure 16: North America US Securities Brokerage Market Volume (Billion), by Country 2025 & 2033
- Figure 17: North America US Securities Brokerage Market Revenue Share (%), by Country 2025 & 2033
- Figure 18: North America US Securities Brokerage Market Volume Share (%), by Country 2025 & 2033
- Figure 19: South America US Securities Brokerage Market Revenue (Million), by Type 2025 & 2033
- Figure 20: South America US Securities Brokerage Market Volume (Billion), by Type 2025 & 2033
- Figure 21: South America US Securities Brokerage Market Revenue Share (%), by Type 2025 & 2033
- Figure 22: South America US Securities Brokerage Market Volume Share (%), by Type 2025 & 2033
- Figure 23: South America US Securities Brokerage Market Revenue (Million), by Mode 2025 & 2033
- Figure 24: South America US Securities Brokerage Market Volume (Billion), by Mode 2025 & 2033
- Figure 25: South America US Securities Brokerage Market Revenue Share (%), by Mode 2025 & 2033
- Figure 26: South America US Securities Brokerage Market Volume Share (%), by Mode 2025 & 2033
- Figure 27: South America US Securities Brokerage Market Revenue (Million), by Type of Establishment 2025 & 2033
- Figure 28: South America US Securities Brokerage Market Volume (Billion), by Type of Establishment 2025 & 2033
- Figure 29: South America US Securities Brokerage Market Revenue Share (%), by Type of Establishment 2025 & 2033
- Figure 30: South America US Securities Brokerage Market Volume Share (%), by Type of Establishment 2025 & 2033
- Figure 31: South America US Securities Brokerage Market Revenue (Million), by Country 2025 & 2033
- Figure 32: South America US Securities Brokerage Market Volume (Billion), by Country 2025 & 2033
- Figure 33: South America US Securities Brokerage Market Revenue Share (%), by Country 2025 & 2033
- Figure 34: South America US Securities Brokerage Market Volume Share (%), by Country 2025 & 2033
- Figure 35: Europe US Securities Brokerage Market Revenue (Million), by Type 2025 & 2033
- Figure 36: Europe US Securities Brokerage Market Volume (Billion), by Type 2025 & 2033
- Figure 37: Europe US Securities Brokerage Market Revenue Share (%), by Type 2025 & 2033
- Figure 38: Europe US Securities Brokerage Market Volume Share (%), by Type 2025 & 2033
- Figure 39: Europe US Securities Brokerage Market Revenue (Million), by Mode 2025 & 2033
- Figure 40: Europe US Securities Brokerage Market Volume (Billion), by Mode 2025 & 2033
- Figure 41: Europe US Securities Brokerage Market Revenue Share (%), by Mode 2025 & 2033
- Figure 42: Europe US Securities Brokerage Market Volume Share (%), by Mode 2025 & 2033
- Figure 43: Europe US Securities Brokerage Market Revenue (Million), by Type of Establishment 2025 & 2033
- Figure 44: Europe US Securities Brokerage Market Volume (Billion), by Type of Establishment 2025 & 2033
- Figure 45: Europe US Securities Brokerage Market Revenue Share (%), by Type of Establishment 2025 & 2033
- Figure 46: Europe US Securities Brokerage Market Volume Share (%), by Type of Establishment 2025 & 2033
- Figure 47: Europe US Securities Brokerage Market Revenue (Million), by Country 2025 & 2033
- Figure 48: Europe US Securities Brokerage Market Volume (Billion), by Country 2025 & 2033
- Figure 49: Europe US Securities Brokerage Market Revenue Share (%), by Country 2025 & 2033
- Figure 50: Europe US Securities Brokerage Market Volume Share (%), by Country 2025 & 2033
- Figure 51: Middle East & Africa US Securities Brokerage Market Revenue (Million), by Type 2025 & 2033
- Figure 52: Middle East & Africa US Securities Brokerage Market Volume (Billion), by Type 2025 & 2033
- Figure 53: Middle East & Africa US Securities Brokerage Market Revenue Share (%), by Type 2025 & 2033
- Figure 54: Middle East & Africa US Securities Brokerage Market Volume Share (%), by Type 2025 & 2033
- Figure 55: Middle East & Africa US Securities Brokerage Market Revenue (Million), by Mode 2025 & 2033
- Figure 56: Middle East & Africa US Securities Brokerage Market Volume (Billion), by Mode 2025 & 2033
- Figure 57: Middle East & Africa US Securities Brokerage Market Revenue Share (%), by Mode 2025 & 2033
- Figure 58: Middle East & Africa US Securities Brokerage Market Volume Share (%), by Mode 2025 & 2033
- Figure 59: Middle East & Africa US Securities Brokerage Market Revenue (Million), by Type of Establishment 2025 & 2033
- Figure 60: Middle East & Africa US Securities Brokerage Market Volume (Billion), by Type of Establishment 2025 & 2033
- Figure 61: Middle East & Africa US Securities Brokerage Market Revenue Share (%), by Type of Establishment 2025 & 2033
- Figure 62: Middle East & Africa US Securities Brokerage Market Volume Share (%), by Type of Establishment 2025 & 2033
- Figure 63: Middle East & Africa US Securities Brokerage Market Revenue (Million), by Country 2025 & 2033
- Figure 64: Middle East & Africa US Securities Brokerage Market Volume (Billion), by Country 2025 & 2033
- Figure 65: Middle East & Africa US Securities Brokerage Market Revenue Share (%), by Country 2025 & 2033
- Figure 66: Middle East & Africa US Securities Brokerage Market Volume Share (%), by Country 2025 & 2033
- Figure 67: Asia Pacific US Securities Brokerage Market Revenue (Million), by Type 2025 & 2033
- Figure 68: Asia Pacific US Securities Brokerage Market Volume (Billion), by Type 2025 & 2033
- Figure 69: Asia Pacific US Securities Brokerage Market Revenue Share (%), by Type 2025 & 2033
- Figure 70: Asia Pacific US Securities Brokerage Market Volume Share (%), by Type 2025 & 2033
- Figure 71: Asia Pacific US Securities Brokerage Market Revenue (Million), by Mode 2025 & 2033
- Figure 72: Asia Pacific US Securities Brokerage Market Volume (Billion), by Mode 2025 & 2033
- Figure 73: Asia Pacific US Securities Brokerage Market Revenue Share (%), by Mode 2025 & 2033
- Figure 74: Asia Pacific US Securities Brokerage Market Volume Share (%), by Mode 2025 & 2033
- Figure 75: Asia Pacific US Securities Brokerage Market Revenue (Million), by Type of Establishment 2025 & 2033
- Figure 76: Asia Pacific US Securities Brokerage Market Volume (Billion), by Type of Establishment 2025 & 2033
- Figure 77: Asia Pacific US Securities Brokerage Market Revenue Share (%), by Type of Establishment 2025 & 2033
- Figure 78: Asia Pacific US Securities Brokerage Market Volume Share (%), by Type of Establishment 2025 & 2033
- Figure 79: Asia Pacific US Securities Brokerage Market Revenue (Million), by Country 2025 & 2033
- Figure 80: Asia Pacific US Securities Brokerage Market Volume (Billion), by Country 2025 & 2033
- Figure 81: Asia Pacific US Securities Brokerage Market Revenue Share (%), by Country 2025 & 2033
- Figure 82: Asia Pacific US Securities Brokerage Market Volume Share (%), by Country 2025 & 2033
List of Tables
- Table 1: Global US Securities Brokerage Market Revenue Million Forecast, by Type 2020 & 2033
- Table 2: Global US Securities Brokerage Market Volume Billion Forecast, by Type 2020 & 2033
- Table 3: Global US Securities Brokerage Market Revenue Million Forecast, by Mode 2020 & 2033
- Table 4: Global US Securities Brokerage Market Volume Billion Forecast, by Mode 2020 & 2033
- Table 5: Global US Securities Brokerage Market Revenue Million Forecast, by Type of Establishment 2020 & 2033
- Table 6: Global US Securities Brokerage Market Volume Billion Forecast, by Type of Establishment 2020 & 2033
- Table 7: Global US Securities Brokerage Market Revenue Million Forecast, by Region 2020 & 2033
- Table 8: Global US Securities Brokerage Market Volume Billion Forecast, by Region 2020 & 2033
- Table 9: Global US Securities Brokerage Market Revenue Million Forecast, by Type 2020 & 2033
- Table 10: Global US Securities Brokerage Market Volume Billion Forecast, by Type 2020 & 2033
- Table 11: Global US Securities Brokerage Market Revenue Million Forecast, by Mode 2020 & 2033
- Table 12: Global US Securities Brokerage Market Volume Billion Forecast, by Mode 2020 & 2033
- Table 13: Global US Securities Brokerage Market Revenue Million Forecast, by Type of Establishment 2020 & 2033
- Table 14: Global US Securities Brokerage Market Volume Billion Forecast, by Type of Establishment 2020 & 2033
- Table 15: Global US Securities Brokerage Market Revenue Million Forecast, by Country 2020 & 2033
- Table 16: Global US Securities Brokerage Market Volume Billion Forecast, by Country 2020 & 2033
- Table 17: United States US Securities Brokerage Market Revenue (Million) Forecast, by Application 2020 & 2033
- Table 18: United States US Securities Brokerage Market Volume (Billion) Forecast, by Application 2020 & 2033
- Table 19: Canada US Securities Brokerage Market Revenue (Million) Forecast, by Application 2020 & 2033
- Table 20: Canada US Securities Brokerage Market Volume (Billion) Forecast, by Application 2020 & 2033
- Table 21: Mexico US Securities Brokerage Market Revenue (Million) Forecast, by Application 2020 & 2033
- Table 22: Mexico US Securities Brokerage Market Volume (Billion) Forecast, by Application 2020 & 2033
- Table 23: Global US Securities Brokerage Market Revenue Million Forecast, by Type 2020 & 2033
- Table 24: Global US Securities Brokerage Market Volume Billion Forecast, by Type 2020 & 2033
- Table 25: Global US Securities Brokerage Market Revenue Million Forecast, by Mode 2020 & 2033
- Table 26: Global US Securities Brokerage Market Volume Billion Forecast, by Mode 2020 & 2033
- Table 27: Global US Securities Brokerage Market Revenue Million Forecast, by Type of Establishment 2020 & 2033
- Table 28: Global US Securities Brokerage Market Volume Billion Forecast, by Type of Establishment 2020 & 2033
- Table 29: Global US Securities Brokerage Market Revenue Million Forecast, by Country 2020 & 2033
- Table 30: Global US Securities Brokerage Market Volume Billion Forecast, by Country 2020 & 2033
- Table 31: Brazil US Securities Brokerage Market Revenue (Million) Forecast, by Application 2020 & 2033
- Table 32: Brazil US Securities Brokerage Market Volume (Billion) Forecast, by Application 2020 & 2033
- Table 33: Argentina US Securities Brokerage Market Revenue (Million) Forecast, by Application 2020 & 2033
- Table 34: Argentina US Securities Brokerage Market Volume (Billion) Forecast, by Application 2020 & 2033
- Table 35: Rest of South America US Securities Brokerage Market Revenue (Million) Forecast, by Application 2020 & 2033
- Table 36: Rest of South America US Securities Brokerage Market Volume (Billion) Forecast, by Application 2020 & 2033
- Table 37: Global US Securities Brokerage Market Revenue Million Forecast, by Type 2020 & 2033
- Table 38: Global US Securities Brokerage Market Volume Billion Forecast, by Type 2020 & 2033
- Table 39: Global US Securities Brokerage Market Revenue Million Forecast, by Mode 2020 & 2033
- Table 40: Global US Securities Brokerage Market Volume Billion Forecast, by Mode 2020 & 2033
- Table 41: Global US Securities Brokerage Market Revenue Million Forecast, by Type of Establishment 2020 & 2033
- Table 42: Global US Securities Brokerage Market Volume Billion Forecast, by Type of Establishment 2020 & 2033
- Table 43: Global US Securities Brokerage Market Revenue Million Forecast, by Country 2020 & 2033
- Table 44: Global US Securities Brokerage Market Volume Billion Forecast, by Country 2020 & 2033
- Table 45: United Kingdom US Securities Brokerage Market Revenue (Million) Forecast, by Application 2020 & 2033
- Table 46: United Kingdom US Securities Brokerage Market Volume (Billion) Forecast, by Application 2020 & 2033
- Table 47: Germany US Securities Brokerage Market Revenue (Million) Forecast, by Application 2020 & 2033
- Table 48: Germany US Securities Brokerage Market Volume (Billion) Forecast, by Application 2020 & 2033
- Table 49: France US Securities Brokerage Market Revenue (Million) Forecast, by Application 2020 & 2033
- Table 50: France US Securities Brokerage Market Volume (Billion) Forecast, by Application 2020 & 2033
- Table 51: Italy US Securities Brokerage Market Revenue (Million) Forecast, by Application 2020 & 2033
- Table 52: Italy US Securities Brokerage Market Volume (Billion) Forecast, by Application 2020 & 2033
- Table 53: Spain US Securities Brokerage Market Revenue (Million) Forecast, by Application 2020 & 2033
- Table 54: Spain US Securities Brokerage Market Volume (Billion) Forecast, by Application 2020 & 2033
- Table 55: Russia US Securities Brokerage Market Revenue (Million) Forecast, by Application 2020 & 2033
- Table 56: Russia US Securities Brokerage Market Volume (Billion) Forecast, by Application 2020 & 2033
- Table 57: Benelux US Securities Brokerage Market Revenue (Million) Forecast, by Application 2020 & 2033
- Table 58: Benelux US Securities Brokerage Market Volume (Billion) Forecast, by Application 2020 & 2033
- Table 59: Nordics US Securities Brokerage Market Revenue (Million) Forecast, by Application 2020 & 2033
- Table 60: Nordics US Securities Brokerage Market Volume (Billion) Forecast, by Application 2020 & 2033
- Table 61: Rest of Europe US Securities Brokerage Market Revenue (Million) Forecast, by Application 2020 & 2033
- Table 62: Rest of Europe US Securities Brokerage Market Volume (Billion) Forecast, by Application 2020 & 2033
- Table 63: Global US Securities Brokerage Market Revenue Million Forecast, by Type 2020 & 2033
- Table 64: Global US Securities Brokerage Market Volume Billion Forecast, by Type 2020 & 2033
- Table 65: Global US Securities Brokerage Market Revenue Million Forecast, by Mode 2020 & 2033
- Table 66: Global US Securities Brokerage Market Volume Billion Forecast, by Mode 2020 & 2033
- Table 67: Global US Securities Brokerage Market Revenue Million Forecast, by Type of Establishment 2020 & 2033
- Table 68: Global US Securities Brokerage Market Volume Billion Forecast, by Type of Establishment 2020 & 2033
- Table 69: Global US Securities Brokerage Market Revenue Million Forecast, by Country 2020 & 2033
- Table 70: Global US Securities Brokerage Market Volume Billion Forecast, by Country 2020 & 2033
- Table 71: Turkey US Securities Brokerage Market Revenue (Million) Forecast, by Application 2020 & 2033
- Table 72: Turkey US Securities Brokerage Market Volume (Billion) Forecast, by Application 2020 & 2033
- Table 73: Israel US Securities Brokerage Market Revenue (Million) Forecast, by Application 2020 & 2033
- Table 74: Israel US Securities Brokerage Market Volume (Billion) Forecast, by Application 2020 & 2033
- Table 75: GCC US Securities Brokerage Market Revenue (Million) Forecast, by Application 2020 & 2033
- Table 76: GCC US Securities Brokerage Market Volume (Billion) Forecast, by Application 2020 & 2033
- Table 77: North Africa US Securities Brokerage Market Revenue (Million) Forecast, by Application 2020 & 2033
- Table 78: North Africa US Securities Brokerage Market Volume (Billion) Forecast, by Application 2020 & 2033
- Table 79: South Africa US Securities Brokerage Market Revenue (Million) Forecast, by Application 2020 & 2033
- Table 80: South Africa US Securities Brokerage Market Volume (Billion) Forecast, by Application 2020 & 2033
- Table 81: Rest of Middle East & Africa US Securities Brokerage Market Revenue (Million) Forecast, by Application 2020 & 2033
- Table 82: Rest of Middle East & Africa US Securities Brokerage Market Volume (Billion) Forecast, by Application 2020 & 2033
- Table 83: Global US Securities Brokerage Market Revenue Million Forecast, by Type 2020 & 2033
- Table 84: Global US Securities Brokerage Market Volume Billion Forecast, by Type 2020 & 2033
- Table 85: Global US Securities Brokerage Market Revenue Million Forecast, by Mode 2020 & 2033
- Table 86: Global US Securities Brokerage Market Volume Billion Forecast, by Mode 2020 & 2033
- Table 87: Global US Securities Brokerage Market Revenue Million Forecast, by Type of Establishment 2020 & 2033
- Table 88: Global US Securities Brokerage Market Volume Billion Forecast, by Type of Establishment 2020 & 2033
- Table 89: Global US Securities Brokerage Market Revenue Million Forecast, by Country 2020 & 2033
- Table 90: Global US Securities Brokerage Market Volume Billion Forecast, by Country 2020 & 2033
- Table 91: China US Securities Brokerage Market Revenue (Million) Forecast, by Application 2020 & 2033
- Table 92: China US Securities Brokerage Market Volume (Billion) Forecast, by Application 2020 & 2033
- Table 93: India US Securities Brokerage Market Revenue (Million) Forecast, by Application 2020 & 2033
- Table 94: India US Securities Brokerage Market Volume (Billion) Forecast, by Application 2020 & 2033
- Table 95: Japan US Securities Brokerage Market Revenue (Million) Forecast, by Application 2020 & 2033
- Table 96: Japan US Securities Brokerage Market Volume (Billion) Forecast, by Application 2020 & 2033
- Table 97: South Korea US Securities Brokerage Market Revenue (Million) Forecast, by Application 2020 & 2033
- Table 98: South Korea US Securities Brokerage Market Volume (Billion) Forecast, by Application 2020 & 2033
- Table 99: ASEAN US Securities Brokerage Market Revenue (Million) Forecast, by Application 2020 & 2033
- Table 100: ASEAN US Securities Brokerage Market Volume (Billion) Forecast, by Application 2020 & 2033
- Table 101: Oceania US Securities Brokerage Market Revenue (Million) Forecast, by Application 2020 & 2033
- Table 102: Oceania US Securities Brokerage Market Volume (Billion) Forecast, by Application 2020 & 2033
- Table 103: Rest of Asia Pacific US Securities Brokerage Market Revenue (Million) Forecast, by Application 2020 & 2033
- Table 104: Rest of Asia Pacific US Securities Brokerage Market Volume (Billion) Forecast, by Application 2020 & 2033
Frequently Asked Questions
1. What is the projected Compound Annual Growth Rate (CAGR) of the US Securities Brokerage Market?
The projected CAGR is approximately 4.23%.
2. Which companies are prominent players in the US Securities Brokerage Market?
Key companies in the market include Fidelity, E-Trade, Merrill Edge, Interactive Brokers, JPMorgan Wealth Management, Webull, Robinhood, Ally Invest, Firstrade, Charles Schwab**List Not Exhaustive.
3. What are the main segments of the US Securities Brokerage Market?
The market segments include Type, Mode, Type of Establishment.
4. Can you provide details about the market size?
The market size is estimated to be USD 196.99 Million as of 2022.
5. What are some drivers contributing to market growth?
N/A
6. What are the notable trends driving market growth?
Securities Brokerage is the leading Revenue generating in US Market.
7. Are there any restraints impacting market growth?
N/A
8. Can you provide examples of recent developments in the market?
February 2023: Fidelity Investments, one of the world's leading global fixed-income investment managers, announced the launch of the Fidelity Municipal Core Plus Bond Fund (FMBAX), adding to Fidelity's diverse lineup of active fixed-income strategies reaching across the risk spectrum. The fund, which allows Fidelity to participate in a fast-growing subset within the municipal bond space, is available commission-free and with no investment minimum to individual investors and financial advisors through Fidelity's online brokerage platforms.
9. What pricing options are available for accessing the report?
Pricing options include single-user, multi-user, and enterprise licenses priced at USD 3800, USD 4500, and USD 5800 respectively.
10. Is the market size provided in terms of value or volume?
The market size is provided in terms of value, measured in Million and volume, measured in Billion.
11. Are there any specific market keywords associated with the report?
Yes, the market keyword associated with the report is "US Securities Brokerage Market," which aids in identifying and referencing the specific market segment covered.
12. How do I determine which pricing option suits my needs best?
The pricing options vary based on user requirements and access needs. Individual users may opt for single-user licenses, while businesses requiring broader access may choose multi-user or enterprise licenses for cost-effective access to the report.
13. Are there any additional resources or data provided in the US Securities Brokerage Market report?
While the report offers comprehensive insights, it's advisable to review the specific contents or supplementary materials provided to ascertain if additional resources or data are available.
14. How can I stay updated on further developments or reports in the US Securities Brokerage Market?
To stay informed about further developments, trends, and reports in the US Securities Brokerage Market, consider subscribing to industry newsletters, following relevant companies and organizations, or regularly checking reputable industry news sources and publications.
Methodology
Step 1 - Identification of Relevant Samples Size from Population Database


Step 2 - Approaches for Defining Global Market Size (Value, Volume* & Price*)

Note*: In applicable scenarios
Step 3 - Data Sources
Primary Research
- Web Analytics
- Survey Reports
- Research Institute
- Latest Research Reports
- Opinion Leaders
Secondary Research
- Annual Reports
- White Paper
- Latest Press Release
- Industry Association
- Paid Database
- Investor Presentations

Step 4 - Data Triangulation
Involves using different sources of information in order to increase the validity of a study
These sources are likely to be stakeholders in a program - participants, other researchers, program staff, other community members, and so on.
Then we put all data in single framework & apply various statistical tools to find out the dynamic on the market.
During the analysis stage, feedback from the stakeholder groups would be compared to determine areas of agreement as well as areas of divergence