

Key Insights
The USA home loan market, a significant segment of the broader financial services industry, is experiencing robust growth, projected to maintain a Compound Annual Growth Rate (CAGR) of 18% from 2025 to 2033. This expansion is fueled by several key drivers. Low interest rates in recent years (though this trend may be shifting), coupled with government initiatives aimed at boosting homeownership, have significantly increased demand. Furthermore, the increasing population and a growing preference for single-family homes contribute to this market's expansion. However, restraints such as fluctuating interest rates, potential economic slowdowns, and stricter lending regulations pose challenges to sustained, consistent growth. The market is segmented by loan type (conventional, FHA, VA, etc.), loan size, and borrower demographics. Key players like Rocket Mortgage, LoanDepot, Wells Fargo, and others compete intensely, employing various strategies including technological advancements (online applications, digital closings) and personalized customer service to attract and retain borrowers. The regional distribution reflects population density and economic activity, with higher concentrations in populous states such as California, Texas, and Florida.
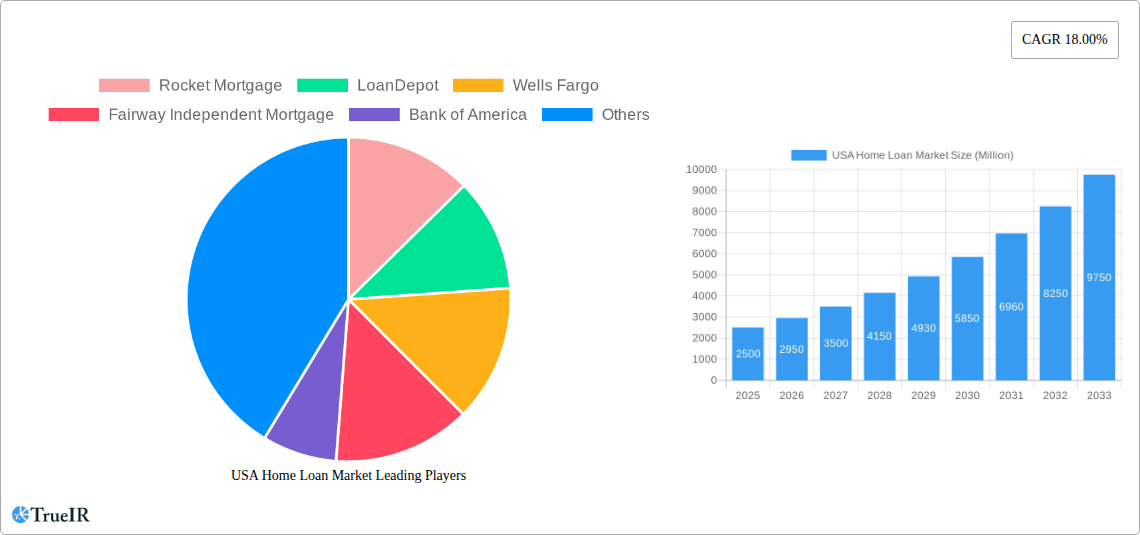
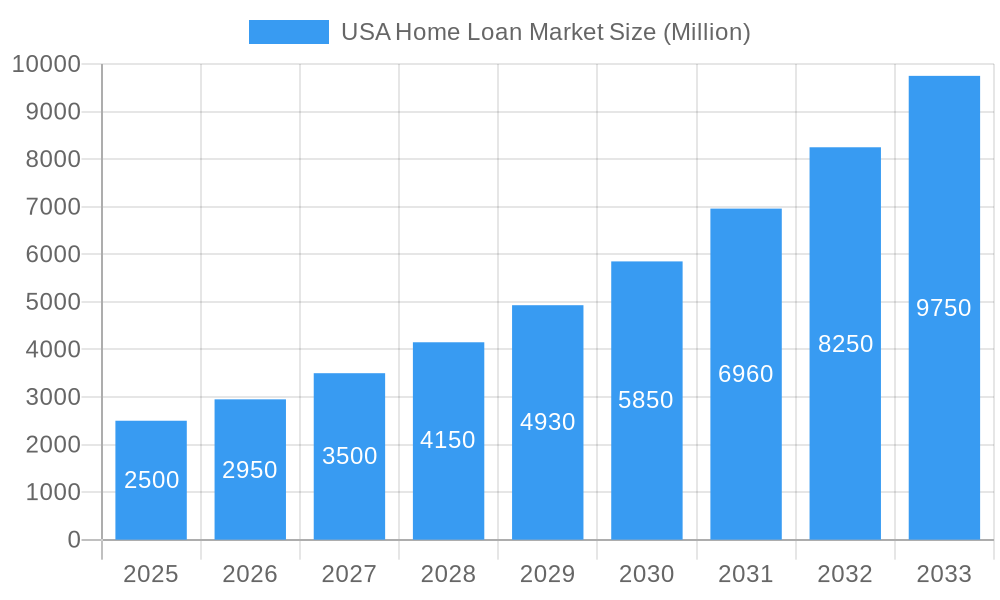
USA Home Loan Market Market Size (In Billion)
The forecast period (2025-2033) anticipates continued growth, albeit potentially at a moderated pace compared to the initial years, reflecting the cyclical nature of the housing market and the potential impact of macroeconomic factors. Competition will likely intensify, driving innovation and consolidation within the industry. Companies are focusing on improving customer experience, enhancing their digital platforms, and expanding their product offerings to maintain a competitive edge. The long-term outlook remains positive, with projected growth predicated on consistent economic expansion and sustained demand for housing. However, careful monitoring of macroeconomic indicators and regulatory changes is crucial for effective strategic planning within the sector.
USA Home Loan Market Company Market Share
USA Home Loan Market Report: 2019-2033 Forecast
This comprehensive report provides a detailed analysis of the USA Home Loan Market, offering invaluable insights for industry professionals, investors, and strategic decision-makers. Covering the period from 2019 to 2033, with a focus on 2025, this report leverages robust data and expert analysis to illuminate market trends, competitive dynamics, and future growth potential. The report's findings are crucial for navigating the complexities of this dynamic market and capitalizing on emerging opportunities. The market is estimated to be worth xx Million in 2025 and is projected to grow at a CAGR of xx% during the forecast period (2025-2033).
USA Home Loan Market Market Structure & Competitive Landscape
The USA home loan market is characterized by a moderately concentrated structure, with a few large players dominating the landscape. However, significant regional variations exist, with smaller, regional lenders playing a crucial role in specific geographic areas. The Herfindahl-Hirschman Index (HHI) for the market is estimated to be xx, indicating a moderately concentrated market. Key factors shaping the competitive landscape include:
Market Concentration: The top 10 lenders account for approximately xx% of the total market share in 2025. This share is expected to increase slightly by 2033 due to mergers and acquisitions and the exit of smaller players.
Innovation Drivers: Technological advancements like AI-powered loan origination systems, digital mortgage platforms, and enhanced data analytics are driving efficiency and innovation within the sector.
Regulatory Impacts: Stricter regulations regarding lending practices, consumer protection, and compliance continue to shape the industry's landscape, impacting operational costs and market entry barriers. The Dodd-Frank Act and other federal and state regulations continue to be significant influencing factors.
Product Substitutes: The emergence of alternative financing options, such as peer-to-peer lending and Fintech solutions, presents a growing challenge to traditional mortgage providers.
End-User Segmentation: The market is segmented by borrower type (first-time homebuyers, repeat buyers, investors), loan type (fixed-rate, adjustable-rate, FHA, VA), and property type (single-family homes, multi-family units). First-time homebuyers represent a significant and growing segment.
M&A Trends: The past five years have witnessed a moderate level of merger and acquisition activity, driven by the need for scale, technological integration, and broader market reach. The total value of M&A transactions in the sector from 2019 to 2024 is estimated at xx Million.
USA Home Loan Market Market Trends & Opportunities
The US home loan market is experiencing a dynamic period of transformation, driven by several key trends. Market size grew from xx Million in 2019 to an estimated xx Million in 2024, reflecting the cyclical nature of the housing market and fluctuating interest rates. Technological advancements are streamlining processes, improving customer experience, and driving down costs. Rising consumer expectations for personalized service and digital convenience are reshaping the competitive landscape. Key market trends include:
Market Size Growth: The market is experiencing a cyclical growth pattern, influenced heavily by interest rate fluctuations and economic conditions. The CAGR for the historical period (2019-2024) was xx%, while the forecasted CAGR (2025-2033) is xx%. The market penetration rate for mortgages is estimated at xx% in 2025.
Technological Shifts: Digital mortgage platforms, AI-powered underwriting, and blockchain technology are improving efficiency, reducing costs, and enhancing the customer experience.
Consumer Preferences: Consumers increasingly demand personalized service, faster processing times, and transparent pricing, pushing lenders to innovate and improve their offerings.
Competitive Dynamics: Increased competition from Fintech companies and the expansion of non-bank lenders is forcing traditional players to adapt and innovate to maintain market share.
Dominant Markets & Segments in USA Home Loan Market
The geographically dominant markets and highest growth segments within the USA home loan market are constantly in flux but tend to be concentrated in areas with high population density, strong economic growth, and favorable housing markets.
Key Growth Drivers:
- Favorable Demographics: Millennial and Gen Z populations entering prime home-buying years will drive demand.
- Economic Growth: Strong economic growth in specific regions fuels higher demand for housing.
- Government Policies: Affordable housing initiatives and mortgage insurance programs influence market activity.
- Infrastructure Development: New infrastructure projects can stimulate growth in related areas.
Market Dominance Analysis: While the national market is significant, certain states consistently exhibit higher transaction volumes and loan originations than others. California, Texas, Florida, and New York typically represent significant market shares, driven by robust real estate markets and large populations. These states will likely continue their dominance during the forecast period due to ongoing population growth and economic activity.
USA Home Loan Market Product Analysis
The home loan market offers a diverse range of products catering to various customer needs and risk profiles. These include fixed-rate mortgages, adjustable-rate mortgages (ARMs), government-backed loans (FHA, VA), jumbo loans, and specialized financing options for unique property types. Recent innovations focus on streamlining the application process, leveraging technology for faster approvals, and offering personalized solutions tailored to individual financial situations. Competition is fierce, with lenders vying for market share through competitive pricing, flexible terms, and innovative features.
Key Drivers, Barriers & Challenges in USA Home Loan Market
Key Drivers: Low interest rates, government incentives (e.g., tax breaks for homebuyers), and increasing demand fueled by population growth and urbanization have significantly driven market expansion. Technological advancements, offering streamlined processes and improved customer experience, also play a crucial role.
Challenges and Restraints: Fluctuating interest rates, economic downturns (potentially leading to decreased demand and increased defaults), and stringent regulatory requirements represent significant challenges. Supply chain disruptions impacting the construction industry can indirectly constrain market growth by limiting the availability of new homes. Competition from FinTech and non-bank lenders intensifies the pressure on traditional institutions.
Growth Drivers in the USA Home Loan Market Market
Several factors will continue to drive growth in the USA home loan market. These include sustained population growth, especially in key geographic areas, continued demand for homeownership among millennials and Gen Z, and technological innovations that are enhancing the efficiency and convenience of the mortgage process. Government policies aimed at supporting homeownership, such as tax credits and affordable housing initiatives, will also play a role.
Challenges Impacting USA Home Loan Market Growth
The market faces challenges such as rising interest rates potentially curbing demand, increasing regulatory scrutiny leading to higher compliance costs, and the emergence of disruptive financial technologies that alter the competitive landscape. Economic uncertainties, potential recessions, and disruptions to the construction industry can also negatively impact market growth.
Key Players Shaping the USA Home Loan Market Market
Significant USA Home Loan Market Industry Milestones
- July 2022: Rocket Mortgage expands into the Canadian market, significantly broadening its operational reach and market potential. This illustrates the increasing global reach of major players in the home loan sector.
- June 2023: Bank of America's expansion into four new US states demonstrates the ongoing competition for market share amongst large banking institutions, and signifies a commitment to physical presence despite increasing digitization in the sector. This could be seen as a strategic move to secure customer base and bolster market presence.
Future Outlook for USA Home Loan Market Market
The future outlook for the USA home loan market is positive, driven by several factors including long-term demographic trends, persistent demand for homeownership, and technological advancements. The market is expected to experience steady growth, although the rate of expansion will likely fluctuate depending on macroeconomic conditions and interest rate movements. Strategic opportunities exist for companies to innovate and consolidate, especially in leveraging technology to improve customer experience, increase efficiency, and reduce costs. The potential for expansion into niche markets and offering specialized financial products represents further growth avenues.
USA Home Loan Market Segmentation
-
1. Loan Type
- 1.1. Home Purchase
- 1.2. Refinance
- 1.3. Home Improvement
- 1.4. Other Loan Types
-
2. Source
- 2.1. Bank
- 2.2. Housing Finance Companies (HFC's)
-
3. Interest Rate
- 3.1. Fixed Rate
- 3.2. Floating Rate
-
4. Tenure
- 4.1. Upto 5 Years
- 4.2. 6 - 10 Years
- 4.3. 11 - 24 Years
- 4.4. 25 - 30 Years
USA Home Loan Market Segmentation By Geography
-
1. North America
- 1.1. United States
- 1.2. Canada
- 1.3. Mexico
-
2. South America
- 2.1. Brazil
- 2.2. Argentina
- 2.3. Rest of South America
-
3. Europe
- 3.1. United Kingdom
- 3.2. Germany
- 3.3. France
- 3.4. Italy
- 3.5. Spain
- 3.6. Russia
- 3.7. Benelux
- 3.8. Nordics
- 3.9. Rest of Europe
-
4. Middle East & Africa
- 4.1. Turkey
- 4.2. Israel
- 4.3. GCC
- 4.4. North Africa
- 4.5. South Africa
- 4.6. Rest of Middle East & Africa
-
5. Asia Pacific
- 5.1. China
- 5.2. India
- 5.3. Japan
- 5.4. South Korea
- 5.5. ASEAN
- 5.6. Oceania
- 5.7. Rest of Asia Pacific
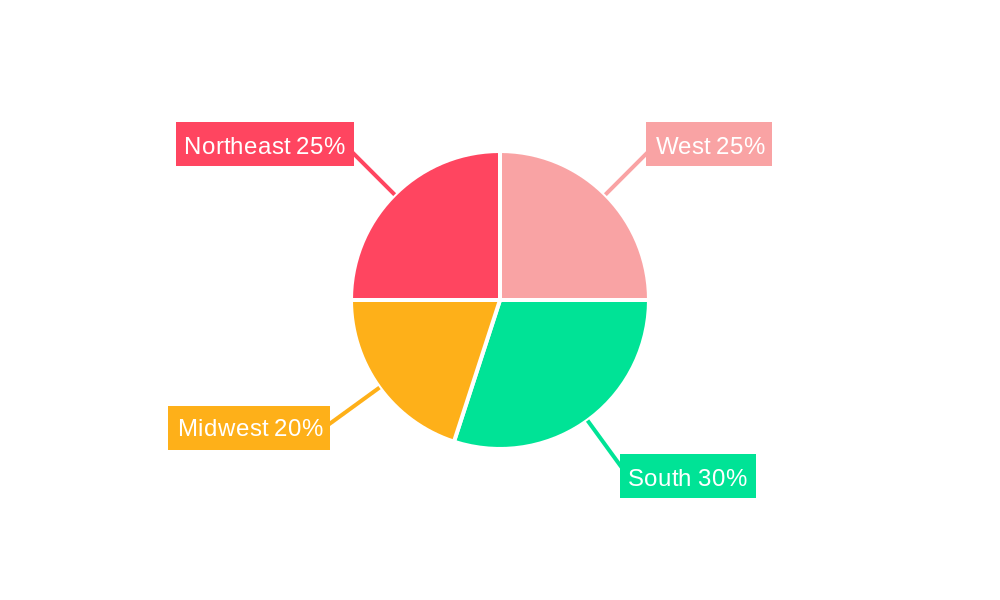
USA Home Loan Market Regional Market Share
Geographic Coverage of USA Home Loan Market
USA Home Loan Market REPORT HIGHLIGHTS
| Aspects | Details |
|---|---|
| Study Period | 2020-2034 |
| Base Year | 2025 |
| Estimated Year | 2026 |
| Forecast Period | 2026-2034 |
| Historical Period | 2020-2025 |
| Growth Rate | CAGR of 5.2% from 2020-2034 |
| Segmentation |
|
Table of Contents
- 1. Introduction
- 1.1. Research Scope
- 1.2. Market Segmentation
- 1.3. Research Objective
- 1.4. Definitions and Assumptions
- 2. Executive Summary
- 2.1. Market Snapshot
- 3. Market Dynamics
- 3.1. Market Drivers
- 3.2. Market Restrains
- 3.3. Market Trends
- 3.4. Market Opportunities
- 4. Market Factor Analysis
- 4.1. Porters Five Forces
- 4.1.1. Bargaining Power of Suppliers
- 4.1.2. Bargaining Power of Buyers
- 4.1.3. Threat of New Entrants
- 4.1.4. Threat of Substitutes
- 4.1.5. Competitive Rivalry
- 4.2. PESTEL analysis
- 4.3. BCG Analysis
- 4.3.1. Stars (High Growth, High Market Share)
- 4.3.2. Cash Cows (Low Growth, High Market Share)
- 4.3.3. Question Mark (High Growth, Low Market Share)
- 4.3.4. Dogs (Low Growth, Low Market Share)
- 4.4. Ansoff Matrix Analysis
- 4.5. Supply Chain Analysis
- 4.6. Regulatory Landscape
- 4.7. Current Market Potential and Opportunity Assessment (TAM–SAM–SOM Framework)
- 4.8. TIR Analyst Note
- 4.1. Porters Five Forces
- 5. Market Analysis, Insights and Forecast 2021-2033
- 5.1. Market Analysis, Insights and Forecast - by Loan Type
- 5.1.1. Home Purchase
- 5.1.2. Refinance
- 5.1.3. Home Improvement
- 5.1.4. Other Loan Types
- 5.2. Market Analysis, Insights and Forecast - by Source
- 5.2.1. Bank
- 5.2.2. Housing Finance Companies (HFC's)
- 5.3. Market Analysis, Insights and Forecast - by Interest Rate
- 5.3.1. Fixed Rate
- 5.3.2. Floating Rate
- 5.4. Market Analysis, Insights and Forecast - by Tenure
- 5.4.1. Upto 5 Years
- 5.4.2. 6 - 10 Years
- 5.4.3. 11 - 24 Years
- 5.4.4. 25 - 30 Years
- 5.5. Market Analysis, Insights and Forecast - by Region
- 5.5.1. North America
- 5.5.2. South America
- 5.5.3. Europe
- 5.5.4. Middle East & Africa
- 5.5.5. Asia Pacific
- 5.1. Market Analysis, Insights and Forecast - by Loan Type
- 6. Global USA Home Loan Market Analysis, Insights and Forecast, 2021-2033
- 6.1. Market Analysis, Insights and Forecast - by Loan Type
- 6.1.1. Home Purchase
- 6.1.2. Refinance
- 6.1.3. Home Improvement
- 6.1.4. Other Loan Types
- 6.2. Market Analysis, Insights and Forecast - by Source
- 6.2.1. Bank
- 6.2.2. Housing Finance Companies (HFC's)
- 6.3. Market Analysis, Insights and Forecast - by Interest Rate
- 6.3.1. Fixed Rate
- 6.3.2. Floating Rate
- 6.4. Market Analysis, Insights and Forecast - by Tenure
- 6.4.1. Upto 5 Years
- 6.4.2. 6 - 10 Years
- 6.4.3. 11 - 24 Years
- 6.4.4. 25 - 30 Years
- 6.1. Market Analysis, Insights and Forecast - by Loan Type
- 7. North America USA Home Loan Market Analysis, Insights and Forecast, 2020-2032
- 7.1. Market Analysis, Insights and Forecast - by Loan Type
- 7.1.1. Home Purchase
- 7.1.2. Refinance
- 7.1.3. Home Improvement
- 7.1.4. Other Loan Types
- 7.2. Market Analysis, Insights and Forecast - by Source
- 7.2.1. Bank
- 7.2.2. Housing Finance Companies (HFC's)
- 7.3. Market Analysis, Insights and Forecast - by Interest Rate
- 7.3.1. Fixed Rate
- 7.3.2. Floating Rate
- 7.4. Market Analysis, Insights and Forecast - by Tenure
- 7.4.1. Upto 5 Years
- 7.4.2. 6 - 10 Years
- 7.4.3. 11 - 24 Years
- 7.4.4. 25 - 30 Years
- 7.1. Market Analysis, Insights and Forecast - by Loan Type
- 8. South America USA Home Loan Market Analysis, Insights and Forecast, 2020-2032
- 8.1. Market Analysis, Insights and Forecast - by Loan Type
- 8.1.1. Home Purchase
- 8.1.2. Refinance
- 8.1.3. Home Improvement
- 8.1.4. Other Loan Types
- 8.2. Market Analysis, Insights and Forecast - by Source
- 8.2.1. Bank
- 8.2.2. Housing Finance Companies (HFC's)
- 8.3. Market Analysis, Insights and Forecast - by Interest Rate
- 8.3.1. Fixed Rate
- 8.3.2. Floating Rate
- 8.4. Market Analysis, Insights and Forecast - by Tenure
- 8.4.1. Upto 5 Years
- 8.4.2. 6 - 10 Years
- 8.4.3. 11 - 24 Years
- 8.4.4. 25 - 30 Years
- 8.1. Market Analysis, Insights and Forecast - by Loan Type
- 9. Europe USA Home Loan Market Analysis, Insights and Forecast, 2020-2032
- 9.1. Market Analysis, Insights and Forecast - by Loan Type
- 9.1.1. Home Purchase
- 9.1.2. Refinance
- 9.1.3. Home Improvement
- 9.1.4. Other Loan Types
- 9.2. Market Analysis, Insights and Forecast - by Source
- 9.2.1. Bank
- 9.2.2. Housing Finance Companies (HFC's)
- 9.3. Market Analysis, Insights and Forecast - by Interest Rate
- 9.3.1. Fixed Rate
- 9.3.2. Floating Rate
- 9.4. Market Analysis, Insights and Forecast - by Tenure
- 9.4.1. Upto 5 Years
- 9.4.2. 6 - 10 Years
- 9.4.3. 11 - 24 Years
- 9.4.4. 25 - 30 Years
- 9.1. Market Analysis, Insights and Forecast - by Loan Type
- 10. Middle East & Africa USA Home Loan Market Analysis, Insights and Forecast, 2020-2032
- 10.1. Market Analysis, Insights and Forecast - by Loan Type
- 10.1.1. Home Purchase
- 10.1.2. Refinance
- 10.1.3. Home Improvement
- 10.1.4. Other Loan Types
- 10.2. Market Analysis, Insights and Forecast - by Source
- 10.2.1. Bank
- 10.2.2. Housing Finance Companies (HFC's)
- 10.3. Market Analysis, Insights and Forecast - by Interest Rate
- 10.3.1. Fixed Rate
- 10.3.2. Floating Rate
- 10.4. Market Analysis, Insights and Forecast - by Tenure
- 10.4.1. Upto 5 Years
- 10.4.2. 6 - 10 Years
- 10.4.3. 11 - 24 Years
- 10.4.4. 25 - 30 Years
- 10.1. Market Analysis, Insights and Forecast - by Loan Type
- 11. Asia Pacific USA Home Loan Market Analysis, Insights and Forecast, 2020-2032
- 11.1. Market Analysis, Insights and Forecast - by Loan Type
- 11.1.1. Home Purchase
- 11.1.2. Refinance
- 11.1.3. Home Improvement
- 11.1.4. Other Loan Types
- 11.2. Market Analysis, Insights and Forecast - by Source
- 11.2.1. Bank
- 11.2.2. Housing Finance Companies (HFC's)
- 11.3. Market Analysis, Insights and Forecast - by Interest Rate
- 11.3.1. Fixed Rate
- 11.3.2. Floating Rate
- 11.4. Market Analysis, Insights and Forecast - by Tenure
- 11.4.1. Upto 5 Years
- 11.4.2. 6 - 10 Years
- 11.4.3. 11 - 24 Years
- 11.4.4. 25 - 30 Years
- 11.1. Market Analysis, Insights and Forecast - by Loan Type
- 12. Competitive Analysis
- 12.1. Company Profiles
- 12.1.1 Rocket Mortgage
- 12.1.1.1. Company Overview
- 12.1.1.2. Products
- 12.1.1.3. Company Financials
- 12.1.1.4. SWOT Analysis
- 12.1.2 LoanDepot
- 12.1.2.1. Company Overview
- 12.1.2.2. Products
- 12.1.2.3. Company Financials
- 12.1.2.4. SWOT Analysis
- 12.1.3 Wells Fargo
- 12.1.3.1. Company Overview
- 12.1.3.2. Products
- 12.1.3.3. Company Financials
- 12.1.3.4. SWOT Analysis
- 12.1.4 Fairway Independent Mortgage
- 12.1.4.1. Company Overview
- 12.1.4.2. Products
- 12.1.4.3. Company Financials
- 12.1.4.4. SWOT Analysis
- 12.1.5 Bank of America
- 12.1.5.1. Company Overview
- 12.1.5.2. Products
- 12.1.5.3. Company Financials
- 12.1.5.4. SWOT Analysis
- 12.1.6 U S Bank
- 12.1.6.1. Company Overview
- 12.1.6.2. Products
- 12.1.6.3. Company Financials
- 12.1.6.4. SWOT Analysis
- 12.1.7 JPMorgan Chase
- 12.1.7.1. Company Overview
- 12.1.7.2. Products
- 12.1.7.3. Company Financials
- 12.1.7.4. SWOT Analysis
- 12.1.8 PNC Bank
- 12.1.8.1. Company Overview
- 12.1.8.2. Products
- 12.1.8.3. Company Financials
- 12.1.8.4. SWOT Analysis
- 12.1.9 Citizens Bank
- 12.1.9.1. Company Overview
- 12.1.9.2. Products
- 12.1.9.3. Company Financials
- 12.1.9.4. SWOT Analysis
- 12.1.10 United Wholesale Mortgage**List Not Exhaustive
- 12.1.10.1. Company Overview
- 12.1.10.2. Products
- 12.1.10.3. Company Financials
- 12.1.10.4. SWOT Analysis
- 12.1.1 Rocket Mortgage
- 12.2. Market Entropy
- 12.2.1 Company's Key Areas Served
- 12.2.2 Recent Developments
- 12.3. Company Market Share Analysis 2025
- 12.3.1 Top 5 Companies Market Share Analysis
- 12.3.2 Top 3 Companies Market Share Analysis
- 12.4. List of Potential Customers
- 13. Research Methodology
List of Figures
- Figure 1: Global USA Home Loan Market Revenue Breakdown (billion, %) by Region 2025 & 2033
- Figure 2: North America USA Home Loan Market Revenue (billion), by Loan Type 2025 & 2033
- Figure 3: North America USA Home Loan Market Revenue Share (%), by Loan Type 2025 & 2033
- Figure 4: North America USA Home Loan Market Revenue (billion), by Source 2025 & 2033
- Figure 5: North America USA Home Loan Market Revenue Share (%), by Source 2025 & 2033
- Figure 6: North America USA Home Loan Market Revenue (billion), by Interest Rate 2025 & 2033
- Figure 7: North America USA Home Loan Market Revenue Share (%), by Interest Rate 2025 & 2033
- Figure 8: North America USA Home Loan Market Revenue (billion), by Tenure 2025 & 2033
- Figure 9: North America USA Home Loan Market Revenue Share (%), by Tenure 2025 & 2033
- Figure 10: North America USA Home Loan Market Revenue (billion), by Country 2025 & 2033
- Figure 11: North America USA Home Loan Market Revenue Share (%), by Country 2025 & 2033
- Figure 12: South America USA Home Loan Market Revenue (billion), by Loan Type 2025 & 2033
- Figure 13: South America USA Home Loan Market Revenue Share (%), by Loan Type 2025 & 2033
- Figure 14: South America USA Home Loan Market Revenue (billion), by Source 2025 & 2033
- Figure 15: South America USA Home Loan Market Revenue Share (%), by Source 2025 & 2033
- Figure 16: South America USA Home Loan Market Revenue (billion), by Interest Rate 2025 & 2033
- Figure 17: South America USA Home Loan Market Revenue Share (%), by Interest Rate 2025 & 2033
- Figure 18: South America USA Home Loan Market Revenue (billion), by Tenure 2025 & 2033
- Figure 19: South America USA Home Loan Market Revenue Share (%), by Tenure 2025 & 2033
- Figure 20: South America USA Home Loan Market Revenue (billion), by Country 2025 & 2033
- Figure 21: South America USA Home Loan Market Revenue Share (%), by Country 2025 & 2033
- Figure 22: Europe USA Home Loan Market Revenue (billion), by Loan Type 2025 & 2033
- Figure 23: Europe USA Home Loan Market Revenue Share (%), by Loan Type 2025 & 2033
- Figure 24: Europe USA Home Loan Market Revenue (billion), by Source 2025 & 2033
- Figure 25: Europe USA Home Loan Market Revenue Share (%), by Source 2025 & 2033
- Figure 26: Europe USA Home Loan Market Revenue (billion), by Interest Rate 2025 & 2033
- Figure 27: Europe USA Home Loan Market Revenue Share (%), by Interest Rate 2025 & 2033
- Figure 28: Europe USA Home Loan Market Revenue (billion), by Tenure 2025 & 2033
- Figure 29: Europe USA Home Loan Market Revenue Share (%), by Tenure 2025 & 2033
- Figure 30: Europe USA Home Loan Market Revenue (billion), by Country 2025 & 2033
- Figure 31: Europe USA Home Loan Market Revenue Share (%), by Country 2025 & 2033
- Figure 32: Middle East & Africa USA Home Loan Market Revenue (billion), by Loan Type 2025 & 2033
- Figure 33: Middle East & Africa USA Home Loan Market Revenue Share (%), by Loan Type 2025 & 2033
- Figure 34: Middle East & Africa USA Home Loan Market Revenue (billion), by Source 2025 & 2033
- Figure 35: Middle East & Africa USA Home Loan Market Revenue Share (%), by Source 2025 & 2033
- Figure 36: Middle East & Africa USA Home Loan Market Revenue (billion), by Interest Rate 2025 & 2033
- Figure 37: Middle East & Africa USA Home Loan Market Revenue Share (%), by Interest Rate 2025 & 2033
- Figure 38: Middle East & Africa USA Home Loan Market Revenue (billion), by Tenure 2025 & 2033
- Figure 39: Middle East & Africa USA Home Loan Market Revenue Share (%), by Tenure 2025 & 2033
- Figure 40: Middle East & Africa USA Home Loan Market Revenue (billion), by Country 2025 & 2033
- Figure 41: Middle East & Africa USA Home Loan Market Revenue Share (%), by Country 2025 & 2033
- Figure 42: Asia Pacific USA Home Loan Market Revenue (billion), by Loan Type 2025 & 2033
- Figure 43: Asia Pacific USA Home Loan Market Revenue Share (%), by Loan Type 2025 & 2033
- Figure 44: Asia Pacific USA Home Loan Market Revenue (billion), by Source 2025 & 2033
- Figure 45: Asia Pacific USA Home Loan Market Revenue Share (%), by Source 2025 & 2033
- Figure 46: Asia Pacific USA Home Loan Market Revenue (billion), by Interest Rate 2025 & 2033
- Figure 47: Asia Pacific USA Home Loan Market Revenue Share (%), by Interest Rate 2025 & 2033
- Figure 48: Asia Pacific USA Home Loan Market Revenue (billion), by Tenure 2025 & 2033
- Figure 49: Asia Pacific USA Home Loan Market Revenue Share (%), by Tenure 2025 & 2033
- Figure 50: Asia Pacific USA Home Loan Market Revenue (billion), by Country 2025 & 2033
- Figure 51: Asia Pacific USA Home Loan Market Revenue Share (%), by Country 2025 & 2033
List of Tables
- Table 1: Global USA Home Loan Market Revenue billion Forecast, by Loan Type 2020 & 2033
- Table 2: Global USA Home Loan Market Revenue billion Forecast, by Source 2020 & 2033
- Table 3: Global USA Home Loan Market Revenue billion Forecast, by Interest Rate 2020 & 2033
- Table 4: Global USA Home Loan Market Revenue billion Forecast, by Tenure 2020 & 2033
- Table 5: Global USA Home Loan Market Revenue billion Forecast, by Region 2020 & 2033
- Table 6: Global USA Home Loan Market Revenue billion Forecast, by Loan Type 2020 & 2033
- Table 7: Global USA Home Loan Market Revenue billion Forecast, by Source 2020 & 2033
- Table 8: Global USA Home Loan Market Revenue billion Forecast, by Interest Rate 2020 & 2033
- Table 9: Global USA Home Loan Market Revenue billion Forecast, by Tenure 2020 & 2033
- Table 10: Global USA Home Loan Market Revenue billion Forecast, by Country 2020 & 2033
- Table 11: United States USA Home Loan Market Revenue (billion) Forecast, by Application 2020 & 2033
- Table 12: Canada USA Home Loan Market Revenue (billion) Forecast, by Application 2020 & 2033
- Table 13: Mexico USA Home Loan Market Revenue (billion) Forecast, by Application 2020 & 2033
- Table 14: Global USA Home Loan Market Revenue billion Forecast, by Loan Type 2020 & 2033
- Table 15: Global USA Home Loan Market Revenue billion Forecast, by Source 2020 & 2033
- Table 16: Global USA Home Loan Market Revenue billion Forecast, by Interest Rate 2020 & 2033
- Table 17: Global USA Home Loan Market Revenue billion Forecast, by Tenure 2020 & 2033
- Table 18: Global USA Home Loan Market Revenue billion Forecast, by Country 2020 & 2033
- Table 19: Brazil USA Home Loan Market Revenue (billion) Forecast, by Application 2020 & 2033
- Table 20: Argentina USA Home Loan Market Revenue (billion) Forecast, by Application 2020 & 2033
- Table 21: Rest of South America USA Home Loan Market Revenue (billion) Forecast, by Application 2020 & 2033
- Table 22: Global USA Home Loan Market Revenue billion Forecast, by Loan Type 2020 & 2033
- Table 23: Global USA Home Loan Market Revenue billion Forecast, by Source 2020 & 2033
- Table 24: Global USA Home Loan Market Revenue billion Forecast, by Interest Rate 2020 & 2033
- Table 25: Global USA Home Loan Market Revenue billion Forecast, by Tenure 2020 & 2033
- Table 26: Global USA Home Loan Market Revenue billion Forecast, by Country 2020 & 2033
- Table 27: United Kingdom USA Home Loan Market Revenue (billion) Forecast, by Application 2020 & 2033
- Table 28: Germany USA Home Loan Market Revenue (billion) Forecast, by Application 2020 & 2033
- Table 29: France USA Home Loan Market Revenue (billion) Forecast, by Application 2020 & 2033
- Table 30: Italy USA Home Loan Market Revenue (billion) Forecast, by Application 2020 & 2033
- Table 31: Spain USA Home Loan Market Revenue (billion) Forecast, by Application 2020 & 2033
- Table 32: Russia USA Home Loan Market Revenue (billion) Forecast, by Application 2020 & 2033
- Table 33: Benelux USA Home Loan Market Revenue (billion) Forecast, by Application 2020 & 2033
- Table 34: Nordics USA Home Loan Market Revenue (billion) Forecast, by Application 2020 & 2033
- Table 35: Rest of Europe USA Home Loan Market Revenue (billion) Forecast, by Application 2020 & 2033
- Table 36: Global USA Home Loan Market Revenue billion Forecast, by Loan Type 2020 & 2033
- Table 37: Global USA Home Loan Market Revenue billion Forecast, by Source 2020 & 2033
- Table 38: Global USA Home Loan Market Revenue billion Forecast, by Interest Rate 2020 & 2033
- Table 39: Global USA Home Loan Market Revenue billion Forecast, by Tenure 2020 & 2033
- Table 40: Global USA Home Loan Market Revenue billion Forecast, by Country 2020 & 2033
- Table 41: Turkey USA Home Loan Market Revenue (billion) Forecast, by Application 2020 & 2033
- Table 42: Israel USA Home Loan Market Revenue (billion) Forecast, by Application 2020 & 2033
- Table 43: GCC USA Home Loan Market Revenue (billion) Forecast, by Application 2020 & 2033
- Table 44: North Africa USA Home Loan Market Revenue (billion) Forecast, by Application 2020 & 2033
- Table 45: South Africa USA Home Loan Market Revenue (billion) Forecast, by Application 2020 & 2033
- Table 46: Rest of Middle East & Africa USA Home Loan Market Revenue (billion) Forecast, by Application 2020 & 2033
- Table 47: Global USA Home Loan Market Revenue billion Forecast, by Loan Type 2020 & 2033
- Table 48: Global USA Home Loan Market Revenue billion Forecast, by Source 2020 & 2033
- Table 49: Global USA Home Loan Market Revenue billion Forecast, by Interest Rate 2020 & 2033
- Table 50: Global USA Home Loan Market Revenue billion Forecast, by Tenure 2020 & 2033
- Table 51: Global USA Home Loan Market Revenue billion Forecast, by Country 2020 & 2033
- Table 52: China USA Home Loan Market Revenue (billion) Forecast, by Application 2020 & 2033
- Table 53: India USA Home Loan Market Revenue (billion) Forecast, by Application 2020 & 2033
- Table 54: Japan USA Home Loan Market Revenue (billion) Forecast, by Application 2020 & 2033
- Table 55: South Korea USA Home Loan Market Revenue (billion) Forecast, by Application 2020 & 2033
- Table 56: ASEAN USA Home Loan Market Revenue (billion) Forecast, by Application 2020 & 2033
- Table 57: Oceania USA Home Loan Market Revenue (billion) Forecast, by Application 2020 & 2033
- Table 58: Rest of Asia Pacific USA Home Loan Market Revenue (billion) Forecast, by Application 2020 & 2033
Frequently Asked Questions
1. What is the projected Compound Annual Growth Rate (CAGR) of the USA Home Loan Market?
The projected CAGR is approximately 5.2%.
2. Which companies are prominent players in the USA Home Loan Market?
Key companies in the market include Rocket Mortgage, LoanDepot, Wells Fargo, Fairway Independent Mortgage, Bank of America, U S Bank, JPMorgan Chase, PNC Bank, Citizens Bank, United Wholesale Mortgage**List Not Exhaustive.
3. What are the main segments of the USA Home Loan Market?
The market segments include Loan Type, Source, Interest Rate, Tenure.
4. Can you provide details about the market size?
The market size is estimated to be USD 9.123 billion as of 2022.
5. What are some drivers contributing to market growth?
Increase in digitization in mortgage lending market; Increase in innovations in software designs to speed up the mortgage-application process.
6. What are the notable trends driving market growth?
Growth in Nonbank Lenders is Expected to Drive the Market.
7. Are there any restraints impacting market growth?
Increase in digitization in mortgage lending market; Increase in innovations in software designs to speed up the mortgage-application process.
8. Can you provide examples of recent developments in the market?
June 2023: Bank of America Corp has been adding consumer branches in four new U.S. states, it said on Tuesday, bringing its national footprint closer to rival JPMorgan Chase & Co. Bank of America will likely open new financial centers in Nebraska, Wisconsin, Alabama, and Louisiana as part of a four-year expansion across nine markets, including Louisville, Milwaukee, and New Orleans.
9. What pricing options are available for accessing the report?
Pricing options include single-user, multi-user, and enterprise licenses priced at USD 3800, USD 4500, and USD 5800 respectively.
10. Is the market size provided in terms of value or volume?
The market size is provided in terms of value, measured in billion.
11. Are there any specific market keywords associated with the report?
Yes, the market keyword associated with the report is "USA Home Loan Market," which aids in identifying and referencing the specific market segment covered.
12. How do I determine which pricing option suits my needs best?
The pricing options vary based on user requirements and access needs. Individual users may opt for single-user licenses, while businesses requiring broader access may choose multi-user or enterprise licenses for cost-effective access to the report.
13. Are there any additional resources or data provided in the USA Home Loan Market report?
While the report offers comprehensive insights, it's advisable to review the specific contents or supplementary materials provided to ascertain if additional resources or data are available.
14. How can I stay updated on further developments or reports in the USA Home Loan Market?
To stay informed about further developments, trends, and reports in the USA Home Loan Market, consider subscribing to industry newsletters, following relevant companies and organizations, or regularly checking reputable industry news sources and publications.
Methodology
Step 1 - Identification of Relevant Samples Size from Population Database


Step 2 - Approaches for Defining Global Market Size (Value, Volume* & Price*)

Note*: In applicable scenarios
Step 3 - Data Sources
Primary Research
- Web Analytics
- Survey Reports
- Research Institute
- Latest Research Reports
- Opinion Leaders
Secondary Research
- Annual Reports
- White Paper
- Latest Press Release
- Industry Association
- Paid Database
- Investor Presentations

Step 4 - Data Triangulation
Involves using different sources of information in order to increase the validity of a study
These sources are likely to be stakeholders in a program - participants, other researchers, program staff, other community members, and so on.
Then we put all data in single framework & apply various statistical tools to find out the dynamic on the market.
During the analysis stage, feedback from the stakeholder groups would be compared to determine areas of agreement as well as areas of divergence