

Key Insights
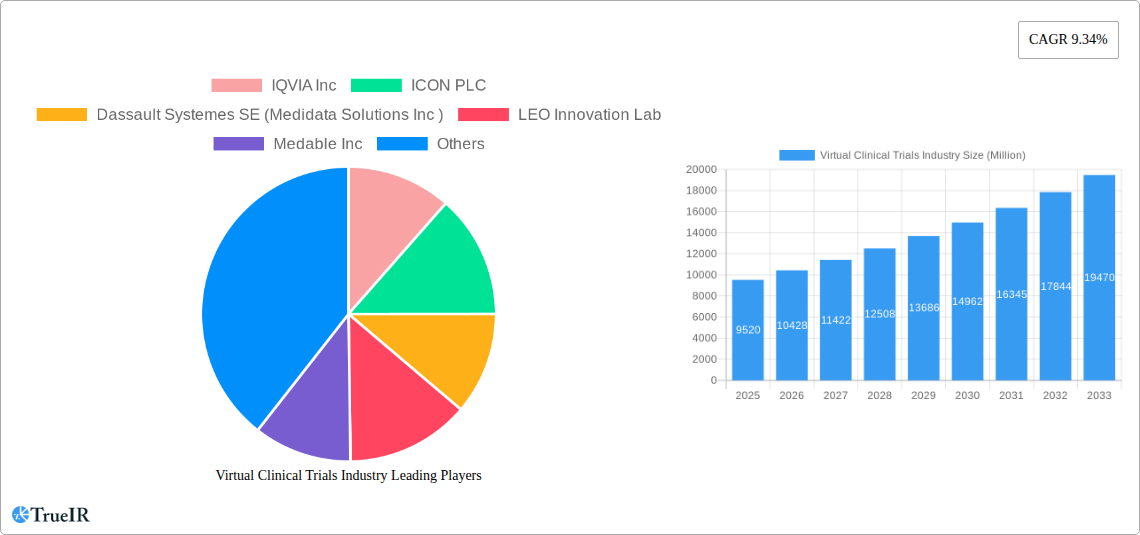
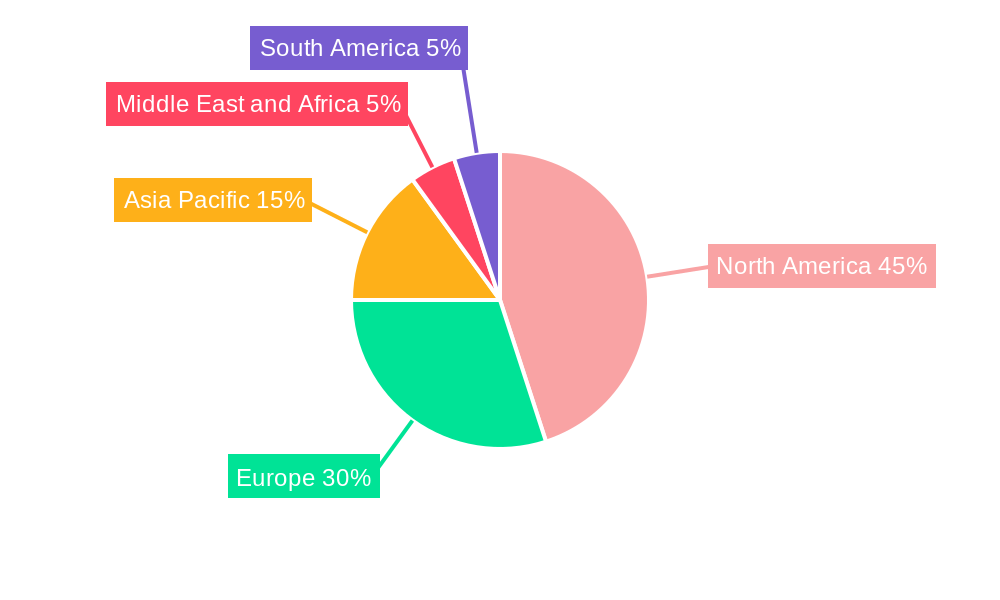
The virtual clinical trials market is experiencing robust growth, projected to reach \$9.52 billion in 2025 and exhibiting a compound annual growth rate (CAGR) of 9.34% from 2025 to 2033. This expansion is fueled by several key drivers. The increasing need for faster and more cost-effective clinical trial processes is a major catalyst. Virtual trials offer significant advantages in terms of recruitment, data collection, and overall efficiency, reducing the time and resources required for drug development. Furthermore, technological advancements, such as improved telehealth platforms, AI-powered data analysis, and wearable sensor technology, are continuously enhancing the capabilities and scope of virtual trials. The growing adoption of decentralized clinical trials (DCTs), which embrace virtual technologies to enhance patient engagement and accessibility, further contributes to market expansion. Regulatory support and favorable reimbursement policies are also encouraging the wider acceptance of this innovative approach. Market segmentation reveals a significant contribution from both interventional and observational study designs, with cardiovascular disease and oncology indicating the largest therapeutic areas. The geographical spread of market growth is notable, with North America and Europe holding substantial market shares, although the Asia-Pacific region shows significant growth potential due to its rapidly expanding healthcare infrastructure and increasing investment in pharmaceutical research.
The competitive landscape is characterized by a mix of established players and emerging technology providers. Companies like IQVIA, ICON, and Parexel, with their extensive clinical research expertise, are leveraging their existing infrastructure to offer comprehensive virtual trial solutions. Meanwhile, companies specializing in technology solutions, such as Medidata Solutions and Signant Health, contribute essential software and data management platforms. The market's future growth trajectory will likely depend on continued technological innovation, greater regulatory clarity, and a broader understanding of the benefits of virtual trials across the pharmaceutical and healthcare sectors. The efficient integration of AI and machine learning for faster data analysis and the development of more user-friendly interfaces for patients will play a crucial role in achieving greater market penetration.
Virtual Clinical Trials Industry Report: 2019-2033
This comprehensive report provides a detailed analysis of the Virtual Clinical Trials industry, projecting robust growth from $XX Million in 2025 to $XX Million by 2033, exhibiting a CAGR of XX%. The study covers the period 2019-2033, with 2025 serving as the base year and estimated year. This in-depth market analysis explores key segments, competitive dynamics, and future opportunities, equipping stakeholders with actionable insights for strategic decision-making.
Virtual Clinical Trials Industry Market Structure & Competitive Landscape
The Virtual Clinical Trials market is characterized by a moderately concentrated landscape, with key players such as IQVIA Inc, ICON PLC, Dassault Systèmes SE (Medidata Solutions Inc), and Parexel International Corporation holding significant market share. The industry’s Herfindahl-Hirschman Index (HHI) is estimated at XX in 2025, indicating a moderately consolidated market. Innovation drives competition, with companies continuously developing advanced technologies for data capture, remote monitoring, and decentralized clinical trial management. Regulatory approvals and evolving guidelines significantly influence market dynamics, creating both opportunities and challenges. Product substitutes, while limited, include traditional, in-person clinical trial methods. End-user segmentation primarily includes pharmaceutical companies, biotechnology firms, contract research organizations (CROs), and academic institutions. The market has witnessed a notable increase in mergers and acquisitions (M&A) activity, particularly in the last 5 years, with an estimated volume of XX deals exceeding $XX Million in value during the historical period (2019-2024). This consolidation reflects the growing importance of technology and expertise in virtual trial design and execution.
- Market Concentration: Moderately concentrated, with a HHI of XX in 2025.
- Innovation Drivers: Advancements in telehealth, AI, and data analytics.
- Regulatory Impacts: Stringent guidelines regarding data privacy and security.
- Product Substitutes: Traditional in-person clinical trials.
- End-User Segmentation: Pharmaceutical companies, CROs, biotech firms, academic institutions.
- M&A Trends: Significant increase in M&A activity, with XX deals exceeding $XX Million in value (2019-2024).
Virtual Clinical Trials Industry Market Trends & Opportunities
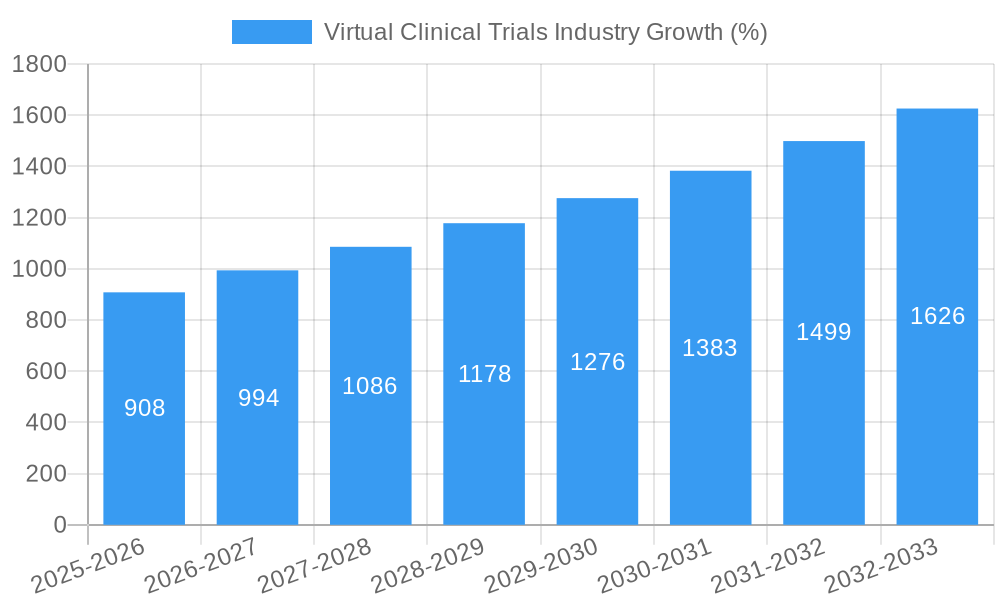
The Virtual Clinical Trials market is experiencing exponential growth, driven by several key factors. The market size is projected to increase significantly, fueled by technological advancements, increasing adoption of remote patient monitoring, and a shift towards more efficient and cost-effective clinical trial designs. The rising prevalence of chronic diseases, coupled with the need for faster drug development cycles, is further accelerating market growth. The integration of artificial intelligence (AI) and machine learning (ML) algorithms for data analysis and patient recruitment is revolutionizing the industry. Consumer preferences are shifting towards convenient and accessible healthcare options, leading to a growing demand for virtual clinical trial participation. Intense competition among market players is driving innovation and creating new opportunities. The market penetration rate of virtual clinical trials is projected to reach XX% by 2033, up from XX% in 2025. The CAGR for the forecast period (2025-2033) is estimated at XX%.
Dominant Markets & Segments in Virtual Clinical Trials Industry
North America currently dominates the Virtual Clinical Trials market, driven by robust healthcare infrastructure, advanced technological capabilities, and significant funding for research and development. However, the Asia-Pacific region is poised for significant growth in the coming years due to increasing healthcare spending and a rising prevalence of chronic diseases.
By Study Design: Interventional studies currently represent the largest segment, followed by observational and expanded access studies. Growth drivers for interventional studies include technological advancements enabling remote monitoring and data collection. Observational studies are driven by cost-effectiveness and the ability to gather real-world evidence.
By Indication Type: Oncology and cardiovascular disease indications represent major segments, fueled by high prevalence rates and significant unmet needs. The "Other Indication Types" segment shows promising growth potential. Government initiatives and increased private investments are contributing factors.
Key Growth Drivers (North America):
- Well-established healthcare infrastructure.
- Strong regulatory framework.
- High funding for R&D.
Key Growth Drivers (Asia-Pacific):
- Increasing healthcare spending.
- Rising prevalence of chronic diseases.
- Growing adoption of technology.
Virtual Clinical Trials Industry Product Analysis
Product innovations in the Virtual Clinical Trials industry are heavily focused on enhancing patient engagement, improving data quality, and streamlining trial management. This includes the development of user-friendly mobile apps for data collection, sophisticated wearable sensors for remote patient monitoring, and advanced analytics platforms for real-time data analysis. These innovations offer significant competitive advantages by enabling faster recruitment, better data quality, and reduced operational costs. The market fit for these technologies is exceptionally high given the increasing demand for efficient and cost-effective clinical trials.
Key Drivers, Barriers & Challenges in Virtual Clinical Trials Industry
Key Drivers: Technological advancements (AI, wearable sensors), rising healthcare costs driving efficiency, regulatory support for decentralized trials, increasing patient preference for remote participation.
Challenges: Data security and privacy concerns, lack of digital literacy among some patient populations, ensuring equitable access to technology across diverse populations, regulatory hurdles in different geographical regions, potential for biases in data collected remotely, maintaining patient engagement over the course of lengthy trials. The estimated financial impact of regulatory hurdles during the forecast period is $XX Million.
Growth Drivers in the Virtual Clinical Trials Industry Market
Technological advancements, including AI and machine learning, are revolutionizing data analysis and patient engagement, significantly accelerating trial completion times and reducing costs. Economic pressures are forcing the industry to seek more efficient methods, making virtual trials a compelling alternative. Favorable regulatory environments in many regions encourage the wider adoption of these technologies.
Challenges Impacting Virtual Clinical Trials Industry Growth
Regulatory complexities and varying standards across different countries represent a major hurdle. Supply chain disruptions in hardware and software components, exacerbated by global events, can impact the industry's growth. Intense competition among established players and new entrants creates pressure on pricing and margins.
Key Players Shaping the Virtual Clinical Trials Industry Market
- IQVIA Inc
- ICON PLC
- Dassault Systèmes SE (Medidata Solutions Inc)
- LEO Innovation Lab
- Medable Inc
- Parexel International Corporation
- Oracle Corporation
- Signant Health
- Clinical Ink Inc
- Medpace Holdings Inc
- Laboratory Corporation of America Holdings (Covance Inc)
Significant Virtual Clinical Trials Industry Milestones
- 2020: Increased adoption of virtual platforms driven by COVID-19 pandemic.
- 2021: FDA issues guidance on conducting virtual clinical trials.
- 2022: Several major pharmaceutical companies announce significant investments in virtual trial technologies.
- 2023: Launch of several new platforms incorporating AI and machine learning.
- 2024: Several key mergers and acquisitions reshape the competitive landscape.
Future Outlook for Virtual Clinical Trials Industry Market
The Virtual Clinical Trials market is poised for continued expansion, driven by ongoing technological advancements, increasing regulatory support, and rising demand for efficient and cost-effective clinical trials. Strategic partnerships between technology providers and pharmaceutical companies will further accelerate market growth. The market presents significant opportunities for companies specializing in data analytics, AI, and remote patient monitoring. The potential for improved patient outcomes and accelerated drug development makes this a dynamic and rapidly evolving sector.
Virtual Clinical Trials Industry Segmentation
-
1. Study Design
- 1.1. Observational
- 1.2. Intervensional
- 1.3. Expanded Access
-
2. Indication Type
- 2.1. Cardiovascular Disease
- 2.2. Oncology
- 2.3. Other Indication Types
Virtual Clinical Trials Industry Segmentation By Geography
-
1. North America
- 1.1. United States
- 1.2. Canada
- 1.3. Mexico
-
2. Europe
- 2.1. Germany
- 2.2. United Kingdom
- 2.3. France
- 2.4. Italy
- 2.5. Spain
- 2.6. Rest of Europe
-
3. Asia Pacific
- 3.1. China
- 3.2. Japan
- 3.3. India
- 3.4. Australia
- 3.5. South Korea
- 3.6. Rest of Asia Pacific
-
4. Middle East and Africa
- 4.1. GCC
- 4.2. South Africa
- 4.3. Rest of Middle East and Africa
-
5. South America
- 5.1. Brazil
- 5.2. Argentina
- 5.3. Rest of South America
Virtual Clinical Trials Industry REPORT HIGHLIGHTS
| Aspects | Details |
|---|---|
| Study Period | 2019-2033 |
| Base Year | 2024 |
| Estimated Year | 2025 |
| Forecast Period | 2025-2033 |
| Historical Period | 2019-2024 |
| Growth Rate | CAGR of 9.34% from 2019-2033 |
| Segmentation |
|
Table of Contents
- 1. Introduction
- 1.1. Research Scope
- 1.2. Market Segmentation
- 1.3. Research Methodology
- 1.4. Definitions and Assumptions
- 2. Executive Summary
- 2.1. Introduction
- 3. Market Dynamics
- 3.1. Introduction
- 3.2. Market Drivers
- 3.2.1. Growing Digitization in Healthcare Sector; Technological Advancements in Virtual Clinical Trials; Prevalence of Chronic Disease
- 3.3. Market Restrains
- 3.3.1. Challenges Associated with the Virtual Clinical Trials
- 3.4. Market Trends
- 3.4.1. The Oncology Segment is Expected to Occupy a Significant Share of the Market Over the Forecast Period
- 4. Market Factor Analysis
- 4.1. Porters Five Forces
- 4.2. Supply/Value Chain
- 4.3. PESTEL analysis
- 4.4. Market Entropy
- 4.5. Patent/Trademark Analysis
- 5. Global Virtual Clinical Trials Industry Analysis, Insights and Forecast, 2019-2031
- 5.1. Market Analysis, Insights and Forecast - by Study Design
- 5.1.1. Observational
- 5.1.2. Intervensional
- 5.1.3. Expanded Access
- 5.2. Market Analysis, Insights and Forecast - by Indication Type
- 5.2.1. Cardiovascular Disease
- 5.2.2. Oncology
- 5.2.3. Other Indication Types
- 5.3. Market Analysis, Insights and Forecast - by Region
- 5.3.1. North America
- 5.3.2. Europe
- 5.3.3. Asia Pacific
- 5.3.4. Middle East and Africa
- 5.3.5. South America
- 5.1. Market Analysis, Insights and Forecast - by Study Design
- 6. North America Virtual Clinical Trials Industry Analysis, Insights and Forecast, 2019-2031
- 6.1. Market Analysis, Insights and Forecast - by Study Design
- 6.1.1. Observational
- 6.1.2. Intervensional
- 6.1.3. Expanded Access
- 6.2. Market Analysis, Insights and Forecast - by Indication Type
- 6.2.1. Cardiovascular Disease
- 6.2.2. Oncology
- 6.2.3. Other Indication Types
- 6.1. Market Analysis, Insights and Forecast - by Study Design
- 7. Europe Virtual Clinical Trials Industry Analysis, Insights and Forecast, 2019-2031
- 7.1. Market Analysis, Insights and Forecast - by Study Design
- 7.1.1. Observational
- 7.1.2. Intervensional
- 7.1.3. Expanded Access
- 7.2. Market Analysis, Insights and Forecast - by Indication Type
- 7.2.1. Cardiovascular Disease
- 7.2.2. Oncology
- 7.2.3. Other Indication Types
- 7.1. Market Analysis, Insights and Forecast - by Study Design
- 8. Asia Pacific Virtual Clinical Trials Industry Analysis, Insights and Forecast, 2019-2031
- 8.1. Market Analysis, Insights and Forecast - by Study Design
- 8.1.1. Observational
- 8.1.2. Intervensional
- 8.1.3. Expanded Access
- 8.2. Market Analysis, Insights and Forecast - by Indication Type
- 8.2.1. Cardiovascular Disease
- 8.2.2. Oncology
- 8.2.3. Other Indication Types
- 8.1. Market Analysis, Insights and Forecast - by Study Design
- 9. Middle East and Africa Virtual Clinical Trials Industry Analysis, Insights and Forecast, 2019-2031
- 9.1. Market Analysis, Insights and Forecast - by Study Design
- 9.1.1. Observational
- 9.1.2. Intervensional
- 9.1.3. Expanded Access
- 9.2. Market Analysis, Insights and Forecast - by Indication Type
- 9.2.1. Cardiovascular Disease
- 9.2.2. Oncology
- 9.2.3. Other Indication Types
- 9.1. Market Analysis, Insights and Forecast - by Study Design
- 10. South America Virtual Clinical Trials Industry Analysis, Insights and Forecast, 2019-2031
- 10.1. Market Analysis, Insights and Forecast - by Study Design
- 10.1.1. Observational
- 10.1.2. Intervensional
- 10.1.3. Expanded Access
- 10.2. Market Analysis, Insights and Forecast - by Indication Type
- 10.2.1. Cardiovascular Disease
- 10.2.2. Oncology
- 10.2.3. Other Indication Types
- 10.1. Market Analysis, Insights and Forecast - by Study Design
- 11. North America Virtual Clinical Trials Industry Analysis, Insights and Forecast, 2019-2031
- 11.1. Market Analysis, Insights and Forecast - By Country/Sub-region
- 11.1.1 United States
- 11.1.2 Canada
- 11.1.3 Mexico
- 12. Europe Virtual Clinical Trials Industry Analysis, Insights and Forecast, 2019-2031
- 12.1. Market Analysis, Insights and Forecast - By Country/Sub-region
- 12.1.1 Germany
- 12.1.2 United Kingdom
- 12.1.3 France
- 12.1.4 Italy
- 12.1.5 Spain
- 12.1.6 Rest of Europe
- 13. Asia Pacific Virtual Clinical Trials Industry Analysis, Insights and Forecast, 2019-2031
- 13.1. Market Analysis, Insights and Forecast - By Country/Sub-region
- 13.1.1 China
- 13.1.2 Japan
- 13.1.3 India
- 13.1.4 Australia
- 13.1.5 South Korea
- 13.1.6 Rest of Asia Pacific
- 14. Middle East and Africa Virtual Clinical Trials Industry Analysis, Insights and Forecast, 2019-2031
- 14.1. Market Analysis, Insights and Forecast - By Country/Sub-region
- 14.1.1 GCC
- 14.1.2 South Africa
- 14.1.3 Rest of Middle East and Africa
- 15. South America Virtual Clinical Trials Industry Analysis, Insights and Forecast, 2019-2031
- 15.1. Market Analysis, Insights and Forecast - By Country/Sub-region
- 15.1.1 Brazil
- 15.1.2 Argentina
- 15.1.3 Rest of South America
- 16. Competitive Analysis
- 16.1. Global Market Share Analysis 2024
- 16.2. Company Profiles
- 16.2.1 IQVIA Inc
- 16.2.1.1. Overview
- 16.2.1.2. Products
- 16.2.1.3. SWOT Analysis
- 16.2.1.4. Recent Developments
- 16.2.1.5. Financials (Based on Availability)
- 16.2.2 ICON PLC
- 16.2.2.1. Overview
- 16.2.2.2. Products
- 16.2.2.3. SWOT Analysis
- 16.2.2.4. Recent Developments
- 16.2.2.5. Financials (Based on Availability)
- 16.2.3 Dassault Systemes SE (Medidata Solutions Inc )
- 16.2.3.1. Overview
- 16.2.3.2. Products
- 16.2.3.3. SWOT Analysis
- 16.2.3.4. Recent Developments
- 16.2.3.5. Financials (Based on Availability)
- 16.2.4 LEO Innovation Lab
- 16.2.4.1. Overview
- 16.2.4.2. Products
- 16.2.4.3. SWOT Analysis
- 16.2.4.4. Recent Developments
- 16.2.4.5. Financials (Based on Availability)
- 16.2.5 Medable Inc
- 16.2.5.1. Overview
- 16.2.5.2. Products
- 16.2.5.3. SWOT Analysis
- 16.2.5.4. Recent Developments
- 16.2.5.5. Financials (Based on Availability)
- 16.2.6 Parexel International Corporation
- 16.2.6.1. Overview
- 16.2.6.2. Products
- 16.2.6.3. SWOT Analysis
- 16.2.6.4. Recent Developments
- 16.2.6.5. Financials (Based on Availability)
- 16.2.7 Oracle Corporation
- 16.2.7.1. Overview
- 16.2.7.2. Products
- 16.2.7.3. SWOT Analysis
- 16.2.7.4. Recent Developments
- 16.2.7.5. Financials (Based on Availability)
- 16.2.8 Signant Health
- 16.2.8.1. Overview
- 16.2.8.2. Products
- 16.2.8.3. SWOT Analysis
- 16.2.8.4. Recent Developments
- 16.2.8.5. Financials (Based on Availability)
- 16.2.9 Clinical Ink Inc
- 16.2.9.1. Overview
- 16.2.9.2. Products
- 16.2.9.3. SWOT Analysis
- 16.2.9.4. Recent Developments
- 16.2.9.5. Financials (Based on Availability)
- 16.2.10 Medpace Holdings Inc
- 16.2.10.1. Overview
- 16.2.10.2. Products
- 16.2.10.3. SWOT Analysis
- 16.2.10.4. Recent Developments
- 16.2.10.5. Financials (Based on Availability)
- 16.2.11 Laboratory Corporation of America Holdings (Covance Inc )
- 16.2.11.1. Overview
- 16.2.11.2. Products
- 16.2.11.3. SWOT Analysis
- 16.2.11.4. Recent Developments
- 16.2.11.5. Financials (Based on Availability)
- 16.2.1 IQVIA Inc
List of Figures
- Figure 1: Global Virtual Clinical Trials Industry Revenue Breakdown (Million, %) by Region 2024 & 2032
- Figure 2: North America Virtual Clinical Trials Industry Revenue (Million), by Country 2024 & 2032
- Figure 3: North America Virtual Clinical Trials Industry Revenue Share (%), by Country 2024 & 2032
- Figure 4: Europe Virtual Clinical Trials Industry Revenue (Million), by Country 2024 & 2032
- Figure 5: Europe Virtual Clinical Trials Industry Revenue Share (%), by Country 2024 & 2032
- Figure 6: Asia Pacific Virtual Clinical Trials Industry Revenue (Million), by Country 2024 & 2032
- Figure 7: Asia Pacific Virtual Clinical Trials Industry Revenue Share (%), by Country 2024 & 2032
- Figure 8: Middle East and Africa Virtual Clinical Trials Industry Revenue (Million), by Country 2024 & 2032
- Figure 9: Middle East and Africa Virtual Clinical Trials Industry Revenue Share (%), by Country 2024 & 2032
- Figure 10: South America Virtual Clinical Trials Industry Revenue (Million), by Country 2024 & 2032
- Figure 11: South America Virtual Clinical Trials Industry Revenue Share (%), by Country 2024 & 2032
- Figure 12: North America Virtual Clinical Trials Industry Revenue (Million), by Study Design 2024 & 2032
- Figure 13: North America Virtual Clinical Trials Industry Revenue Share (%), by Study Design 2024 & 2032
- Figure 14: North America Virtual Clinical Trials Industry Revenue (Million), by Indication Type 2024 & 2032
- Figure 15: North America Virtual Clinical Trials Industry Revenue Share (%), by Indication Type 2024 & 2032
- Figure 16: North America Virtual Clinical Trials Industry Revenue (Million), by Country 2024 & 2032
- Figure 17: North America Virtual Clinical Trials Industry Revenue Share (%), by Country 2024 & 2032
- Figure 18: Europe Virtual Clinical Trials Industry Revenue (Million), by Study Design 2024 & 2032
- Figure 19: Europe Virtual Clinical Trials Industry Revenue Share (%), by Study Design 2024 & 2032
- Figure 20: Europe Virtual Clinical Trials Industry Revenue (Million), by Indication Type 2024 & 2032
- Figure 21: Europe Virtual Clinical Trials Industry Revenue Share (%), by Indication Type 2024 & 2032
- Figure 22: Europe Virtual Clinical Trials Industry Revenue (Million), by Country 2024 & 2032
- Figure 23: Europe Virtual Clinical Trials Industry Revenue Share (%), by Country 2024 & 2032
- Figure 24: Asia Pacific Virtual Clinical Trials Industry Revenue (Million), by Study Design 2024 & 2032
- Figure 25: Asia Pacific Virtual Clinical Trials Industry Revenue Share (%), by Study Design 2024 & 2032
- Figure 26: Asia Pacific Virtual Clinical Trials Industry Revenue (Million), by Indication Type 2024 & 2032
- Figure 27: Asia Pacific Virtual Clinical Trials Industry Revenue Share (%), by Indication Type 2024 & 2032
- Figure 28: Asia Pacific Virtual Clinical Trials Industry Revenue (Million), by Country 2024 & 2032
- Figure 29: Asia Pacific Virtual Clinical Trials Industry Revenue Share (%), by Country 2024 & 2032
- Figure 30: Middle East and Africa Virtual Clinical Trials Industry Revenue (Million), by Study Design 2024 & 2032
- Figure 31: Middle East and Africa Virtual Clinical Trials Industry Revenue Share (%), by Study Design 2024 & 2032
- Figure 32: Middle East and Africa Virtual Clinical Trials Industry Revenue (Million), by Indication Type 2024 & 2032
- Figure 33: Middle East and Africa Virtual Clinical Trials Industry Revenue Share (%), by Indication Type 2024 & 2032
- Figure 34: Middle East and Africa Virtual Clinical Trials Industry Revenue (Million), by Country 2024 & 2032
- Figure 35: Middle East and Africa Virtual Clinical Trials Industry Revenue Share (%), by Country 2024 & 2032
- Figure 36: South America Virtual Clinical Trials Industry Revenue (Million), by Study Design 2024 & 2032
- Figure 37: South America Virtual Clinical Trials Industry Revenue Share (%), by Study Design 2024 & 2032
- Figure 38: South America Virtual Clinical Trials Industry Revenue (Million), by Indication Type 2024 & 2032
- Figure 39: South America Virtual Clinical Trials Industry Revenue Share (%), by Indication Type 2024 & 2032
- Figure 40: South America Virtual Clinical Trials Industry Revenue (Million), by Country 2024 & 2032
- Figure 41: South America Virtual Clinical Trials Industry Revenue Share (%), by Country 2024 & 2032
List of Tables
- Table 1: Global Virtual Clinical Trials Industry Revenue Million Forecast, by Region 2019 & 2032
- Table 2: Global Virtual Clinical Trials Industry Revenue Million Forecast, by Study Design 2019 & 2032
- Table 3: Global Virtual Clinical Trials Industry Revenue Million Forecast, by Indication Type 2019 & 2032
- Table 4: Global Virtual Clinical Trials Industry Revenue Million Forecast, by Region 2019 & 2032
- Table 5: Global Virtual Clinical Trials Industry Revenue Million Forecast, by Country 2019 & 2032
- Table 6: United States Virtual Clinical Trials Industry Revenue (Million) Forecast, by Application 2019 & 2032
- Table 7: Canada Virtual Clinical Trials Industry Revenue (Million) Forecast, by Application 2019 & 2032
- Table 8: Mexico Virtual Clinical Trials Industry Revenue (Million) Forecast, by Application 2019 & 2032
- Table 9: Global Virtual Clinical Trials Industry Revenue Million Forecast, by Country 2019 & 2032
- Table 10: Germany Virtual Clinical Trials Industry Revenue (Million) Forecast, by Application 2019 & 2032
- Table 11: United Kingdom Virtual Clinical Trials Industry Revenue (Million) Forecast, by Application 2019 & 2032
- Table 12: France Virtual Clinical Trials Industry Revenue (Million) Forecast, by Application 2019 & 2032
- Table 13: Italy Virtual Clinical Trials Industry Revenue (Million) Forecast, by Application 2019 & 2032
- Table 14: Spain Virtual Clinical Trials Industry Revenue (Million) Forecast, by Application 2019 & 2032
- Table 15: Rest of Europe Virtual Clinical Trials Industry Revenue (Million) Forecast, by Application 2019 & 2032
- Table 16: Global Virtual Clinical Trials Industry Revenue Million Forecast, by Country 2019 & 2032
- Table 17: China Virtual Clinical Trials Industry Revenue (Million) Forecast, by Application 2019 & 2032
- Table 18: Japan Virtual Clinical Trials Industry Revenue (Million) Forecast, by Application 2019 & 2032
- Table 19: India Virtual Clinical Trials Industry Revenue (Million) Forecast, by Application 2019 & 2032
- Table 20: Australia Virtual Clinical Trials Industry Revenue (Million) Forecast, by Application 2019 & 2032
- Table 21: South Korea Virtual Clinical Trials Industry Revenue (Million) Forecast, by Application 2019 & 2032
- Table 22: Rest of Asia Pacific Virtual Clinical Trials Industry Revenue (Million) Forecast, by Application 2019 & 2032
- Table 23: Global Virtual Clinical Trials Industry Revenue Million Forecast, by Country 2019 & 2032
- Table 24: GCC Virtual Clinical Trials Industry Revenue (Million) Forecast, by Application 2019 & 2032
- Table 25: South Africa Virtual Clinical Trials Industry Revenue (Million) Forecast, by Application 2019 & 2032
- Table 26: Rest of Middle East and Africa Virtual Clinical Trials Industry Revenue (Million) Forecast, by Application 2019 & 2032
- Table 27: Global Virtual Clinical Trials Industry Revenue Million Forecast, by Country 2019 & 2032
- Table 28: Brazil Virtual Clinical Trials Industry Revenue (Million) Forecast, by Application 2019 & 2032
- Table 29: Argentina Virtual Clinical Trials Industry Revenue (Million) Forecast, by Application 2019 & 2032
- Table 30: Rest of South America Virtual Clinical Trials Industry Revenue (Million) Forecast, by Application 2019 & 2032
- Table 31: Global Virtual Clinical Trials Industry Revenue Million Forecast, by Study Design 2019 & 2032
- Table 32: Global Virtual Clinical Trials Industry Revenue Million Forecast, by Indication Type 2019 & 2032
- Table 33: Global Virtual Clinical Trials Industry Revenue Million Forecast, by Country 2019 & 2032
- Table 34: United States Virtual Clinical Trials Industry Revenue (Million) Forecast, by Application 2019 & 2032
- Table 35: Canada Virtual Clinical Trials Industry Revenue (Million) Forecast, by Application 2019 & 2032
- Table 36: Mexico Virtual Clinical Trials Industry Revenue (Million) Forecast, by Application 2019 & 2032
- Table 37: Global Virtual Clinical Trials Industry Revenue Million Forecast, by Study Design 2019 & 2032
- Table 38: Global Virtual Clinical Trials Industry Revenue Million Forecast, by Indication Type 2019 & 2032
- Table 39: Global Virtual Clinical Trials Industry Revenue Million Forecast, by Country 2019 & 2032
- Table 40: Germany Virtual Clinical Trials Industry Revenue (Million) Forecast, by Application 2019 & 2032
- Table 41: United Kingdom Virtual Clinical Trials Industry Revenue (Million) Forecast, by Application 2019 & 2032
- Table 42: France Virtual Clinical Trials Industry Revenue (Million) Forecast, by Application 2019 & 2032
- Table 43: Italy Virtual Clinical Trials Industry Revenue (Million) Forecast, by Application 2019 & 2032
- Table 44: Spain Virtual Clinical Trials Industry Revenue (Million) Forecast, by Application 2019 & 2032
- Table 45: Rest of Europe Virtual Clinical Trials Industry Revenue (Million) Forecast, by Application 2019 & 2032
- Table 46: Global Virtual Clinical Trials Industry Revenue Million Forecast, by Study Design 2019 & 2032
- Table 47: Global Virtual Clinical Trials Industry Revenue Million Forecast, by Indication Type 2019 & 2032
- Table 48: Global Virtual Clinical Trials Industry Revenue Million Forecast, by Country 2019 & 2032
- Table 49: China Virtual Clinical Trials Industry Revenue (Million) Forecast, by Application 2019 & 2032
- Table 50: Japan Virtual Clinical Trials Industry Revenue (Million) Forecast, by Application 2019 & 2032
- Table 51: India Virtual Clinical Trials Industry Revenue (Million) Forecast, by Application 2019 & 2032
- Table 52: Australia Virtual Clinical Trials Industry Revenue (Million) Forecast, by Application 2019 & 2032
- Table 53: South Korea Virtual Clinical Trials Industry Revenue (Million) Forecast, by Application 2019 & 2032
- Table 54: Rest of Asia Pacific Virtual Clinical Trials Industry Revenue (Million) Forecast, by Application 2019 & 2032
- Table 55: Global Virtual Clinical Trials Industry Revenue Million Forecast, by Study Design 2019 & 2032
- Table 56: Global Virtual Clinical Trials Industry Revenue Million Forecast, by Indication Type 2019 & 2032
- Table 57: Global Virtual Clinical Trials Industry Revenue Million Forecast, by Country 2019 & 2032
- Table 58: GCC Virtual Clinical Trials Industry Revenue (Million) Forecast, by Application 2019 & 2032
- Table 59: South Africa Virtual Clinical Trials Industry Revenue (Million) Forecast, by Application 2019 & 2032
- Table 60: Rest of Middle East and Africa Virtual Clinical Trials Industry Revenue (Million) Forecast, by Application 2019 & 2032
- Table 61: Global Virtual Clinical Trials Industry Revenue Million Forecast, by Study Design 2019 & 2032
- Table 62: Global Virtual Clinical Trials Industry Revenue Million Forecast, by Indication Type 2019 & 2032
- Table 63: Global Virtual Clinical Trials Industry Revenue Million Forecast, by Country 2019 & 2032
- Table 64: Brazil Virtual Clinical Trials Industry Revenue (Million) Forecast, by Application 2019 & 2032
- Table 65: Argentina Virtual Clinical Trials Industry Revenue (Million) Forecast, by Application 2019 & 2032
- Table 66: Rest of South America Virtual Clinical Trials Industry Revenue (Million) Forecast, by Application 2019 & 2032
Frequently Asked Questions
1. What is the projected Compound Annual Growth Rate (CAGR) of the Virtual Clinical Trials Industry?
The projected CAGR is approximately 9.34%.
2. Which companies are prominent players in the Virtual Clinical Trials Industry?
Key companies in the market include IQVIA Inc, ICON PLC, Dassault Systemes SE (Medidata Solutions Inc ), LEO Innovation Lab, Medable Inc, Parexel International Corporation, Oracle Corporation, Signant Health, Clinical Ink Inc, Medpace Holdings Inc, Laboratory Corporation of America Holdings (Covance Inc ).
3. What are the main segments of the Virtual Clinical Trials Industry?
The market segments include Study Design, Indication Type.
4. Can you provide details about the market size?
The market size is estimated to be USD 9.52 Million as of 2022.
5. What are some drivers contributing to market growth?
Growing Digitization in Healthcare Sector; Technological Advancements in Virtual Clinical Trials; Prevalence of Chronic Disease.
6. What are the notable trends driving market growth?
The Oncology Segment is Expected to Occupy a Significant Share of the Market Over the Forecast Period.
7. Are there any restraints impacting market growth?
Challenges Associated with the Virtual Clinical Trials.
8. Can you provide examples of recent developments in the market?
N/A
9. What pricing options are available for accessing the report?
Pricing options include single-user, multi-user, and enterprise licenses priced at USD 4750, USD 5250, and USD 8750 respectively.
10. Is the market size provided in terms of value or volume?
The market size is provided in terms of value, measured in Million.
11. Are there any specific market keywords associated with the report?
Yes, the market keyword associated with the report is "Virtual Clinical Trials Industry," which aids in identifying and referencing the specific market segment covered.
12. How do I determine which pricing option suits my needs best?
The pricing options vary based on user requirements and access needs. Individual users may opt for single-user licenses, while businesses requiring broader access may choose multi-user or enterprise licenses for cost-effective access to the report.
13. Are there any additional resources or data provided in the Virtual Clinical Trials Industry report?
While the report offers comprehensive insights, it's advisable to review the specific contents or supplementary materials provided to ascertain if additional resources or data are available.
14. How can I stay updated on further developments or reports in the Virtual Clinical Trials Industry?
To stay informed about further developments, trends, and reports in the Virtual Clinical Trials Industry, consider subscribing to industry newsletters, following relevant companies and organizations, or regularly checking reputable industry news sources and publications.
Methodology
Step 1 - Identification of Relevant Samples Size from Population Database


Step 2 - Approaches for Defining Global Market Size (Value, Volume* & Price*)

Note*: In applicable scenarios
Step 3 - Data Sources
Primary Research
- Web Analytics
- Survey Reports
- Research Institute
- Latest Research Reports
- Opinion Leaders
Secondary Research
- Annual Reports
- White Paper
- Latest Press Release
- Industry Association
- Paid Database
- Investor Presentations

Step 4 - Data Triangulation
Involves using different sources of information in order to increase the validity of a study
These sources are likely to be stakeholders in a program - participants, other researchers, program staff, other community members, and so on.
Then we put all data in single framework & apply various statistical tools to find out the dynamic on the market.
During the analysis stage, feedback from the stakeholder groups would be compared to determine areas of agreement as well as areas of divergence
