
Key Insights
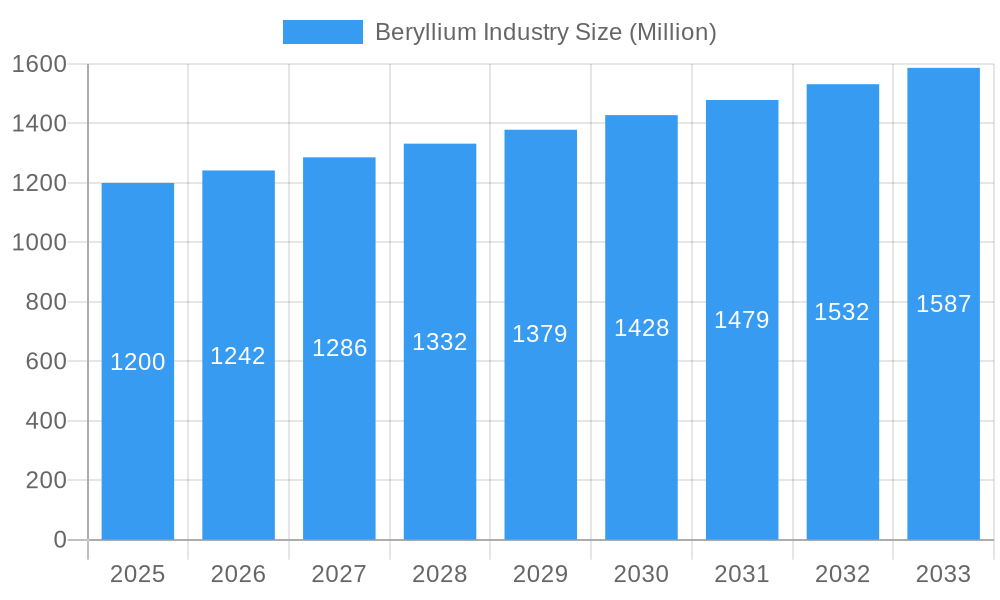
The beryllium market, valued at approximately $1.2 billion in 2025, is projected to experience steady growth, driven by increasing demand across diverse sectors. A compound annual growth rate (CAGR) of 3.5% from 2025 to 2033 indicates a substantial expansion to nearly $1.8 billion by 2033. Key growth drivers include the rising adoption of beryllium in high-performance applications within the aerospace and defense industries (driven by lightweighting needs in aircraft and missile systems), the burgeoning electronics and telecommunication sectors (utilizing beryllium's unique electrical properties in advanced devices), and the expanding medical technology sector (leveraging its biocompatibility in certain medical instruments). The automotive industry is also a significant contributor, particularly in high-end vehicles where weight reduction and durability are crucial. While the market faces some restraints, such as the inherent toxicity of beryllium requiring stringent safety protocols and the high cost of extraction and processing, the overall growth trajectory remains positive. Segmentation reveals a robust demand for beryllium alloys, followed by metals and ceramics, with industrial components and automotive sectors leading in end-user consumption. Geographical distribution shows significant market share held by North America and Asia-Pacific, reflecting the concentration of major beryllium producers and key end-use industries within these regions.

Beryllium Industry Market Size (In Billion)
The competitive landscape includes both established players, like Materion Corporation and NGK Metals, and emerging companies, contributing to innovation and market diversification. Future growth will likely be influenced by advancements in beryllium extraction and processing techniques to reduce costs and enhance sustainability. Furthermore, the development of new beryllium-based alloys with improved properties and broader applications is expected to fuel market expansion. Government regulations concerning beryllium handling and disposal will continue to shape industry practices and potentially impact market dynamics. The ongoing push towards lighter, more efficient, and durable materials across several industrial segments supports a persistently positive outlook for the beryllium market throughout the forecast period.
Beryllium Industry Company Market Share
Beryllium Industry Market Report: 2019-2033
This comprehensive report provides an in-depth analysis of the global beryllium industry, encompassing market size, segmentation, competitive landscape, and future growth prospects from 2019 to 2033. The report leverages extensive research to provide actionable insights for stakeholders across the beryllium value chain. With a base year of 2025 and a forecast period of 2025-2033, this report is an essential resource for understanding the current market dynamics and predicting future trends. The total market value is estimated to reach xx Million by 2033.
Beryllium Industry Market Structure & Competitive Landscape
The global beryllium market exhibits a moderately concentrated structure, with a few major players holding significant market share. American Elements, Materion Corporation, NGK Metals, and IBC Advanced Alloys are among the leading companies, while regional players like Xiamen Beryllium Copper Technologies Co Ltd and Hunan Shuikoushan Nonferrous Metals Group Co Ltd also contribute significantly. The Herfindahl-Hirschman Index (HHI) is estimated at xx, indicating a moderately concentrated market.
Innovation Drivers: The industry is driven by ongoing research and development into advanced beryllium alloys and composites, particularly for aerospace and defense applications.
Regulatory Impacts: Stringent environmental regulations regarding beryllium extraction and processing pose challenges, impacting production costs and operational efficiency. The industry faces scrutiny regarding worker safety due to beryllium's toxicity.
Product Substitutes: The lack of readily available substitutes for beryllium in high-performance applications limits the competitive pressure from substitute materials. However, advancements in alternative materials are gradually emerging.
End-User Segmentation: The market is segmented into Industrial Components, Automotive, Healthcare, Aerospace & Defense, Oil & Gas, Electronics & Telecommunications, and Other End-user Industries. Aerospace & Defense currently dominates, but growth is expected in electronics and renewable energy sectors.
M&A Trends: The past five years have seen xx Million in M&A activity, with a focus on consolidating production capacity and expanding into new applications.
Beryllium Industry Market Trends & Opportunities
The global beryllium market is projected to experience a CAGR of xx% during the forecast period (2025-2033), driven by increasing demand from various end-use sectors. The market size is expected to reach xx Million by 2033. Technological advancements in alloy formulations, leading to improved strength, lightweight, and thermal properties, are significantly impacting market growth.
Consumer preferences are shifting towards high-performance materials with enhanced durability and reliability, further fueling the demand for beryllium products. The competitive landscape is becoming increasingly dynamic, with companies focusing on strategic partnerships, R&D investments, and expansion into new geographic markets to secure market share. Market penetration rates for beryllium in various sectors, such as electric vehicles and 5G infrastructure, are expected to increase considerably. Further research into sustainable extraction and processing methods presents significant opportunities for environmentally conscious companies.
Dominant Markets & Segments in Beryllium Industry
The aerospace and defense segment currently dominates the beryllium market, accounting for approximately xx% of the global demand, driven by its unique properties critical for high-performance applications in aircraft and missile systems. The North American region holds a leading position due to a strong aerospace & defense industry and the presence of major beryllium producers like Materion Corporation.
Key Growth Drivers:
- Aerospace & Defense: High demand for lightweight, high-strength materials in aircraft and missile systems.
- Electronics: Growing use in high-frequency applications like smartphones and 5G infrastructure.
- Nuclear Energy: Increased interest in advanced nuclear reactors increases demand for beryllium in reactor components.
- Government Policies: Government initiatives promoting the development of advanced materials in key industries.
Market Dominance Analysis: North America holds a significant market share due to the established presence of major manufacturers and strong demand from the aerospace & defense sector. However, Asia-Pacific is projected to witness substantial growth over the forecast period, driven by increasing industrialization and infrastructure development.
Beryllium Industry Product Analysis
Beryllium's unique properties—high strength-to-weight ratio, high stiffness, excellent thermal conductivity, and low density—make it indispensable in high-performance applications. Technological advancements focus on developing advanced alloys with improved formability and machinability, broadening its usability in diverse sectors. The market is primarily segmented into alloys, metals, and ceramics, with alloys dominating due to their versatility and suitability for various applications. Ongoing research is exploring novel beryllium composites for enhanced performance characteristics.
Key Drivers, Barriers & Challenges in Beryllium Industry
Key Drivers:
- The growing demand for lightweight and high-strength materials in the aerospace and defense sectors is a major driver of growth.
- Technological advancements leading to improved properties of beryllium alloys are expanding its applications.
- Government investments in research and development of advanced materials further propel market growth.
Challenges and Restraints:
- Beryllium's toxicity poses significant health and safety concerns throughout the supply chain, requiring stringent safety protocols and increasing operational costs.
- The relatively high price of beryllium compared to alternative materials restricts its use in some applications.
- The limited availability of beryllium resources can potentially constrain supply and hinder market growth. xx Million in potential production losses are estimated due to supply chain disruptions.
Growth Drivers in the Beryllium Industry Market
The increasing demand for high-performance materials in the aerospace and defense, automotive, and electronics industries is a key driver. Advancements in materials science are leading to the development of new beryllium alloys with improved properties, while government support for R&D and environmental regulations are promoting the use of sustainable manufacturing processes.
Challenges Impacting Beryllium Industry Growth
The toxicity of beryllium necessitates strict safety regulations, increasing production costs. Supply chain vulnerabilities and limited beryllium resources present potential constraints on production. The high price of beryllium compared to alternatives creates challenges in expanding its market share in price-sensitive applications.
Key Players Shaping the Beryllium Industry Market
- American Elements
- Xiamen Beryllium Copper Technologies Co Ltd
- NGK Metals
- Hunan Shuikoushan Nonferrous Metals Group Co Ltd
- Texas Mineral Resources Corp
- Belmont Metals
- Tropag Oscar H Ritter Nachf GmbH
- National Atomic Company Kazatomprom
- IBC Advanced Alloys
- Materion Corporation
- American Beryllia Inc
Significant Beryllium Industry Milestones
- July 2022: Materion Corporation and Kairos Power jointly commissioned a Molten Salt Purification Plant (MSPP) for Flibe production, solidifying Materion's position as a key supplier in the emerging nuclear energy sector.
- April 2022: IBC Advanced Alloys launched copper alloy casting at its expanded Indiana facility, significantly boosting production capacity and solidifying its position in the beryllium-copper alloy market.
Future Outlook for Beryllium Industry Market
The beryllium industry is poised for sustained growth, driven by increasing demand in high-growth sectors like aerospace, electronics, and renewable energy. Strategic partnerships and R&D initiatives aimed at developing innovative applications and improving production efficiency will be key to capturing future market opportunities. The market will continue to benefit from technological advancements leading to enhanced performance characteristics and broader use in various applications, with a substantial increase in market value predicted within the next decade.
Beryllium Industry Segmentation
-
1. Product Type
- 1.1. Alloys
- 1.2. Metals
- 1.3. Ceramics
- 1.4. Other Product Types
-
2. End-user Industry
- 2.1. Industrial Components
- 2.2. Automotive
- 2.3. Healthcare
- 2.4. Aerospace and Defense
- 2.5. Oil and Gas
- 2.6. Electronics and Telecommunication
- 2.7. Other End-user Industries
Beryllium Industry Segmentation By Geography
-
1. Asia Pacific
- 1.1. China
- 1.2. India
- 1.3. Japan
- 1.4. South Korea
- 1.5. Malaysia
- 1.6. Thailand
- 1.7. Indonesia
- 1.8. Vietnam
- 1.9. Rest of Asia Pacific
-
2. North America
- 2.1. United States
- 2.2. Canada
- 2.3. Mexico
-
3. Europe
- 3.1. Germany
- 3.2. United Kingdom
- 3.3. France
- 3.4. Italy
- 3.5. Spain
- 3.6. NORDIC Countries
- 3.7. Turkey
- 3.8. Russia
- 3.9. Rest of Europe
-
4. South America
- 4.1. Brazil
- 4.2. Argentina
- 4.3. Colombia
- 4.4. Rest of South America
-
5. Middle East and Africa
- 5.1. Saudi Arabia
- 5.2. Qatar
- 5.3. United Arab Emirates
- 5.4. Nigeria
- 5.5. Egypt
- 5.6. South Africa
- 5.7. Rest of Middle East and Africa

Beryllium Industry Regional Market Share
Geographic Coverage of Beryllium Industry
Beryllium Industry REPORT HIGHLIGHTS
| Aspects | Details |
|---|---|
| Study Period | 2020-2034 |
| Base Year | 2025 |
| Estimated Year | 2026 |
| Forecast Period | 2026-2034 |
| Historical Period | 2020-2025 |
| Growth Rate | CAGR of 3.50% from 2020-2034 |
| Segmentation |
|
Table of Contents
- 1. Introduction
- 1.1. Research Scope
- 1.2. Market Segmentation
- 1.3. Research Methodology
- 1.4. Definitions and Assumptions
- 2. Executive Summary
- 2.1. Introduction
- 3. Market Dynamics
- 3.1. Introduction
- 3.2. Market Drivers
- 3.2.1. Extensive Usage of Beryllium Alloys in Aerospace and Military Applications; Increasing Usage in Medical Equipment Owing to its Superior Properties
- 3.3. Market Restrains
- 3.3.1. Competition from Potential Alternatives
- 3.4. Market Trends
- 3.4.1. Automotive Segment to Drive the Market Growth
- 4. Market Factor Analysis
- 4.1. Porters Five Forces
- 4.2. Supply/Value Chain
- 4.3. PESTEL analysis
- 4.4. Market Entropy
- 4.5. Patent/Trademark Analysis
- 5. Global Beryllium Industry Analysis, Insights and Forecast, 2020-2032
- 5.1. Market Analysis, Insights and Forecast - by Product Type
- 5.1.1. Alloys
- 5.1.2. Metals
- 5.1.3. Ceramics
- 5.1.4. Other Product Types
- 5.2. Market Analysis, Insights and Forecast - by End-user Industry
- 5.2.1. Industrial Components
- 5.2.2. Automotive
- 5.2.3. Healthcare
- 5.2.4. Aerospace and Defense
- 5.2.5. Oil and Gas
- 5.2.6. Electronics and Telecommunication
- 5.2.7. Other End-user Industries
- 5.3. Market Analysis, Insights and Forecast - by Region
- 5.3.1. Asia Pacific
- 5.3.2. North America
- 5.3.3. Europe
- 5.3.4. South America
- 5.3.5. Middle East and Africa
- 5.1. Market Analysis, Insights and Forecast - by Product Type
- 6. Asia Pacific Beryllium Industry Analysis, Insights and Forecast, 2020-2032
- 6.1. Market Analysis, Insights and Forecast - by Product Type
- 6.1.1. Alloys
- 6.1.2. Metals
- 6.1.3. Ceramics
- 6.1.4. Other Product Types
- 6.2. Market Analysis, Insights and Forecast - by End-user Industry
- 6.2.1. Industrial Components
- 6.2.2. Automotive
- 6.2.3. Healthcare
- 6.2.4. Aerospace and Defense
- 6.2.5. Oil and Gas
- 6.2.6. Electronics and Telecommunication
- 6.2.7. Other End-user Industries
- 6.1. Market Analysis, Insights and Forecast - by Product Type
- 7. North America Beryllium Industry Analysis, Insights and Forecast, 2020-2032
- 7.1. Market Analysis, Insights and Forecast - by Product Type
- 7.1.1. Alloys
- 7.1.2. Metals
- 7.1.3. Ceramics
- 7.1.4. Other Product Types
- 7.2. Market Analysis, Insights and Forecast - by End-user Industry
- 7.2.1. Industrial Components
- 7.2.2. Automotive
- 7.2.3. Healthcare
- 7.2.4. Aerospace and Defense
- 7.2.5. Oil and Gas
- 7.2.6. Electronics and Telecommunication
- 7.2.7. Other End-user Industries
- 7.1. Market Analysis, Insights and Forecast - by Product Type
- 8. Europe Beryllium Industry Analysis, Insights and Forecast, 2020-2032
- 8.1. Market Analysis, Insights and Forecast - by Product Type
- 8.1.1. Alloys
- 8.1.2. Metals
- 8.1.3. Ceramics
- 8.1.4. Other Product Types
- 8.2. Market Analysis, Insights and Forecast - by End-user Industry
- 8.2.1. Industrial Components
- 8.2.2. Automotive
- 8.2.3. Healthcare
- 8.2.4. Aerospace and Defense
- 8.2.5. Oil and Gas
- 8.2.6. Electronics and Telecommunication
- 8.2.7. Other End-user Industries
- 8.1. Market Analysis, Insights and Forecast - by Product Type
- 9. South America Beryllium Industry Analysis, Insights and Forecast, 2020-2032
- 9.1. Market Analysis, Insights and Forecast - by Product Type
- 9.1.1. Alloys
- 9.1.2. Metals
- 9.1.3. Ceramics
- 9.1.4. Other Product Types
- 9.2. Market Analysis, Insights and Forecast - by End-user Industry
- 9.2.1. Industrial Components
- 9.2.2. Automotive
- 9.2.3. Healthcare
- 9.2.4. Aerospace and Defense
- 9.2.5. Oil and Gas
- 9.2.6. Electronics and Telecommunication
- 9.2.7. Other End-user Industries
- 9.1. Market Analysis, Insights and Forecast - by Product Type
- 10. Middle East and Africa Beryllium Industry Analysis, Insights and Forecast, 2020-2032
- 10.1. Market Analysis, Insights and Forecast - by Product Type
- 10.1.1. Alloys
- 10.1.2. Metals
- 10.1.3. Ceramics
- 10.1.4. Other Product Types
- 10.2. Market Analysis, Insights and Forecast - by End-user Industry
- 10.2.1. Industrial Components
- 10.2.2. Automotive
- 10.2.3. Healthcare
- 10.2.4. Aerospace and Defense
- 10.2.5. Oil and Gas
- 10.2.6. Electronics and Telecommunication
- 10.2.7. Other End-user Industries
- 10.1. Market Analysis, Insights and Forecast - by Product Type
- 11. North America Beryllium Industry Analysis, Insights and Forecast, 2020-2032
- 11.1. Market Analysis, Insights and Forecast - By Country/Sub-region
- 11.1.1 United States
- 11.1.2 Canada
- 11.1.3 Mexico
- 12. Europe Beryllium Industry Analysis, Insights and Forecast, 2020-2032
- 12.1. Market Analysis, Insights and Forecast - By Country/Sub-region
- 12.1.1 Germany
- 12.1.2 France
- 12.1.3 Italy
- 12.1.4 United Kingdom
- 12.1.5 Netherlands
- 12.1.6 Rest of Europe
- 13. Asia Pacific Beryllium Industry Analysis, Insights and Forecast, 2020-2032
- 13.1. Market Analysis, Insights and Forecast - By Country/Sub-region
- 13.1.1 China
- 13.1.2 Japan
- 13.1.3 India
- 13.1.4 South Korea
- 13.1.5 Taiwan
- 13.1.6 Australia
- 13.1.7 Rest of Asia-Pacific
- 14. South America Beryllium Industry Analysis, Insights and Forecast, 2020-2032
- 14.1. Market Analysis, Insights and Forecast - By Country/Sub-region
- 14.1.1 Brazil
- 14.1.2 Argentina
- 14.1.3 Rest of South America
- 15. MEA Beryllium Industry Analysis, Insights and Forecast, 2020-2032
- 15.1. Market Analysis, Insights and Forecast - By Country/Sub-region
- 15.1.1 Middle East
- 15.1.2 Africa
- 16. Competitive Analysis
- 16.1. Global Market Share Analysis 2025
- 16.2. Company Profiles
- 16.2.1 American Elements
- 16.2.1.1. Overview
- 16.2.1.2. Products
- 16.2.1.3. SWOT Analysis
- 16.2.1.4. Recent Developments
- 16.2.1.5. Financials (Based on Availability)
- 16.2.2 Xiamen Beryllium Copper Technologies Co Ltd
- 16.2.2.1. Overview
- 16.2.2.2. Products
- 16.2.2.3. SWOT Analysis
- 16.2.2.4. Recent Developments
- 16.2.2.5. Financials (Based on Availability)
- 16.2.3 NGK Metals
- 16.2.3.1. Overview
- 16.2.3.2. Products
- 16.2.3.3. SWOT Analysis
- 16.2.3.4. Recent Developments
- 16.2.3.5. Financials (Based on Availability)
- 16.2.4 Hunan Shuikoushan Nonferrous Metals Group Co Ltd
- 16.2.4.1. Overview
- 16.2.4.2. Products
- 16.2.4.3. SWOT Analysis
- 16.2.4.4. Recent Developments
- 16.2.4.5. Financials (Based on Availability)
- 16.2.5 Texas Mineral Resources Corp
- 16.2.5.1. Overview
- 16.2.5.2. Products
- 16.2.5.3. SWOT Analysis
- 16.2.5.4. Recent Developments
- 16.2.5.5. Financials (Based on Availability)
- 16.2.6 Belmont Metals
- 16.2.6.1. Overview
- 16.2.6.2. Products
- 16.2.6.3. SWOT Analysis
- 16.2.6.4. Recent Developments
- 16.2.6.5. Financials (Based on Availability)
- 16.2.7 Tropag Oscar H Ritter Nachf GmbH
- 16.2.7.1. Overview
- 16.2.7.2. Products
- 16.2.7.3. SWOT Analysis
- 16.2.7.4. Recent Developments
- 16.2.7.5. Financials (Based on Availability)
- 16.2.8 National Atomic Company Kazatomprom
- 16.2.8.1. Overview
- 16.2.8.2. Products
- 16.2.8.3. SWOT Analysis
- 16.2.8.4. Recent Developments
- 16.2.8.5. Financials (Based on Availability)
- 16.2.9 IBC Advanced Alloys
- 16.2.9.1. Overview
- 16.2.9.2. Products
- 16.2.9.3. SWOT Analysis
- 16.2.9.4. Recent Developments
- 16.2.9.5. Financials (Based on Availability)
- 16.2.10 Materion Corporation
- 16.2.10.1. Overview
- 16.2.10.2. Products
- 16.2.10.3. SWOT Analysis
- 16.2.10.4. Recent Developments
- 16.2.10.5. Financials (Based on Availability)
- 16.2.11 American Beryllia Inc
- 16.2.11.1. Overview
- 16.2.11.2. Products
- 16.2.11.3. SWOT Analysis
- 16.2.11.4. Recent Developments
- 16.2.11.5. Financials (Based on Availability)
- 16.2.1 American Elements
List of Figures
- Figure 1: Global Beryllium Industry Revenue Breakdown (Million, %) by Region 2025 & 2033
- Figure 2: Global Beryllium Industry Volume Breakdown (K Tons, %) by Region 2025 & 2033
- Figure 3: North America Beryllium Industry Revenue (Million), by Country 2025 & 2033
- Figure 4: North America Beryllium Industry Volume (K Tons), by Country 2025 & 2033
- Figure 5: North America Beryllium Industry Revenue Share (%), by Country 2025 & 2033
- Figure 6: North America Beryllium Industry Volume Share (%), by Country 2025 & 2033
- Figure 7: Europe Beryllium Industry Revenue (Million), by Country 2025 & 2033
- Figure 8: Europe Beryllium Industry Volume (K Tons), by Country 2025 & 2033
- Figure 9: Europe Beryllium Industry Revenue Share (%), by Country 2025 & 2033
- Figure 10: Europe Beryllium Industry Volume Share (%), by Country 2025 & 2033
- Figure 11: Asia Pacific Beryllium Industry Revenue (Million), by Country 2025 & 2033
- Figure 12: Asia Pacific Beryllium Industry Volume (K Tons), by Country 2025 & 2033
- Figure 13: Asia Pacific Beryllium Industry Revenue Share (%), by Country 2025 & 2033
- Figure 14: Asia Pacific Beryllium Industry Volume Share (%), by Country 2025 & 2033
- Figure 15: South America Beryllium Industry Revenue (Million), by Country 2025 & 2033
- Figure 16: South America Beryllium Industry Volume (K Tons), by Country 2025 & 2033
- Figure 17: South America Beryllium Industry Revenue Share (%), by Country 2025 & 2033
- Figure 18: South America Beryllium Industry Volume Share (%), by Country 2025 & 2033
- Figure 19: MEA Beryllium Industry Revenue (Million), by Country 2025 & 2033
- Figure 20: MEA Beryllium Industry Volume (K Tons), by Country 2025 & 2033
- Figure 21: MEA Beryllium Industry Revenue Share (%), by Country 2025 & 2033
- Figure 22: MEA Beryllium Industry Volume Share (%), by Country 2025 & 2033
- Figure 23: Asia Pacific Beryllium Industry Revenue (Million), by Product Type 2025 & 2033
- Figure 24: Asia Pacific Beryllium Industry Volume (K Tons), by Product Type 2025 & 2033
- Figure 25: Asia Pacific Beryllium Industry Revenue Share (%), by Product Type 2025 & 2033
- Figure 26: Asia Pacific Beryllium Industry Volume Share (%), by Product Type 2025 & 2033
- Figure 27: Asia Pacific Beryllium Industry Revenue (Million), by End-user Industry 2025 & 2033
- Figure 28: Asia Pacific Beryllium Industry Volume (K Tons), by End-user Industry 2025 & 2033
- Figure 29: Asia Pacific Beryllium Industry Revenue Share (%), by End-user Industry 2025 & 2033
- Figure 30: Asia Pacific Beryllium Industry Volume Share (%), by End-user Industry 2025 & 2033
- Figure 31: Asia Pacific Beryllium Industry Revenue (Million), by Country 2025 & 2033
- Figure 32: Asia Pacific Beryllium Industry Volume (K Tons), by Country 2025 & 2033
- Figure 33: Asia Pacific Beryllium Industry Revenue Share (%), by Country 2025 & 2033
- Figure 34: Asia Pacific Beryllium Industry Volume Share (%), by Country 2025 & 2033
- Figure 35: North America Beryllium Industry Revenue (Million), by Product Type 2025 & 2033
- Figure 36: North America Beryllium Industry Volume (K Tons), by Product Type 2025 & 2033
- Figure 37: North America Beryllium Industry Revenue Share (%), by Product Type 2025 & 2033
- Figure 38: North America Beryllium Industry Volume Share (%), by Product Type 2025 & 2033
- Figure 39: North America Beryllium Industry Revenue (Million), by End-user Industry 2025 & 2033
- Figure 40: North America Beryllium Industry Volume (K Tons), by End-user Industry 2025 & 2033
- Figure 41: North America Beryllium Industry Revenue Share (%), by End-user Industry 2025 & 2033
- Figure 42: North America Beryllium Industry Volume Share (%), by End-user Industry 2025 & 2033
- Figure 43: North America Beryllium Industry Revenue (Million), by Country 2025 & 2033
- Figure 44: North America Beryllium Industry Volume (K Tons), by Country 2025 & 2033
- Figure 45: North America Beryllium Industry Revenue Share (%), by Country 2025 & 2033
- Figure 46: North America Beryllium Industry Volume Share (%), by Country 2025 & 2033
- Figure 47: Europe Beryllium Industry Revenue (Million), by Product Type 2025 & 2033
- Figure 48: Europe Beryllium Industry Volume (K Tons), by Product Type 2025 & 2033
- Figure 49: Europe Beryllium Industry Revenue Share (%), by Product Type 2025 & 2033
- Figure 50: Europe Beryllium Industry Volume Share (%), by Product Type 2025 & 2033
- Figure 51: Europe Beryllium Industry Revenue (Million), by End-user Industry 2025 & 2033
- Figure 52: Europe Beryllium Industry Volume (K Tons), by End-user Industry 2025 & 2033
- Figure 53: Europe Beryllium Industry Revenue Share (%), by End-user Industry 2025 & 2033
- Figure 54: Europe Beryllium Industry Volume Share (%), by End-user Industry 2025 & 2033
- Figure 55: Europe Beryllium Industry Revenue (Million), by Country 2025 & 2033
- Figure 56: Europe Beryllium Industry Volume (K Tons), by Country 2025 & 2033
- Figure 57: Europe Beryllium Industry Revenue Share (%), by Country 2025 & 2033
- Figure 58: Europe Beryllium Industry Volume Share (%), by Country 2025 & 2033
- Figure 59: South America Beryllium Industry Revenue (Million), by Product Type 2025 & 2033
- Figure 60: South America Beryllium Industry Volume (K Tons), by Product Type 2025 & 2033
- Figure 61: South America Beryllium Industry Revenue Share (%), by Product Type 2025 & 2033
- Figure 62: South America Beryllium Industry Volume Share (%), by Product Type 2025 & 2033
- Figure 63: South America Beryllium Industry Revenue (Million), by End-user Industry 2025 & 2033
- Figure 64: South America Beryllium Industry Volume (K Tons), by End-user Industry 2025 & 2033
- Figure 65: South America Beryllium Industry Revenue Share (%), by End-user Industry 2025 & 2033
- Figure 66: South America Beryllium Industry Volume Share (%), by End-user Industry 2025 & 2033
- Figure 67: South America Beryllium Industry Revenue (Million), by Country 2025 & 2033
- Figure 68: South America Beryllium Industry Volume (K Tons), by Country 2025 & 2033
- Figure 69: South America Beryllium Industry Revenue Share (%), by Country 2025 & 2033
- Figure 70: South America Beryllium Industry Volume Share (%), by Country 2025 & 2033
- Figure 71: Middle East and Africa Beryllium Industry Revenue (Million), by Product Type 2025 & 2033
- Figure 72: Middle East and Africa Beryllium Industry Volume (K Tons), by Product Type 2025 & 2033
- Figure 73: Middle East and Africa Beryllium Industry Revenue Share (%), by Product Type 2025 & 2033
- Figure 74: Middle East and Africa Beryllium Industry Volume Share (%), by Product Type 2025 & 2033
- Figure 75: Middle East and Africa Beryllium Industry Revenue (Million), by End-user Industry 2025 & 2033
- Figure 76: Middle East and Africa Beryllium Industry Volume (K Tons), by End-user Industry 2025 & 2033
- Figure 77: Middle East and Africa Beryllium Industry Revenue Share (%), by End-user Industry 2025 & 2033
- Figure 78: Middle East and Africa Beryllium Industry Volume Share (%), by End-user Industry 2025 & 2033
- Figure 79: Middle East and Africa Beryllium Industry Revenue (Million), by Country 2025 & 2033
- Figure 80: Middle East and Africa Beryllium Industry Volume (K Tons), by Country 2025 & 2033
- Figure 81: Middle East and Africa Beryllium Industry Revenue Share (%), by Country 2025 & 2033
- Figure 82: Middle East and Africa Beryllium Industry Volume Share (%), by Country 2025 & 2033
List of Tables
- Table 1: Global Beryllium Industry Revenue Million Forecast, by Region 2020 & 2033
- Table 2: Global Beryllium Industry Volume K Tons Forecast, by Region 2020 & 2033
- Table 3: Global Beryllium Industry Revenue Million Forecast, by Product Type 2020 & 2033
- Table 4: Global Beryllium Industry Volume K Tons Forecast, by Product Type 2020 & 2033
- Table 5: Global Beryllium Industry Revenue Million Forecast, by End-user Industry 2020 & 2033
- Table 6: Global Beryllium Industry Volume K Tons Forecast, by End-user Industry 2020 & 2033
- Table 7: Global Beryllium Industry Revenue Million Forecast, by Region 2020 & 2033
- Table 8: Global Beryllium Industry Volume K Tons Forecast, by Region 2020 & 2033
- Table 9: Global Beryllium Industry Revenue Million Forecast, by Country 2020 & 2033
- Table 10: Global Beryllium Industry Volume K Tons Forecast, by Country 2020 & 2033
- Table 11: United States Beryllium Industry Revenue (Million) Forecast, by Application 2020 & 2033
- Table 12: United States Beryllium Industry Volume (K Tons) Forecast, by Application 2020 & 2033
- Table 13: Canada Beryllium Industry Revenue (Million) Forecast, by Application 2020 & 2033
- Table 14: Canada Beryllium Industry Volume (K Tons) Forecast, by Application 2020 & 2033
- Table 15: Mexico Beryllium Industry Revenue (Million) Forecast, by Application 2020 & 2033
- Table 16: Mexico Beryllium Industry Volume (K Tons) Forecast, by Application 2020 & 2033
- Table 17: Global Beryllium Industry Revenue Million Forecast, by Country 2020 & 2033
- Table 18: Global Beryllium Industry Volume K Tons Forecast, by Country 2020 & 2033
- Table 19: Germany Beryllium Industry Revenue (Million) Forecast, by Application 2020 & 2033
- Table 20: Germany Beryllium Industry Volume (K Tons) Forecast, by Application 2020 & 2033
- Table 21: France Beryllium Industry Revenue (Million) Forecast, by Application 2020 & 2033
- Table 22: France Beryllium Industry Volume (K Tons) Forecast, by Application 2020 & 2033
- Table 23: Italy Beryllium Industry Revenue (Million) Forecast, by Application 2020 & 2033
- Table 24: Italy Beryllium Industry Volume (K Tons) Forecast, by Application 2020 & 2033
- Table 25: United Kingdom Beryllium Industry Revenue (Million) Forecast, by Application 2020 & 2033
- Table 26: United Kingdom Beryllium Industry Volume (K Tons) Forecast, by Application 2020 & 2033
- Table 27: Netherlands Beryllium Industry Revenue (Million) Forecast, by Application 2020 & 2033
- Table 28: Netherlands Beryllium Industry Volume (K Tons) Forecast, by Application 2020 & 2033
- Table 29: Rest of Europe Beryllium Industry Revenue (Million) Forecast, by Application 2020 & 2033
- Table 30: Rest of Europe Beryllium Industry Volume (K Tons) Forecast, by Application 2020 & 2033
- Table 31: Global Beryllium Industry Revenue Million Forecast, by Country 2020 & 2033
- Table 32: Global Beryllium Industry Volume K Tons Forecast, by Country 2020 & 2033
- Table 33: China Beryllium Industry Revenue (Million) Forecast, by Application 2020 & 2033
- Table 34: China Beryllium Industry Volume (K Tons) Forecast, by Application 2020 & 2033
- Table 35: Japan Beryllium Industry Revenue (Million) Forecast, by Application 2020 & 2033
- Table 36: Japan Beryllium Industry Volume (K Tons) Forecast, by Application 2020 & 2033
- Table 37: India Beryllium Industry Revenue (Million) Forecast, by Application 2020 & 2033
- Table 38: India Beryllium Industry Volume (K Tons) Forecast, by Application 2020 & 2033
- Table 39: South Korea Beryllium Industry Revenue (Million) Forecast, by Application 2020 & 2033
- Table 40: South Korea Beryllium Industry Volume (K Tons) Forecast, by Application 2020 & 2033
- Table 41: Taiwan Beryllium Industry Revenue (Million) Forecast, by Application 2020 & 2033
- Table 42: Taiwan Beryllium Industry Volume (K Tons) Forecast, by Application 2020 & 2033
- Table 43: Australia Beryllium Industry Revenue (Million) Forecast, by Application 2020 & 2033
- Table 44: Australia Beryllium Industry Volume (K Tons) Forecast, by Application 2020 & 2033
- Table 45: Rest of Asia-Pacific Beryllium Industry Revenue (Million) Forecast, by Application 2020 & 2033
- Table 46: Rest of Asia-Pacific Beryllium Industry Volume (K Tons) Forecast, by Application 2020 & 2033
- Table 47: Global Beryllium Industry Revenue Million Forecast, by Country 2020 & 2033
- Table 48: Global Beryllium Industry Volume K Tons Forecast, by Country 2020 & 2033
- Table 49: Brazil Beryllium Industry Revenue (Million) Forecast, by Application 2020 & 2033
- Table 50: Brazil Beryllium Industry Volume (K Tons) Forecast, by Application 2020 & 2033
- Table 51: Argentina Beryllium Industry Revenue (Million) Forecast, by Application 2020 & 2033
- Table 52: Argentina Beryllium Industry Volume (K Tons) Forecast, by Application 2020 & 2033
- Table 53: Rest of South America Beryllium Industry Revenue (Million) Forecast, by Application 2020 & 2033
- Table 54: Rest of South America Beryllium Industry Volume (K Tons) Forecast, by Application 2020 & 2033
- Table 55: Global Beryllium Industry Revenue Million Forecast, by Country 2020 & 2033
- Table 56: Global Beryllium Industry Volume K Tons Forecast, by Country 2020 & 2033
- Table 57: Middle East Beryllium Industry Revenue (Million) Forecast, by Application 2020 & 2033
- Table 58: Middle East Beryllium Industry Volume (K Tons) Forecast, by Application 2020 & 2033
- Table 59: Africa Beryllium Industry Revenue (Million) Forecast, by Application 2020 & 2033
- Table 60: Africa Beryllium Industry Volume (K Tons) Forecast, by Application 2020 & 2033
- Table 61: Global Beryllium Industry Revenue Million Forecast, by Product Type 2020 & 2033
- Table 62: Global Beryllium Industry Volume K Tons Forecast, by Product Type 2020 & 2033
- Table 63: Global Beryllium Industry Revenue Million Forecast, by End-user Industry 2020 & 2033
- Table 64: Global Beryllium Industry Volume K Tons Forecast, by End-user Industry 2020 & 2033
- Table 65: Global Beryllium Industry Revenue Million Forecast, by Country 2020 & 2033
- Table 66: Global Beryllium Industry Volume K Tons Forecast, by Country 2020 & 2033
- Table 67: China Beryllium Industry Revenue (Million) Forecast, by Application 2020 & 2033
- Table 68: China Beryllium Industry Volume (K Tons) Forecast, by Application 2020 & 2033
- Table 69: India Beryllium Industry Revenue (Million) Forecast, by Application 2020 & 2033
- Table 70: India Beryllium Industry Volume (K Tons) Forecast, by Application 2020 & 2033
- Table 71: Japan Beryllium Industry Revenue (Million) Forecast, by Application 2020 & 2033
- Table 72: Japan Beryllium Industry Volume (K Tons) Forecast, by Application 2020 & 2033
- Table 73: South Korea Beryllium Industry Revenue (Million) Forecast, by Application 2020 & 2033
- Table 74: South Korea Beryllium Industry Volume (K Tons) Forecast, by Application 2020 & 2033
- Table 75: Malaysia Beryllium Industry Revenue (Million) Forecast, by Application 2020 & 2033
- Table 76: Malaysia Beryllium Industry Volume (K Tons) Forecast, by Application 2020 & 2033
- Table 77: Thailand Beryllium Industry Revenue (Million) Forecast, by Application 2020 & 2033
- Table 78: Thailand Beryllium Industry Volume (K Tons) Forecast, by Application 2020 & 2033
- Table 79: Indonesia Beryllium Industry Revenue (Million) Forecast, by Application 2020 & 2033
- Table 80: Indonesia Beryllium Industry Volume (K Tons) Forecast, by Application 2020 & 2033
- Table 81: Vietnam Beryllium Industry Revenue (Million) Forecast, by Application 2020 & 2033
- Table 82: Vietnam Beryllium Industry Volume (K Tons) Forecast, by Application 2020 & 2033
- Table 83: Rest of Asia Pacific Beryllium Industry Revenue (Million) Forecast, by Application 2020 & 2033
- Table 84: Rest of Asia Pacific Beryllium Industry Volume (K Tons) Forecast, by Application 2020 & 2033
- Table 85: Global Beryllium Industry Revenue Million Forecast, by Product Type 2020 & 2033
- Table 86: Global Beryllium Industry Volume K Tons Forecast, by Product Type 2020 & 2033
- Table 87: Global Beryllium Industry Revenue Million Forecast, by End-user Industry 2020 & 2033
- Table 88: Global Beryllium Industry Volume K Tons Forecast, by End-user Industry 2020 & 2033
- Table 89: Global Beryllium Industry Revenue Million Forecast, by Country 2020 & 2033
- Table 90: Global Beryllium Industry Volume K Tons Forecast, by Country 2020 & 2033
- Table 91: United States Beryllium Industry Revenue (Million) Forecast, by Application 2020 & 2033
- Table 92: United States Beryllium Industry Volume (K Tons) Forecast, by Application 2020 & 2033
- Table 93: Canada Beryllium Industry Revenue (Million) Forecast, by Application 2020 & 2033
- Table 94: Canada Beryllium Industry Volume (K Tons) Forecast, by Application 2020 & 2033
- Table 95: Mexico Beryllium Industry Revenue (Million) Forecast, by Application 2020 & 2033
- Table 96: Mexico Beryllium Industry Volume (K Tons) Forecast, by Application 2020 & 2033
- Table 97: Global Beryllium Industry Revenue Million Forecast, by Product Type 2020 & 2033
- Table 98: Global Beryllium Industry Volume K Tons Forecast, by Product Type 2020 & 2033
- Table 99: Global Beryllium Industry Revenue Million Forecast, by End-user Industry 2020 & 2033
- Table 100: Global Beryllium Industry Volume K Tons Forecast, by End-user Industry 2020 & 2033
- Table 101: Global Beryllium Industry Revenue Million Forecast, by Country 2020 & 2033
- Table 102: Global Beryllium Industry Volume K Tons Forecast, by Country 2020 & 2033
- Table 103: Germany Beryllium Industry Revenue (Million) Forecast, by Application 2020 & 2033
- Table 104: Germany Beryllium Industry Volume (K Tons) Forecast, by Application 2020 & 2033
- Table 105: United Kingdom Beryllium Industry Revenue (Million) Forecast, by Application 2020 & 2033
- Table 106: United Kingdom Beryllium Industry Volume (K Tons) Forecast, by Application 2020 & 2033
- Table 107: France Beryllium Industry Revenue (Million) Forecast, by Application 2020 & 2033
- Table 108: France Beryllium Industry Volume (K Tons) Forecast, by Application 2020 & 2033
- Table 109: Italy Beryllium Industry Revenue (Million) Forecast, by Application 2020 & 2033
- Table 110: Italy Beryllium Industry Volume (K Tons) Forecast, by Application 2020 & 2033
- Table 111: Spain Beryllium Industry Revenue (Million) Forecast, by Application 2020 & 2033
- Table 112: Spain Beryllium Industry Volume (K Tons) Forecast, by Application 2020 & 2033
- Table 113: NORDIC Countries Beryllium Industry Revenue (Million) Forecast, by Application 2020 & 2033
- Table 114: NORDIC Countries Beryllium Industry Volume (K Tons) Forecast, by Application 2020 & 2033
- Table 115: Turkey Beryllium Industry Revenue (Million) Forecast, by Application 2020 & 2033
- Table 116: Turkey Beryllium Industry Volume (K Tons) Forecast, by Application 2020 & 2033
- Table 117: Russia Beryllium Industry Revenue (Million) Forecast, by Application 2020 & 2033
- Table 118: Russia Beryllium Industry Volume (K Tons) Forecast, by Application 2020 & 2033
- Table 119: Rest of Europe Beryllium Industry Revenue (Million) Forecast, by Application 2020 & 2033
- Table 120: Rest of Europe Beryllium Industry Volume (K Tons) Forecast, by Application 2020 & 2033
- Table 121: Global Beryllium Industry Revenue Million Forecast, by Product Type 2020 & 2033
- Table 122: Global Beryllium Industry Volume K Tons Forecast, by Product Type 2020 & 2033
- Table 123: Global Beryllium Industry Revenue Million Forecast, by End-user Industry 2020 & 2033
- Table 124: Global Beryllium Industry Volume K Tons Forecast, by End-user Industry 2020 & 2033
- Table 125: Global Beryllium Industry Revenue Million Forecast, by Country 2020 & 2033
- Table 126: Global Beryllium Industry Volume K Tons Forecast, by Country 2020 & 2033
- Table 127: Brazil Beryllium Industry Revenue (Million) Forecast, by Application 2020 & 2033
- Table 128: Brazil Beryllium Industry Volume (K Tons) Forecast, by Application 2020 & 2033
- Table 129: Argentina Beryllium Industry Revenue (Million) Forecast, by Application 2020 & 2033
- Table 130: Argentina Beryllium Industry Volume (K Tons) Forecast, by Application 2020 & 2033
- Table 131: Colombia Beryllium Industry Revenue (Million) Forecast, by Application 2020 & 2033
- Table 132: Colombia Beryllium Industry Volume (K Tons) Forecast, by Application 2020 & 2033
- Table 133: Rest of South America Beryllium Industry Revenue (Million) Forecast, by Application 2020 & 2033
- Table 134: Rest of South America Beryllium Industry Volume (K Tons) Forecast, by Application 2020 & 2033
- Table 135: Global Beryllium Industry Revenue Million Forecast, by Product Type 2020 & 2033
- Table 136: Global Beryllium Industry Volume K Tons Forecast, by Product Type 2020 & 2033
- Table 137: Global Beryllium Industry Revenue Million Forecast, by End-user Industry 2020 & 2033
- Table 138: Global Beryllium Industry Volume K Tons Forecast, by End-user Industry 2020 & 2033
- Table 139: Global Beryllium Industry Revenue Million Forecast, by Country 2020 & 2033
- Table 140: Global Beryllium Industry Volume K Tons Forecast, by Country 2020 & 2033
- Table 141: Saudi Arabia Beryllium Industry Revenue (Million) Forecast, by Application 2020 & 2033
- Table 142: Saudi Arabia Beryllium Industry Volume (K Tons) Forecast, by Application 2020 & 2033
- Table 143: Qatar Beryllium Industry Revenue (Million) Forecast, by Application 2020 & 2033
- Table 144: Qatar Beryllium Industry Volume (K Tons) Forecast, by Application 2020 & 2033
- Table 145: United Arab Emirates Beryllium Industry Revenue (Million) Forecast, by Application 2020 & 2033
- Table 146: United Arab Emirates Beryllium Industry Volume (K Tons) Forecast, by Application 2020 & 2033
- Table 147: Nigeria Beryllium Industry Revenue (Million) Forecast, by Application 2020 & 2033
- Table 148: Nigeria Beryllium Industry Volume (K Tons) Forecast, by Application 2020 & 2033
- Table 149: Egypt Beryllium Industry Revenue (Million) Forecast, by Application 2020 & 2033
- Table 150: Egypt Beryllium Industry Volume (K Tons) Forecast, by Application 2020 & 2033
- Table 151: South Africa Beryllium Industry Revenue (Million) Forecast, by Application 2020 & 2033
- Table 152: South Africa Beryllium Industry Volume (K Tons) Forecast, by Application 2020 & 2033
- Table 153: Rest of Middle East and Africa Beryllium Industry Revenue (Million) Forecast, by Application 2020 & 2033
- Table 154: Rest of Middle East and Africa Beryllium Industry Volume (K Tons) Forecast, by Application 2020 & 2033
Frequently Asked Questions
1. What is the projected Compound Annual Growth Rate (CAGR) of the Beryllium Industry?
The projected CAGR is approximately 3.50%.
2. Which companies are prominent players in the Beryllium Industry?
Key companies in the market include American Elements, Xiamen Beryllium Copper Technologies Co Ltd , NGK Metals, Hunan Shuikoushan Nonferrous Metals Group Co Ltd, Texas Mineral Resources Corp, Belmont Metals, Tropag Oscar H Ritter Nachf GmbH, National Atomic Company Kazatomprom, IBC Advanced Alloys, Materion Corporation, American Beryllia Inc.
3. What are the main segments of the Beryllium Industry?
The market segments include Product Type, End-user Industry.
4. Can you provide details about the market size?
The market size is estimated to be USD XX Million as of 2022.
5. What are some drivers contributing to market growth?
Extensive Usage of Beryllium Alloys in Aerospace and Military Applications; Increasing Usage in Medical Equipment Owing to its Superior Properties.
6. What are the notable trends driving market growth?
Automotive Segment to Drive the Market Growth.
7. Are there any restraints impacting market growth?
Competition from Potential Alternatives.
8. Can you provide examples of recent developments in the market?
July 2022: Materion Corporation jointly commissioned a Molten Salt Purification Plant (MSPP) with Kairos Power at Materion's location in Elmore, Ohio, for the commercial production of Flibe, a molten salt coolant used in nuclear energy production. Materion is the only domestic supplier of the beryllium fluoride component for Flibe, a key component of this energy solution.
9. What pricing options are available for accessing the report?
Pricing options include single-user, multi-user, and enterprise licenses priced at USD 4750, USD 5250, and USD 8750 respectively.
10. Is the market size provided in terms of value or volume?
The market size is provided in terms of value, measured in Million and volume, measured in K Tons.
11. Are there any specific market keywords associated with the report?
Yes, the market keyword associated with the report is "Beryllium Industry," which aids in identifying and referencing the specific market segment covered.
12. How do I determine which pricing option suits my needs best?
The pricing options vary based on user requirements and access needs. Individual users may opt for single-user licenses, while businesses requiring broader access may choose multi-user or enterprise licenses for cost-effective access to the report.
13. Are there any additional resources or data provided in the Beryllium Industry report?
While the report offers comprehensive insights, it's advisable to review the specific contents or supplementary materials provided to ascertain if additional resources or data are available.
14. How can I stay updated on further developments or reports in the Beryllium Industry?
To stay informed about further developments, trends, and reports in the Beryllium Industry, consider subscribing to industry newsletters, following relevant companies and organizations, or regularly checking reputable industry news sources and publications.
Methodology
Step 1 - Identification of Relevant Samples Size from Population Database


Step 2 - Approaches for Defining Global Market Size (Value, Volume* & Price*)

Note*: In applicable scenarios
Step 3 - Data Sources
Primary Research
- Web Analytics
- Survey Reports
- Research Institute
- Latest Research Reports
- Opinion Leaders
Secondary Research
- Annual Reports
- White Paper
- Latest Press Release
- Industry Association
- Paid Database
- Investor Presentations

Step 4 - Data Triangulation
Involves using different sources of information in order to increase the validity of a study
These sources are likely to be stakeholders in a program - participants, other researchers, program staff, other community members, and so on.
Then we put all data in single framework & apply various statistical tools to find out the dynamic on the market.
During the analysis stage, feedback from the stakeholder groups would be compared to determine areas of agreement as well as areas of divergence
