

Key Insights
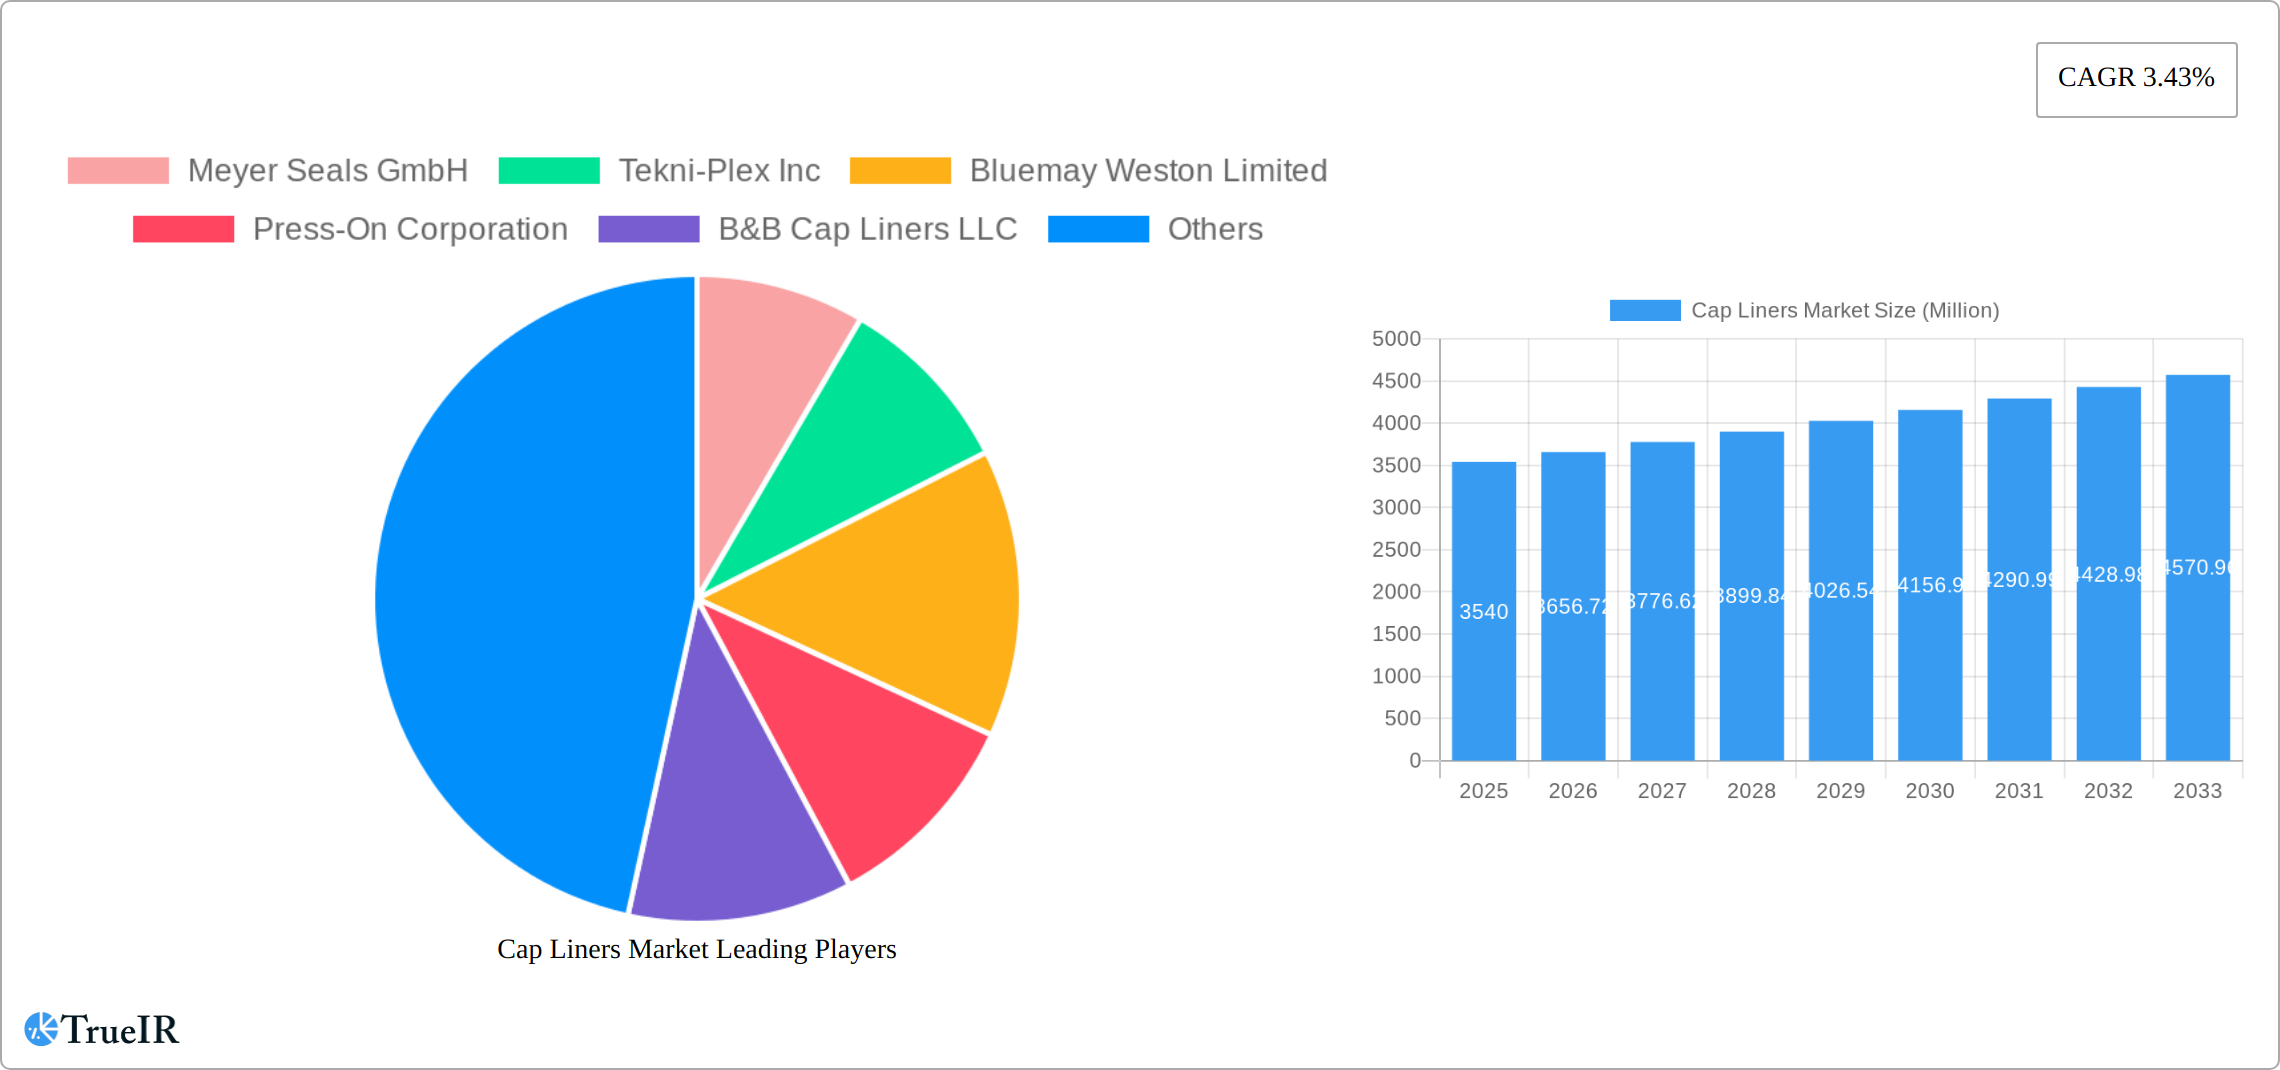
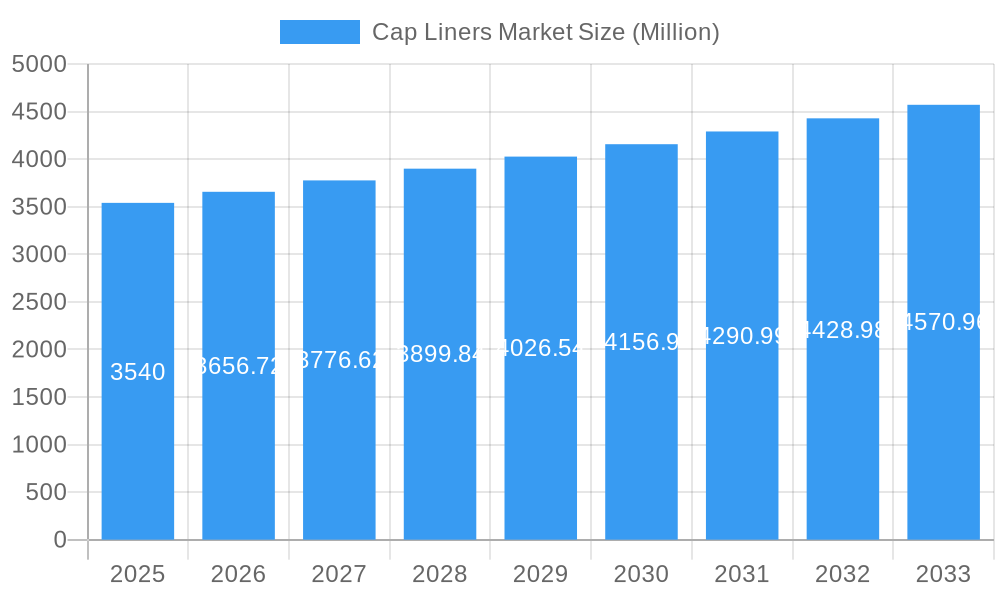
The global cap liners market, valued at $3.54 billion in 2025, is projected to experience steady growth, driven by the expanding packaging industry and increasing demand for tamper-evident and hygienic closures across diverse sectors like food and beverages, pharmaceuticals, and cosmetics. A compound annual growth rate (CAGR) of 3.43% from 2025 to 2033 indicates a sustained market expansion, fueled by innovations in liner materials and designs catering to specific product needs. Factors such as rising consumer awareness of product safety and convenience are also contributing to this growth. However, fluctuating raw material prices and the increasing adoption of alternative closure systems pose potential challenges to market expansion. The market is segmented based on liner material (e.g., paper, foil, plastic), application (e.g., bottles, jars, tubs), and end-use industry. The competitive landscape is characterized by a mix of established players and regional manufacturers, each focusing on product differentiation, technological advancements, and expanding geographical reach. Key players like Meyer Seals GmbH, Tekni-Plex Inc., and others compete primarily based on product quality, pricing, and service offerings. This necessitates continuous innovation and strategic partnerships to maintain a competitive edge. Further market segmentation reveals that the food and beverage sector accounts for a significant share of the market due to the rising demand for packaged food products globally. The pharmaceutical and cosmetic sectors are also key contributors, given the importance of tamper-evident seals and hygienic closures in these industries.
Cap Liners Market Market Size (In Billion)
Growth in the cap liners market is expected to be influenced by several factors. The trend toward sustainable and eco-friendly packaging solutions is driving the development of biodegradable and recyclable liner materials. Increased automation in packaging lines and technological advancements in liner manufacturing processes are improving efficiency and reducing costs. Moreover, the growing e-commerce sector is boosting demand for secure and tamper-evident packaging, which in turn drives the cap liner market. Regional variations in market growth will likely be determined by factors such as economic development, consumer preferences, and regulatory frameworks. Areas with a robust manufacturing sector and high consumption of packaged goods are expected to exhibit faster growth compared to others. Addressing the challenges related to raw material price fluctuations and competitive pressures will be critical for the sustained growth of the cap liners market.
Cap Liners Market Company Market Share
Cap Liners Market Report: 2019-2033
This comprehensive report provides a detailed analysis of the global Cap Liners Market, offering invaluable insights for industry stakeholders, investors, and market strategists. With a focus on market size, growth drivers, competitive dynamics, and future trends, this report covers the period from 2019 to 2033, with a base year of 2025 and an estimated year of 2025. The forecast period spans from 2025 to 2033, encompassing the historical period from 2019 to 2024. The market is projected to reach xx Million by 2033, exhibiting a CAGR of xx%.
Cap Liners Market Structure & Competitive Landscape
The Cap Liners Market is characterized by a moderately concentrated competitive landscape. While several large players dominate, numerous smaller companies also contribute significantly, leading to a dynamic market environment. The market concentration ratio (CR4) is estimated to be around xx%, indicating a presence of both large and smaller entities. Innovation is a key driver, with companies continuously developing new materials and technologies to improve product performance, sustainability, and cost-effectiveness. Regulatory pressures, particularly concerning environmental regulations and food safety, significantly impact market dynamics. Product substitutes, such as alternative sealing mechanisms, exert some pressure, but the overall market continues to exhibit consistent growth. End-user segmentation spans diverse industries including food and beverage, pharmaceuticals, and personal care. M&A activity in the market has been moderate, with approximately xx mergers and acquisitions recorded between 2019 and 2024, reflecting a strategic approach to consolidation and expansion.
- Market Concentration: CR4 approximately xx%
- Key Innovation Drivers: Sustainable materials, improved sealing technology, enhanced barrier properties
- Regulatory Impacts: Stringent food safety and environmental regulations
- Product Substitutes: Alternative sealing methods, but limited impact on overall market growth
- End-User Segmentation: Food & Beverage, Pharmaceuticals, Personal Care, Chemicals, others.
- M&A Trends: Moderate activity, xx transactions between 2019-2024
Cap Liners Market Trends & Opportunities
The global Cap Liners Market is experiencing robust growth, driven by several factors. The increasing demand for convenient and tamper-evident packaging across diverse end-use sectors fuels market expansion. Technological advancements, such as the development of recyclable and sustainable materials, are reshaping the market landscape. Consumer preferences are shifting towards eco-friendly options, creating opportunities for companies offering sustainable cap liners. Competitive dynamics remain intense, with leading players focusing on product innovation, strategic partnerships, and geographic expansion to maintain market share. The market size is estimated at xx Million in 2025, projected to reach xx Million by 2033, with a CAGR of xx%. Market penetration rates vary across regions, with developed markets exhibiting higher saturation compared to developing economies. This presents significant growth opportunities in emerging regions.
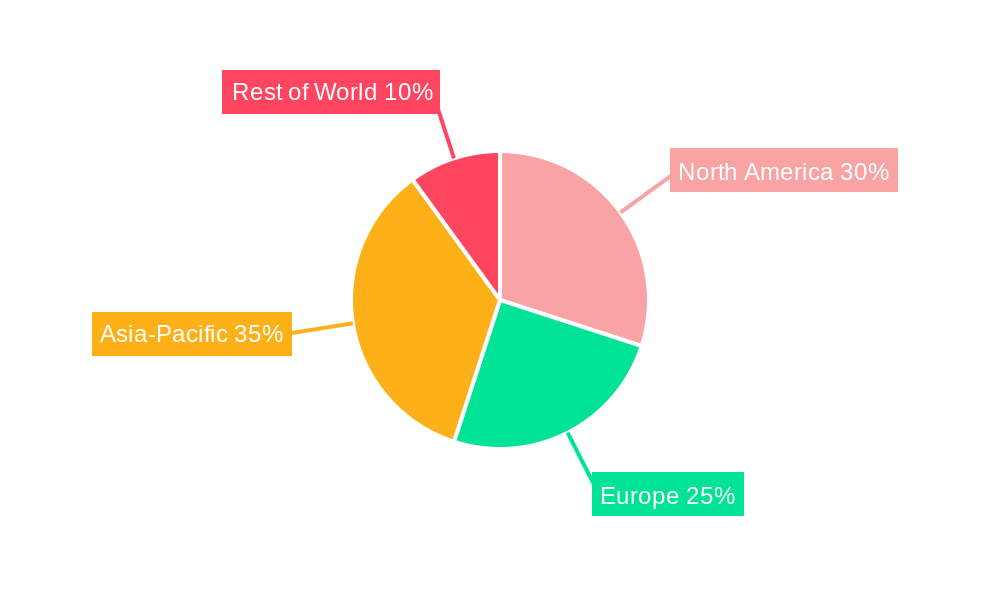
Dominant Markets & Segments in Cap Liners Market
The North American region currently dominates the global Cap Liners Market, driven by factors such as strong demand from the food and beverage and pharmaceutical industries. Europe also holds a significant share, influenced by similar market drivers. Asia-Pacific is experiencing rapid growth due to the expanding food and beverage sector and increasing consumer awareness.
Key Growth Drivers:
- North America: High consumption in food and beverages, robust pharmaceutical sector, established infrastructure.
- Europe: Stringent regulations driving innovation, high demand for sustainable solutions.
- Asia-Pacific: Rapidly expanding food and beverage industry, growing consumer base, increasing disposable incomes.
Cap Liners Market Product Analysis
Recent product innovations center around sustainability and improved performance. Recyclable and compostable cap liners are gaining significant traction, aligning with growing environmental concerns. Technological advancements focus on enhanced barrier properties to improve product shelf life and prevent contamination. New materials and designs offer better seal integrity and tamper evidence, enhancing product protection and consumer trust. The market is seeing a rise in specialized cap liners designed to meet specific application needs, such as those compatible with aggressive chemicals or sensitive pharmaceutical products.
Key Drivers, Barriers & Challenges in Cap Liners Market
Key Drivers:
- Growing Demand for Enhanced Packaging: The rising need for convenient, tamper-evident, and secure packaging solutions across diverse sectors, including food & beverage, pharmaceuticals, and cosmetics, is a primary driver of market expansion. This demand stems from increased consumer awareness of product integrity and safety.
- Sustainability and Eco-Consciousness: The global shift towards sustainable and eco-friendly practices is significantly impacting packaging choices. Consumers and businesses alike are prioritizing recyclable, biodegradable, and compostable cap liners, driving innovation and market growth in this segment.
- Technological Advancements: Continuous advancements in materials science and manufacturing processes are leading to improved cap liner performance. This includes enhanced barrier properties, improved sealing capabilities, and the development of innovative designs for specific applications.
- Expanding Global Reach: The growth of emerging economies and rising disposable incomes in these regions are fueling increased demand for packaged goods, thereby stimulating the cap liners market.
Key Barriers and Challenges:
- Raw Material Price Volatility: Fluctuations in the prices of raw materials, such as polymers and paperboard, directly impact production costs and profitability for cap liner manufacturers. This necessitates effective cost management strategies and supply chain diversification.
- Stringent Regulatory Compliance: Meeting stringent regulatory requirements related to food safety, environmental protection, and material composition poses significant challenges. Manufacturers must invest in compliance initiatives and adapt to evolving regulations across different geographical markets.
- Intense Competitive Landscape: The cap liners market is characterized by intense competition, requiring companies to differentiate their offerings through innovation, superior quality, and cost-effective production. This competitive pressure can impact profit margins and necessitate strategic partnerships or mergers and acquisitions.
- Supply Chain Disruptions: Global events and unforeseen circumstances can disrupt supply chains, impacting the availability of raw materials and the timely delivery of finished products. Resilient and diversified supply chains are crucial to mitigate these risks.
Growth Drivers in the Cap Liners Market
The Cap Liners Market is propelled by technological advancements in materials science, creating recyclable and sustainable options. Strong demand from the food and beverage industry, coupled with increasing focus on extending shelf life and preventing contamination, fuels market growth. Government regulations promoting sustainable packaging practices further contribute to the market's expansion.
Challenges Impacting Cap Liners Market Growth
Supply chain disruptions and increasing raw material costs pose significant challenges. Stringent regulatory hurdles related to food safety and environmental compliance add complexity. Intense competition among established and emerging players necessitates continuous innovation and cost optimization, creating pressure on profit margins.
Key Players Shaping the Cap Liners Market
- Meyer Seals GmbH
- Tekni-Plex Inc
- Bluemay Weston Limited
- Press-On Corporation
- B&B Cap Liners LLC
- Low's Cap Seal Sdn Bhd
- Tien Lik Cap Seal Sdn Bhd
- Captel International Pvt Ltd
- The Cary Company
- Selig UK Limited
- M F I Capliners
Significant Cap Liners Market Industry Milestones
- August 2024: W. L. Gore & Associates introduces two new 3FL (Full Face Foam Liner) cap liners (3FL-363 and 3FL-373) designed for aggressive chemicals, enhancing product protection and accelerating time-to-market for OEMs.
- January 2024: TekniPlex launches a new series of recyclable, paper-based induction heat seal liners (ProTecSeals Recyclable IHS Liners), offering sustainable alternatives with equivalent performance to conventional solutions.
Future Outlook for Cap Liners Market
The Cap Liners Market is poised for continued growth, driven by increasing demand for sustainable packaging and technological advancements in materials and designs. Strategic partnerships and acquisitions will shape the competitive landscape. Expanding into emerging markets and focusing on specialized applications will offer significant opportunities for market players. The market is expected to witness a xx% growth over the next decade, fueled by a rising global population and the continuous demand for convenient, safe, and sustainable packaging solutions.
Cap Liners Market Segmentation
-
1. Material Type
- 1.1. Rubber
- 1.2. Metal
- 1.3. Plastic
- 1.4. Paper
-
2. Application
- 2.1. Bottles
- 2.2. Jars & Containers
-
3. Product Type
-
3.1. Heat-induction Cap Liners
- 3.1.1. One-piece
- 3.1.2. Two-piece
- 3.1.3. Halfmoon Liner
- 3.1.4. Other Heat-induction Cap Liners
- 3.2. Pressure Sensitive Liners
- 3.3. Other Product Types
-
3.1. Heat-induction Cap Liners
-
4. End-user Industry
- 4.1. Food
- 4.2. Beverage
- 4.3. Personal Care & Cosmetics
- 4.4. Chemicals & Fertilizers
- 4.5. Oil, Lubricants, and Grease
- 4.6. Home Care
- 4.7. Other End-user Industries
Cap Liners Market Segmentation By Geography
-
1. North America
- 1.1. United States
- 1.2. Canada
-
2. Europe
- 2.1. France
- 2.2. Germany
- 2.3. Spain
- 2.4. United Kingdom
- 2.5. Turkey
-
3. Asia Pacific
- 3.1. China
- 3.2. India
- 3.3. Japan
- 3.4. Thailand
- 3.5. Australia and New Zealand
-
4. Latin America
- 4.1. Brazil
- 4.2. Mexico
-
5. Middle East and Africa
- 5.1. United Arab Emirates
- 5.2. Saudi Arabia
- 5.3. Egypt
- 5.4. South Africa
Cap Liners Market Regional Market Share
Geographic Coverage of Cap Liners Market
Cap Liners Market REPORT HIGHLIGHTS
| Aspects | Details |
|---|---|
| Study Period | 2020-2034 |
| Base Year | 2025 |
| Estimated Year | 2026 |
| Forecast Period | 2026-2034 |
| Historical Period | 2020-2025 |
| Growth Rate | CAGR of 3.43% from 2020-2034 |
| Segmentation |
|
Table of Contents
- 1. Introduction
- 1.1. Research Scope
- 1.2. Market Segmentation
- 1.3. Research Objective
- 1.4. Definitions and Assumptions
- 2. Executive Summary
- 2.1. Market Snapshot
- 3. Market Dynamics
- 3.1. Market Drivers
- 3.2. Market Restrains
- 3.3. Market Trends
- 3.4. Market Opportunities
- 4. Market Factor Analysis
- 4.1. Porters Five Forces
- 4.1.1. Bargaining Power of Suppliers
- 4.1.2. Bargaining Power of Buyers
- 4.1.3. Threat of New Entrants
- 4.1.4. Threat of Substitutes
- 4.1.5. Competitive Rivalry
- 4.2. PESTEL analysis
- 4.3. BCG Analysis
- 4.3.1. Stars (High Growth, High Market Share)
- 4.3.2. Cash Cows (Low Growth, High Market Share)
- 4.3.3. Question Mark (High Growth, Low Market Share)
- 4.3.4. Dogs (Low Growth, Low Market Share)
- 4.4. Ansoff Matrix Analysis
- 4.5. Supply Chain Analysis
- 4.6. Regulatory Landscape
- 4.7. Current Market Potential and Opportunity Assessment (TAM–SAM–SOM Framework)
- 4.8. TIR Analyst Note
- 4.1. Porters Five Forces
- 5. Market Analysis, Insights and Forecast 2021-2033
- 5.1. Market Analysis, Insights and Forecast - by Material Type
- 5.1.1. Rubber
- 5.1.2. Metal
- 5.1.3. Plastic
- 5.1.4. Paper
- 5.2. Market Analysis, Insights and Forecast - by Application
- 5.2.1. Bottles
- 5.2.2. Jars & Containers
- 5.3. Market Analysis, Insights and Forecast - by Product Type
- 5.3.1. Heat-induction Cap Liners
- 5.3.1.1. One-piece
- 5.3.1.2. Two-piece
- 5.3.1.3. Halfmoon Liner
- 5.3.1.4. Other Heat-induction Cap Liners
- 5.3.2. Pressure Sensitive Liners
- 5.3.3. Other Product Types
- 5.3.1. Heat-induction Cap Liners
- 5.4. Market Analysis, Insights and Forecast - by End-user Industry
- 5.4.1. Food
- 5.4.2. Beverage
- 5.4.3. Personal Care & Cosmetics
- 5.4.4. Chemicals & Fertilizers
- 5.4.5. Oil, Lubricants, and Grease
- 5.4.6. Home Care
- 5.4.7. Other End-user Industries
- 5.5. Market Analysis, Insights and Forecast - by Region
- 5.5.1. North America
- 5.5.2. Europe
- 5.5.3. Asia Pacific
- 5.5.4. Latin America
- 5.5.5. Middle East and Africa
- 5.1. Market Analysis, Insights and Forecast - by Material Type
- 6. Global Cap Liners Market Analysis, Insights and Forecast, 2021-2033
- 6.1. Market Analysis, Insights and Forecast - by Material Type
- 6.1.1. Rubber
- 6.1.2. Metal
- 6.1.3. Plastic
- 6.1.4. Paper
- 6.2. Market Analysis, Insights and Forecast - by Application
- 6.2.1. Bottles
- 6.2.2. Jars & Containers
- 6.3. Market Analysis, Insights and Forecast - by Product Type
- 6.3.1. Heat-induction Cap Liners
- 6.3.1.1. One-piece
- 6.3.1.2. Two-piece
- 6.3.1.3. Halfmoon Liner
- 6.3.1.4. Other Heat-induction Cap Liners
- 6.3.2. Pressure Sensitive Liners
- 6.3.3. Other Product Types
- 6.3.1. Heat-induction Cap Liners
- 6.4. Market Analysis, Insights and Forecast - by End-user Industry
- 6.4.1. Food
- 6.4.2. Beverage
- 6.4.3. Personal Care & Cosmetics
- 6.4.4. Chemicals & Fertilizers
- 6.4.5. Oil, Lubricants, and Grease
- 6.4.6. Home Care
- 6.4.7. Other End-user Industries
- 6.1. Market Analysis, Insights and Forecast - by Material Type
- 7. North America Cap Liners Market Analysis, Insights and Forecast, 2020-2032
- 7.1. Market Analysis, Insights and Forecast - by Material Type
- 7.1.1. Rubber
- 7.1.2. Metal
- 7.1.3. Plastic
- 7.1.4. Paper
- 7.2. Market Analysis, Insights and Forecast - by Application
- 7.2.1. Bottles
- 7.2.2. Jars & Containers
- 7.3. Market Analysis, Insights and Forecast - by Product Type
- 7.3.1. Heat-induction Cap Liners
- 7.3.1.1. One-piece
- 7.3.1.2. Two-piece
- 7.3.1.3. Halfmoon Liner
- 7.3.1.4. Other Heat-induction Cap Liners
- 7.3.2. Pressure Sensitive Liners
- 7.3.3. Other Product Types
- 7.3.1. Heat-induction Cap Liners
- 7.4. Market Analysis, Insights and Forecast - by End-user Industry
- 7.4.1. Food
- 7.4.2. Beverage
- 7.4.3. Personal Care & Cosmetics
- 7.4.4. Chemicals & Fertilizers
- 7.4.5. Oil, Lubricants, and Grease
- 7.4.6. Home Care
- 7.4.7. Other End-user Industries
- 7.1. Market Analysis, Insights and Forecast - by Material Type
- 8. Europe Cap Liners Market Analysis, Insights and Forecast, 2020-2032
- 8.1. Market Analysis, Insights and Forecast - by Material Type
- 8.1.1. Rubber
- 8.1.2. Metal
- 8.1.3. Plastic
- 8.1.4. Paper
- 8.2. Market Analysis, Insights and Forecast - by Application
- 8.2.1. Bottles
- 8.2.2. Jars & Containers
- 8.3. Market Analysis, Insights and Forecast - by Product Type
- 8.3.1. Heat-induction Cap Liners
- 8.3.1.1. One-piece
- 8.3.1.2. Two-piece
- 8.3.1.3. Halfmoon Liner
- 8.3.1.4. Other Heat-induction Cap Liners
- 8.3.2. Pressure Sensitive Liners
- 8.3.3. Other Product Types
- 8.3.1. Heat-induction Cap Liners
- 8.4. Market Analysis, Insights and Forecast - by End-user Industry
- 8.4.1. Food
- 8.4.2. Beverage
- 8.4.3. Personal Care & Cosmetics
- 8.4.4. Chemicals & Fertilizers
- 8.4.5. Oil, Lubricants, and Grease
- 8.4.6. Home Care
- 8.4.7. Other End-user Industries
- 8.1. Market Analysis, Insights and Forecast - by Material Type
- 9. Asia Pacific Cap Liners Market Analysis, Insights and Forecast, 2020-2032
- 9.1. Market Analysis, Insights and Forecast - by Material Type
- 9.1.1. Rubber
- 9.1.2. Metal
- 9.1.3. Plastic
- 9.1.4. Paper
- 9.2. Market Analysis, Insights and Forecast - by Application
- 9.2.1. Bottles
- 9.2.2. Jars & Containers
- 9.3. Market Analysis, Insights and Forecast - by Product Type
- 9.3.1. Heat-induction Cap Liners
- 9.3.1.1. One-piece
- 9.3.1.2. Two-piece
- 9.3.1.3. Halfmoon Liner
- 9.3.1.4. Other Heat-induction Cap Liners
- 9.3.2. Pressure Sensitive Liners
- 9.3.3. Other Product Types
- 9.3.1. Heat-induction Cap Liners
- 9.4. Market Analysis, Insights and Forecast - by End-user Industry
- 9.4.1. Food
- 9.4.2. Beverage
- 9.4.3. Personal Care & Cosmetics
- 9.4.4. Chemicals & Fertilizers
- 9.4.5. Oil, Lubricants, and Grease
- 9.4.6. Home Care
- 9.4.7. Other End-user Industries
- 9.1. Market Analysis, Insights and Forecast - by Material Type
- 10. Latin America Cap Liners Market Analysis, Insights and Forecast, 2020-2032
- 10.1. Market Analysis, Insights and Forecast - by Material Type
- 10.1.1. Rubber
- 10.1.2. Metal
- 10.1.3. Plastic
- 10.1.4. Paper
- 10.2. Market Analysis, Insights and Forecast - by Application
- 10.2.1. Bottles
- 10.2.2. Jars & Containers
- 10.3. Market Analysis, Insights and Forecast - by Product Type
- 10.3.1. Heat-induction Cap Liners
- 10.3.1.1. One-piece
- 10.3.1.2. Two-piece
- 10.3.1.3. Halfmoon Liner
- 10.3.1.4. Other Heat-induction Cap Liners
- 10.3.2. Pressure Sensitive Liners
- 10.3.3. Other Product Types
- 10.3.1. Heat-induction Cap Liners
- 10.4. Market Analysis, Insights and Forecast - by End-user Industry
- 10.4.1. Food
- 10.4.2. Beverage
- 10.4.3. Personal Care & Cosmetics
- 10.4.4. Chemicals & Fertilizers
- 10.4.5. Oil, Lubricants, and Grease
- 10.4.6. Home Care
- 10.4.7. Other End-user Industries
- 10.1. Market Analysis, Insights and Forecast - by Material Type
- 11. Middle East and Africa Cap Liners Market Analysis, Insights and Forecast, 2020-2032
- 11.1. Market Analysis, Insights and Forecast - by Material Type
- 11.1.1. Rubber
- 11.1.2. Metal
- 11.1.3. Plastic
- 11.1.4. Paper
- 11.2. Market Analysis, Insights and Forecast - by Application
- 11.2.1. Bottles
- 11.2.2. Jars & Containers
- 11.3. Market Analysis, Insights and Forecast - by Product Type
- 11.3.1. Heat-induction Cap Liners
- 11.3.1.1. One-piece
- 11.3.1.2. Two-piece
- 11.3.1.3. Halfmoon Liner
- 11.3.1.4. Other Heat-induction Cap Liners
- 11.3.2. Pressure Sensitive Liners
- 11.3.3. Other Product Types
- 11.3.1. Heat-induction Cap Liners
- 11.4. Market Analysis, Insights and Forecast - by End-user Industry
- 11.4.1. Food
- 11.4.2. Beverage
- 11.4.3. Personal Care & Cosmetics
- 11.4.4. Chemicals & Fertilizers
- 11.4.5. Oil, Lubricants, and Grease
- 11.4.6. Home Care
- 11.4.7. Other End-user Industries
- 11.1. Market Analysis, Insights and Forecast - by Material Type
- 12. Competitive Analysis
- 12.1. Company Profiles
- 12.1.1 Meyer Seals GmbH
- 12.1.1.1. Company Overview
- 12.1.1.2. Products
- 12.1.1.3. Company Financials
- 12.1.1.4. SWOT Analysis
- 12.1.2 Tekni-Plex Inc
- 12.1.2.1. Company Overview
- 12.1.2.2. Products
- 12.1.2.3. Company Financials
- 12.1.2.4. SWOT Analysis
- 12.1.3 Bluemay Weston Limited
- 12.1.3.1. Company Overview
- 12.1.3.2. Products
- 12.1.3.3. Company Financials
- 12.1.3.4. SWOT Analysis
- 12.1.4 Press-On Corporation
- 12.1.4.1. Company Overview
- 12.1.4.2. Products
- 12.1.4.3. Company Financials
- 12.1.4.4. SWOT Analysis
- 12.1.5 B&B Cap Liners LLC
- 12.1.5.1. Company Overview
- 12.1.5.2. Products
- 12.1.5.3. Company Financials
- 12.1.5.4. SWOT Analysis
- 12.1.6 Low's Cap Seal Sdn Bhd
- 12.1.6.1. Company Overview
- 12.1.6.2. Products
- 12.1.6.3. Company Financials
- 12.1.6.4. SWOT Analysis
- 12.1.7 Tien Lik Cap Seal Sdn Bhd
- 12.1.7.1. Company Overview
- 12.1.7.2. Products
- 12.1.7.3. Company Financials
- 12.1.7.4. SWOT Analysis
- 12.1.8 Captel International Pvt Ltd
- 12.1.8.1. Company Overview
- 12.1.8.2. Products
- 12.1.8.3. Company Financials
- 12.1.8.4. SWOT Analysis
- 12.1.9 The Cary Company
- 12.1.9.1. Company Overview
- 12.1.9.2. Products
- 12.1.9.3. Company Financials
- 12.1.9.4. SWOT Analysis
- 12.1.10 Selig UK Limited
- 12.1.10.1. Company Overview
- 12.1.10.2. Products
- 12.1.10.3. Company Financials
- 12.1.10.4. SWOT Analysis
- 12.1.11 M F I Capliners*List Not Exhaustive
- 12.1.11.1. Company Overview
- 12.1.11.2. Products
- 12.1.11.3. Company Financials
- 12.1.11.4. SWOT Analysis
- 12.1.1 Meyer Seals GmbH
- 12.2. Market Entropy
- 12.2.1 Company's Key Areas Served
- 12.2.2 Recent Developments
- 12.3. Company Market Share Analysis 2025
- 12.3.1 Top 5 Companies Market Share Analysis
- 12.3.2 Top 3 Companies Market Share Analysis
- 12.4. List of Potential Customers
- 13. Research Methodology
List of Figures
- Figure 1: Global Cap Liners Market Revenue Breakdown (Million, %) by Region 2025 & 2033
- Figure 2: Global Cap Liners Market Volume Breakdown (Billion, %) by Region 2025 & 2033
- Figure 3: North America Cap Liners Market Revenue (Million), by Material Type 2025 & 2033
- Figure 4: North America Cap Liners Market Volume (Billion), by Material Type 2025 & 2033
- Figure 5: North America Cap Liners Market Revenue Share (%), by Material Type 2025 & 2033
- Figure 6: North America Cap Liners Market Volume Share (%), by Material Type 2025 & 2033
- Figure 7: North America Cap Liners Market Revenue (Million), by Application 2025 & 2033
- Figure 8: North America Cap Liners Market Volume (Billion), by Application 2025 & 2033
- Figure 9: North America Cap Liners Market Revenue Share (%), by Application 2025 & 2033
- Figure 10: North America Cap Liners Market Volume Share (%), by Application 2025 & 2033
- Figure 11: North America Cap Liners Market Revenue (Million), by Product Type 2025 & 2033
- Figure 12: North America Cap Liners Market Volume (Billion), by Product Type 2025 & 2033
- Figure 13: North America Cap Liners Market Revenue Share (%), by Product Type 2025 & 2033
- Figure 14: North America Cap Liners Market Volume Share (%), by Product Type 2025 & 2033
- Figure 15: North America Cap Liners Market Revenue (Million), by End-user Industry 2025 & 2033
- Figure 16: North America Cap Liners Market Volume (Billion), by End-user Industry 2025 & 2033
- Figure 17: North America Cap Liners Market Revenue Share (%), by End-user Industry 2025 & 2033
- Figure 18: North America Cap Liners Market Volume Share (%), by End-user Industry 2025 & 2033
- Figure 19: North America Cap Liners Market Revenue (Million), by Country 2025 & 2033
- Figure 20: North America Cap Liners Market Volume (Billion), by Country 2025 & 2033
- Figure 21: North America Cap Liners Market Revenue Share (%), by Country 2025 & 2033
- Figure 22: North America Cap Liners Market Volume Share (%), by Country 2025 & 2033
- Figure 23: Europe Cap Liners Market Revenue (Million), by Material Type 2025 & 2033
- Figure 24: Europe Cap Liners Market Volume (Billion), by Material Type 2025 & 2033
- Figure 25: Europe Cap Liners Market Revenue Share (%), by Material Type 2025 & 2033
- Figure 26: Europe Cap Liners Market Volume Share (%), by Material Type 2025 & 2033
- Figure 27: Europe Cap Liners Market Revenue (Million), by Application 2025 & 2033
- Figure 28: Europe Cap Liners Market Volume (Billion), by Application 2025 & 2033
- Figure 29: Europe Cap Liners Market Revenue Share (%), by Application 2025 & 2033
- Figure 30: Europe Cap Liners Market Volume Share (%), by Application 2025 & 2033
- Figure 31: Europe Cap Liners Market Revenue (Million), by Product Type 2025 & 2033
- Figure 32: Europe Cap Liners Market Volume (Billion), by Product Type 2025 & 2033
- Figure 33: Europe Cap Liners Market Revenue Share (%), by Product Type 2025 & 2033
- Figure 34: Europe Cap Liners Market Volume Share (%), by Product Type 2025 & 2033
- Figure 35: Europe Cap Liners Market Revenue (Million), by End-user Industry 2025 & 2033
- Figure 36: Europe Cap Liners Market Volume (Billion), by End-user Industry 2025 & 2033
- Figure 37: Europe Cap Liners Market Revenue Share (%), by End-user Industry 2025 & 2033
- Figure 38: Europe Cap Liners Market Volume Share (%), by End-user Industry 2025 & 2033
- Figure 39: Europe Cap Liners Market Revenue (Million), by Country 2025 & 2033
- Figure 40: Europe Cap Liners Market Volume (Billion), by Country 2025 & 2033
- Figure 41: Europe Cap Liners Market Revenue Share (%), by Country 2025 & 2033
- Figure 42: Europe Cap Liners Market Volume Share (%), by Country 2025 & 2033
- Figure 43: Asia Pacific Cap Liners Market Revenue (Million), by Material Type 2025 & 2033
- Figure 44: Asia Pacific Cap Liners Market Volume (Billion), by Material Type 2025 & 2033
- Figure 45: Asia Pacific Cap Liners Market Revenue Share (%), by Material Type 2025 & 2033
- Figure 46: Asia Pacific Cap Liners Market Volume Share (%), by Material Type 2025 & 2033
- Figure 47: Asia Pacific Cap Liners Market Revenue (Million), by Application 2025 & 2033
- Figure 48: Asia Pacific Cap Liners Market Volume (Billion), by Application 2025 & 2033
- Figure 49: Asia Pacific Cap Liners Market Revenue Share (%), by Application 2025 & 2033
- Figure 50: Asia Pacific Cap Liners Market Volume Share (%), by Application 2025 & 2033
- Figure 51: Asia Pacific Cap Liners Market Revenue (Million), by Product Type 2025 & 2033
- Figure 52: Asia Pacific Cap Liners Market Volume (Billion), by Product Type 2025 & 2033
- Figure 53: Asia Pacific Cap Liners Market Revenue Share (%), by Product Type 2025 & 2033
- Figure 54: Asia Pacific Cap Liners Market Volume Share (%), by Product Type 2025 & 2033
- Figure 55: Asia Pacific Cap Liners Market Revenue (Million), by End-user Industry 2025 & 2033
- Figure 56: Asia Pacific Cap Liners Market Volume (Billion), by End-user Industry 2025 & 2033
- Figure 57: Asia Pacific Cap Liners Market Revenue Share (%), by End-user Industry 2025 & 2033
- Figure 58: Asia Pacific Cap Liners Market Volume Share (%), by End-user Industry 2025 & 2033
- Figure 59: Asia Pacific Cap Liners Market Revenue (Million), by Country 2025 & 2033
- Figure 60: Asia Pacific Cap Liners Market Volume (Billion), by Country 2025 & 2033
- Figure 61: Asia Pacific Cap Liners Market Revenue Share (%), by Country 2025 & 2033
- Figure 62: Asia Pacific Cap Liners Market Volume Share (%), by Country 2025 & 2033
- Figure 63: Latin America Cap Liners Market Revenue (Million), by Material Type 2025 & 2033
- Figure 64: Latin America Cap Liners Market Volume (Billion), by Material Type 2025 & 2033
- Figure 65: Latin America Cap Liners Market Revenue Share (%), by Material Type 2025 & 2033
- Figure 66: Latin America Cap Liners Market Volume Share (%), by Material Type 2025 & 2033
- Figure 67: Latin America Cap Liners Market Revenue (Million), by Application 2025 & 2033
- Figure 68: Latin America Cap Liners Market Volume (Billion), by Application 2025 & 2033
- Figure 69: Latin America Cap Liners Market Revenue Share (%), by Application 2025 & 2033
- Figure 70: Latin America Cap Liners Market Volume Share (%), by Application 2025 & 2033
- Figure 71: Latin America Cap Liners Market Revenue (Million), by Product Type 2025 & 2033
- Figure 72: Latin America Cap Liners Market Volume (Billion), by Product Type 2025 & 2033
- Figure 73: Latin America Cap Liners Market Revenue Share (%), by Product Type 2025 & 2033
- Figure 74: Latin America Cap Liners Market Volume Share (%), by Product Type 2025 & 2033
- Figure 75: Latin America Cap Liners Market Revenue (Million), by End-user Industry 2025 & 2033
- Figure 76: Latin America Cap Liners Market Volume (Billion), by End-user Industry 2025 & 2033
- Figure 77: Latin America Cap Liners Market Revenue Share (%), by End-user Industry 2025 & 2033
- Figure 78: Latin America Cap Liners Market Volume Share (%), by End-user Industry 2025 & 2033
- Figure 79: Latin America Cap Liners Market Revenue (Million), by Country 2025 & 2033
- Figure 80: Latin America Cap Liners Market Volume (Billion), by Country 2025 & 2033
- Figure 81: Latin America Cap Liners Market Revenue Share (%), by Country 2025 & 2033
- Figure 82: Latin America Cap Liners Market Volume Share (%), by Country 2025 & 2033
- Figure 83: Middle East and Africa Cap Liners Market Revenue (Million), by Material Type 2025 & 2033
- Figure 84: Middle East and Africa Cap Liners Market Volume (Billion), by Material Type 2025 & 2033
- Figure 85: Middle East and Africa Cap Liners Market Revenue Share (%), by Material Type 2025 & 2033
- Figure 86: Middle East and Africa Cap Liners Market Volume Share (%), by Material Type 2025 & 2033
- Figure 87: Middle East and Africa Cap Liners Market Revenue (Million), by Application 2025 & 2033
- Figure 88: Middle East and Africa Cap Liners Market Volume (Billion), by Application 2025 & 2033
- Figure 89: Middle East and Africa Cap Liners Market Revenue Share (%), by Application 2025 & 2033
- Figure 90: Middle East and Africa Cap Liners Market Volume Share (%), by Application 2025 & 2033
- Figure 91: Middle East and Africa Cap Liners Market Revenue (Million), by Product Type 2025 & 2033
- Figure 92: Middle East and Africa Cap Liners Market Volume (Billion), by Product Type 2025 & 2033
- Figure 93: Middle East and Africa Cap Liners Market Revenue Share (%), by Product Type 2025 & 2033
- Figure 94: Middle East and Africa Cap Liners Market Volume Share (%), by Product Type 2025 & 2033
- Figure 95: Middle East and Africa Cap Liners Market Revenue (Million), by End-user Industry 2025 & 2033
- Figure 96: Middle East and Africa Cap Liners Market Volume (Billion), by End-user Industry 2025 & 2033
- Figure 97: Middle East and Africa Cap Liners Market Revenue Share (%), by End-user Industry 2025 & 2033
- Figure 98: Middle East and Africa Cap Liners Market Volume Share (%), by End-user Industry 2025 & 2033
- Figure 99: Middle East and Africa Cap Liners Market Revenue (Million), by Country 2025 & 2033
- Figure 100: Middle East and Africa Cap Liners Market Volume (Billion), by Country 2025 & 2033
- Figure 101: Middle East and Africa Cap Liners Market Revenue Share (%), by Country 2025 & 2033
- Figure 102: Middle East and Africa Cap Liners Market Volume Share (%), by Country 2025 & 2033
List of Tables
- Table 1: Global Cap Liners Market Revenue Million Forecast, by Material Type 2020 & 2033
- Table 2: Global Cap Liners Market Volume Billion Forecast, by Material Type 2020 & 2033
- Table 3: Global Cap Liners Market Revenue Million Forecast, by Application 2020 & 2033
- Table 4: Global Cap Liners Market Volume Billion Forecast, by Application 2020 & 2033
- Table 5: Global Cap Liners Market Revenue Million Forecast, by Product Type 2020 & 2033
- Table 6: Global Cap Liners Market Volume Billion Forecast, by Product Type 2020 & 2033
- Table 7: Global Cap Liners Market Revenue Million Forecast, by End-user Industry 2020 & 2033
- Table 8: Global Cap Liners Market Volume Billion Forecast, by End-user Industry 2020 & 2033
- Table 9: Global Cap Liners Market Revenue Million Forecast, by Region 2020 & 2033
- Table 10: Global Cap Liners Market Volume Billion Forecast, by Region 2020 & 2033
- Table 11: Global Cap Liners Market Revenue Million Forecast, by Material Type 2020 & 2033
- Table 12: Global Cap Liners Market Volume Billion Forecast, by Material Type 2020 & 2033
- Table 13: Global Cap Liners Market Revenue Million Forecast, by Application 2020 & 2033
- Table 14: Global Cap Liners Market Volume Billion Forecast, by Application 2020 & 2033
- Table 15: Global Cap Liners Market Revenue Million Forecast, by Product Type 2020 & 2033
- Table 16: Global Cap Liners Market Volume Billion Forecast, by Product Type 2020 & 2033
- Table 17: Global Cap Liners Market Revenue Million Forecast, by End-user Industry 2020 & 2033
- Table 18: Global Cap Liners Market Volume Billion Forecast, by End-user Industry 2020 & 2033
- Table 19: Global Cap Liners Market Revenue Million Forecast, by Country 2020 & 2033
- Table 20: Global Cap Liners Market Volume Billion Forecast, by Country 2020 & 2033
- Table 21: United States Cap Liners Market Revenue (Million) Forecast, by Application 2020 & 2033
- Table 22: United States Cap Liners Market Volume (Billion) Forecast, by Application 2020 & 2033
- Table 23: Canada Cap Liners Market Revenue (Million) Forecast, by Application 2020 & 2033
- Table 24: Canada Cap Liners Market Volume (Billion) Forecast, by Application 2020 & 2033
- Table 25: Global Cap Liners Market Revenue Million Forecast, by Material Type 2020 & 2033
- Table 26: Global Cap Liners Market Volume Billion Forecast, by Material Type 2020 & 2033
- Table 27: Global Cap Liners Market Revenue Million Forecast, by Application 2020 & 2033
- Table 28: Global Cap Liners Market Volume Billion Forecast, by Application 2020 & 2033
- Table 29: Global Cap Liners Market Revenue Million Forecast, by Product Type 2020 & 2033
- Table 30: Global Cap Liners Market Volume Billion Forecast, by Product Type 2020 & 2033
- Table 31: Global Cap Liners Market Revenue Million Forecast, by End-user Industry 2020 & 2033
- Table 32: Global Cap Liners Market Volume Billion Forecast, by End-user Industry 2020 & 2033
- Table 33: Global Cap Liners Market Revenue Million Forecast, by Country 2020 & 2033
- Table 34: Global Cap Liners Market Volume Billion Forecast, by Country 2020 & 2033
- Table 35: France Cap Liners Market Revenue (Million) Forecast, by Application 2020 & 2033
- Table 36: France Cap Liners Market Volume (Billion) Forecast, by Application 2020 & 2033
- Table 37: Germany Cap Liners Market Revenue (Million) Forecast, by Application 2020 & 2033
- Table 38: Germany Cap Liners Market Volume (Billion) Forecast, by Application 2020 & 2033
- Table 39: Spain Cap Liners Market Revenue (Million) Forecast, by Application 2020 & 2033
- Table 40: Spain Cap Liners Market Volume (Billion) Forecast, by Application 2020 & 2033
- Table 41: United Kingdom Cap Liners Market Revenue (Million) Forecast, by Application 2020 & 2033
- Table 42: United Kingdom Cap Liners Market Volume (Billion) Forecast, by Application 2020 & 2033
- Table 43: Turkey Cap Liners Market Revenue (Million) Forecast, by Application 2020 & 2033
- Table 44: Turkey Cap Liners Market Volume (Billion) Forecast, by Application 2020 & 2033
- Table 45: Global Cap Liners Market Revenue Million Forecast, by Material Type 2020 & 2033
- Table 46: Global Cap Liners Market Volume Billion Forecast, by Material Type 2020 & 2033
- Table 47: Global Cap Liners Market Revenue Million Forecast, by Application 2020 & 2033
- Table 48: Global Cap Liners Market Volume Billion Forecast, by Application 2020 & 2033
- Table 49: Global Cap Liners Market Revenue Million Forecast, by Product Type 2020 & 2033
- Table 50: Global Cap Liners Market Volume Billion Forecast, by Product Type 2020 & 2033
- Table 51: Global Cap Liners Market Revenue Million Forecast, by End-user Industry 2020 & 2033
- Table 52: Global Cap Liners Market Volume Billion Forecast, by End-user Industry 2020 & 2033
- Table 53: Global Cap Liners Market Revenue Million Forecast, by Country 2020 & 2033
- Table 54: Global Cap Liners Market Volume Billion Forecast, by Country 2020 & 2033
- Table 55: China Cap Liners Market Revenue (Million) Forecast, by Application 2020 & 2033
- Table 56: China Cap Liners Market Volume (Billion) Forecast, by Application 2020 & 2033
- Table 57: India Cap Liners Market Revenue (Million) Forecast, by Application 2020 & 2033
- Table 58: India Cap Liners Market Volume (Billion) Forecast, by Application 2020 & 2033
- Table 59: Japan Cap Liners Market Revenue (Million) Forecast, by Application 2020 & 2033
- Table 60: Japan Cap Liners Market Volume (Billion) Forecast, by Application 2020 & 2033
- Table 61: Thailand Cap Liners Market Revenue (Million) Forecast, by Application 2020 & 2033
- Table 62: Thailand Cap Liners Market Volume (Billion) Forecast, by Application 2020 & 2033
- Table 63: Australia and New Zealand Cap Liners Market Revenue (Million) Forecast, by Application 2020 & 2033
- Table 64: Australia and New Zealand Cap Liners Market Volume (Billion) Forecast, by Application 2020 & 2033
- Table 65: Global Cap Liners Market Revenue Million Forecast, by Material Type 2020 & 2033
- Table 66: Global Cap Liners Market Volume Billion Forecast, by Material Type 2020 & 2033
- Table 67: Global Cap Liners Market Revenue Million Forecast, by Application 2020 & 2033
- Table 68: Global Cap Liners Market Volume Billion Forecast, by Application 2020 & 2033
- Table 69: Global Cap Liners Market Revenue Million Forecast, by Product Type 2020 & 2033
- Table 70: Global Cap Liners Market Volume Billion Forecast, by Product Type 2020 & 2033
- Table 71: Global Cap Liners Market Revenue Million Forecast, by End-user Industry 2020 & 2033
- Table 72: Global Cap Liners Market Volume Billion Forecast, by End-user Industry 2020 & 2033
- Table 73: Global Cap Liners Market Revenue Million Forecast, by Country 2020 & 2033
- Table 74: Global Cap Liners Market Volume Billion Forecast, by Country 2020 & 2033
- Table 75: Brazil Cap Liners Market Revenue (Million) Forecast, by Application 2020 & 2033
- Table 76: Brazil Cap Liners Market Volume (Billion) Forecast, by Application 2020 & 2033
- Table 77: Mexico Cap Liners Market Revenue (Million) Forecast, by Application 2020 & 2033
- Table 78: Mexico Cap Liners Market Volume (Billion) Forecast, by Application 2020 & 2033
- Table 79: Global Cap Liners Market Revenue Million Forecast, by Material Type 2020 & 2033
- Table 80: Global Cap Liners Market Volume Billion Forecast, by Material Type 2020 & 2033
- Table 81: Global Cap Liners Market Revenue Million Forecast, by Application 2020 & 2033
- Table 82: Global Cap Liners Market Volume Billion Forecast, by Application 2020 & 2033
- Table 83: Global Cap Liners Market Revenue Million Forecast, by Product Type 2020 & 2033
- Table 84: Global Cap Liners Market Volume Billion Forecast, by Product Type 2020 & 2033
- Table 85: Global Cap Liners Market Revenue Million Forecast, by End-user Industry 2020 & 2033
- Table 86: Global Cap Liners Market Volume Billion Forecast, by End-user Industry 2020 & 2033
- Table 87: Global Cap Liners Market Revenue Million Forecast, by Country 2020 & 2033
- Table 88: Global Cap Liners Market Volume Billion Forecast, by Country 2020 & 2033
- Table 89: United Arab Emirates Cap Liners Market Revenue (Million) Forecast, by Application 2020 & 2033
- Table 90: United Arab Emirates Cap Liners Market Volume (Billion) Forecast, by Application 2020 & 2033
- Table 91: Saudi Arabia Cap Liners Market Revenue (Million) Forecast, by Application 2020 & 2033
- Table 92: Saudi Arabia Cap Liners Market Volume (Billion) Forecast, by Application 2020 & 2033
- Table 93: Egypt Cap Liners Market Revenue (Million) Forecast, by Application 2020 & 2033
- Table 94: Egypt Cap Liners Market Volume (Billion) Forecast, by Application 2020 & 2033
- Table 95: South Africa Cap Liners Market Revenue (Million) Forecast, by Application 2020 & 2033
- Table 96: South Africa Cap Liners Market Volume (Billion) Forecast, by Application 2020 & 2033
Frequently Asked Questions
1. What is the projected Compound Annual Growth Rate (CAGR) of the Cap Liners Market?
The projected CAGR is approximately 3.43%.
2. Which companies are prominent players in the Cap Liners Market?
Key companies in the market include Meyer Seals GmbH, Tekni-Plex Inc, Bluemay Weston Limited, Press-On Corporation, B&B Cap Liners LLC, Low's Cap Seal Sdn Bhd, Tien Lik Cap Seal Sdn Bhd, Captel International Pvt Ltd, The Cary Company, Selig UK Limited, M F I Capliners*List Not Exhaustive.
3. What are the main segments of the Cap Liners Market?
The market segments include Material Type, Application, Product Type, End-user Industry.
4. Can you provide details about the market size?
The market size is estimated to be USD 3.54 Million as of 2022.
5. What are some drivers contributing to market growth?
Safe and Secure Handling. Storage. and Transport of Products; Increased Demand from the Pharmaceutical Industry.
6. What are the notable trends driving market growth?
Increased Use of Cap Liners in the Pharmaceutical Industry.
7. Are there any restraints impacting market growth?
Safe and Secure Handling. Storage. and Transport of Products; Increased Demand from the Pharmaceutical Industry.
8. Can you provide examples of recent developments in the market?
August 2024: Two new 3FL (Full Face Foam Liner) cap liners from W. L. Gore & Associates are engineered to maintain the structural integrity of containers of chemicals for agricultural and household uses. The 3FL-363 and 3FL-373 cap liners, the latest addition to Gore’s extensive portfolio, provide excellent breathability and are resistant to many of today’s most aggressive chemicals—toilet cleaners, stain lifters, pipe clog removers, and organic fertilizers—without necessitating any changes in formulation. This enables OEMs to get their products to market faster and possibly develop even more effective formulations.January 2024: TekniPlex launched a new series of recyclable, paper-based induction heat seal liners designed to seal dry pharma, nutrition, and food products in bottles and jars with protective properties identical to conventional solutions. The ProTecSeals Recyclable IHS Liners are made of recyclable paper from tree pulp. They offer moisture and oxygen barrier properties, resist leaks, prevent contamination, and prolong shelf life to the same standard as traditional IHS liners.
9. What pricing options are available for accessing the report?
Pricing options include single-user, multi-user, and enterprise licenses priced at USD 4750, USD 5250, and USD 8750 respectively.
10. Is the market size provided in terms of value or volume?
The market size is provided in terms of value, measured in Million and volume, measured in Billion.
11. Are there any specific market keywords associated with the report?
Yes, the market keyword associated with the report is "Cap Liners Market," which aids in identifying and referencing the specific market segment covered.
12. How do I determine which pricing option suits my needs best?
The pricing options vary based on user requirements and access needs. Individual users may opt for single-user licenses, while businesses requiring broader access may choose multi-user or enterprise licenses for cost-effective access to the report.
13. Are there any additional resources or data provided in the Cap Liners Market report?
While the report offers comprehensive insights, it's advisable to review the specific contents or supplementary materials provided to ascertain if additional resources or data are available.
14. How can I stay updated on further developments or reports in the Cap Liners Market?
To stay informed about further developments, trends, and reports in the Cap Liners Market, consider subscribing to industry newsletters, following relevant companies and organizations, or regularly checking reputable industry news sources and publications.
Methodology
Step 1 - Identification of Relevant Samples Size from Population Database


Step 2 - Approaches for Defining Global Market Size (Value, Volume* & Price*)

Note*: In applicable scenarios
Step 3 - Data Sources
Primary Research
- Web Analytics
- Survey Reports
- Research Institute
- Latest Research Reports
- Opinion Leaders
Secondary Research
- Annual Reports
- White Paper
- Latest Press Release
- Industry Association
- Paid Database
- Investor Presentations

Step 4 - Data Triangulation
Involves using different sources of information in order to increase the validity of a study
These sources are likely to be stakeholders in a program - participants, other researchers, program staff, other community members, and so on.
Then we put all data in single framework & apply various statistical tools to find out the dynamic on the market.
During the analysis stage, feedback from the stakeholder groups would be compared to determine areas of agreement as well as areas of divergence