

Key Insights
The global ESD foam packaging market is poised for significant expansion, driven by the increasing demand for static-sensitive component protection across critical industries. In 2025, the market is valued at an estimated $2.14 billion, with a projected compound annual growth rate (CAGR) of 4.54% through 2033. This growth trajectory is fueled by the escalating adoption of advanced electronics in consumer goods, automotive, and defense sectors, all of which necessitate robust electrostatic discharge (ESD) protection. The burgeoning manufacturing industry, particularly in automation and precision tooling, further amplifies the need for specialized ESD packaging solutions to prevent costly damage to sensitive components. Emerging economies, especially in the Asia Pacific region, are witnessing accelerated industrialization, leading to a surge in the requirement for reliable ESD foam packaging. This escalating demand is a direct response to the inherent risks associated with the handling and transportation of electronic components.
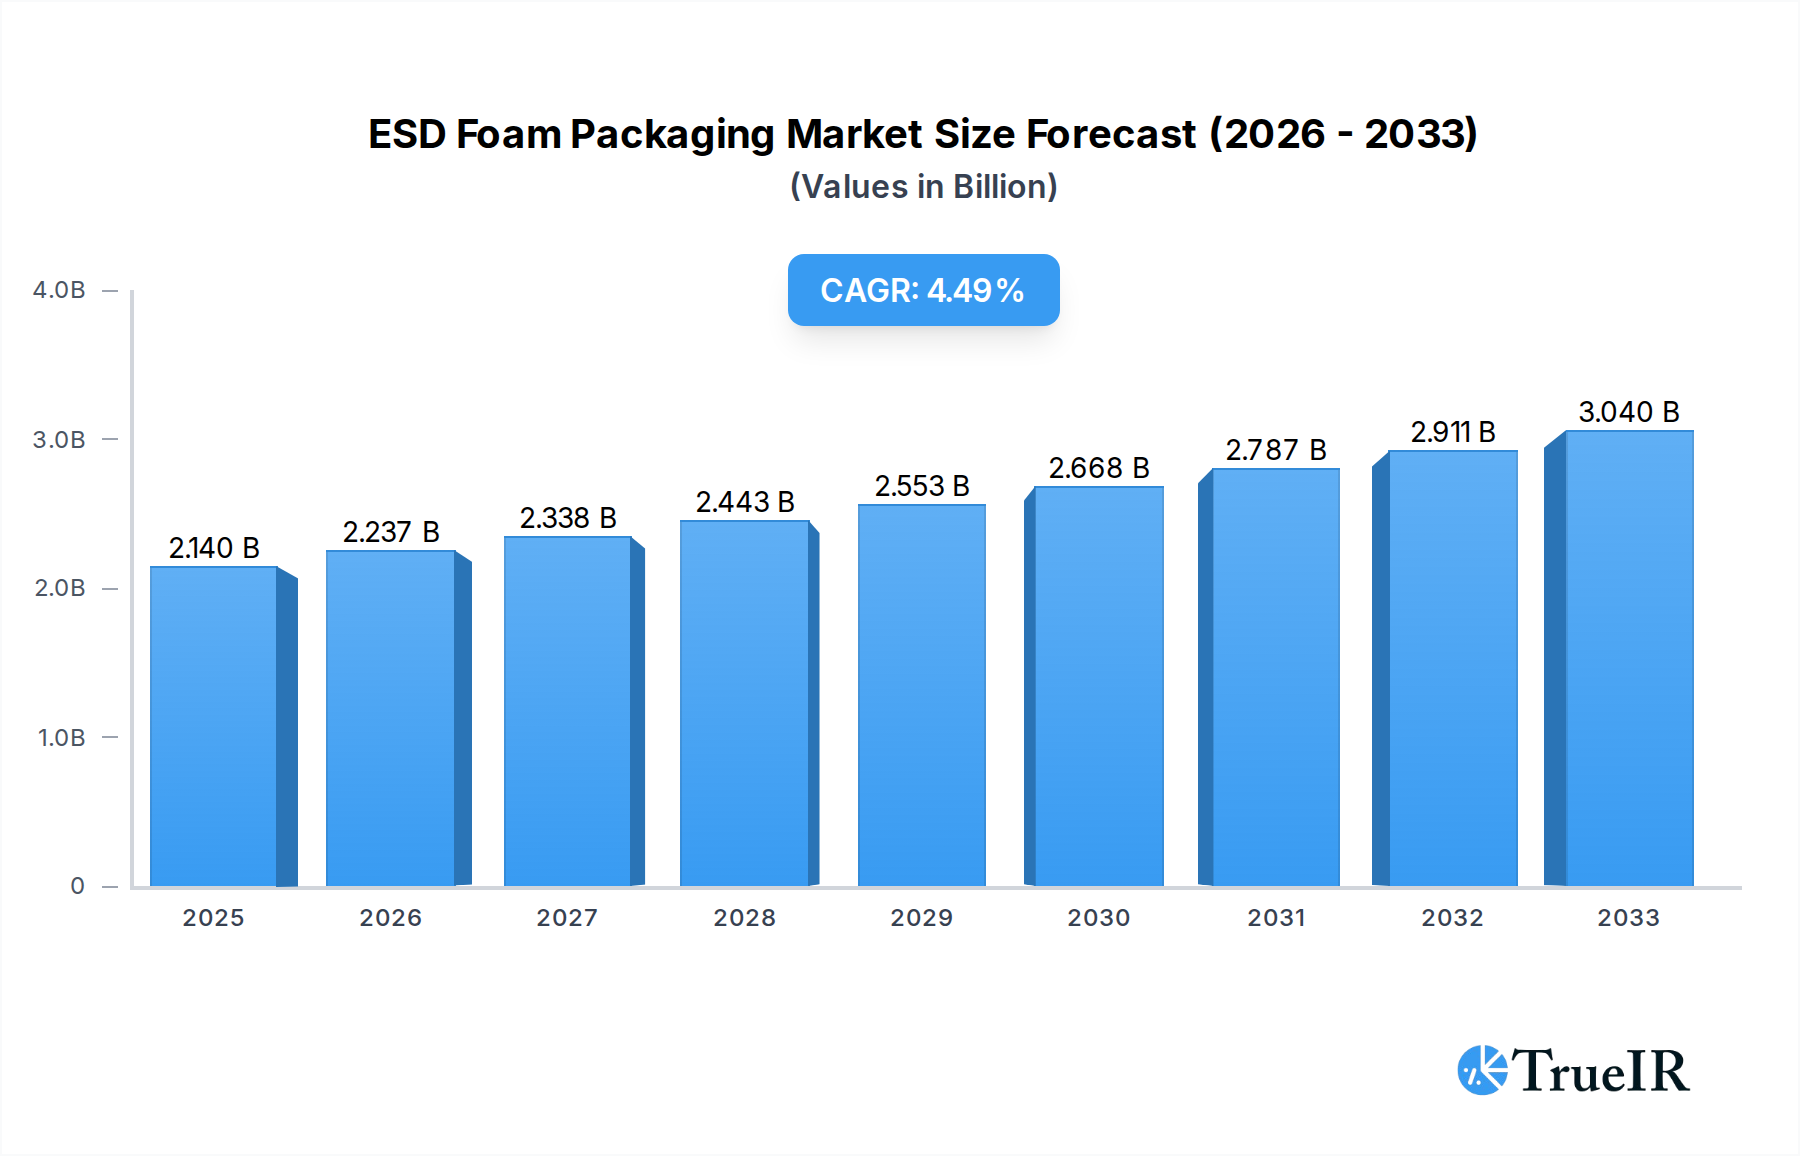
ESD Foam Packaging Market Size (In Billion)
The market is characterized by a dynamic interplay of trends and restraints. The proliferation of conductive and dissipative polymer-based ESD foams highlights a shift towards more advanced and efficient protective materials. Simultaneously, the automotive industry's increasing reliance on intricate electronic control units (ECUs) and advanced driver-assistance systems (ADAS) presents a substantial growth avenue. However, challenges such as the fluctuating costs of raw materials and the development of more sophisticated, albeit expensive, alternative protection methods could temper the market's pace. Despite these considerations, the unwavering commitment to safeguarding sensitive electronics, coupled with ongoing innovation in material science and packaging design, ensures a promising outlook for the ESD foam packaging market. Major players like Nefab, Tekins, and Elcom are actively investing in research and development to cater to evolving industry needs and maintain a competitive edge.

ESD Foam Packaging Company Market Share
ESD Foam Packaging Market Report: Comprehensive Analysis and Future Outlook (2019-2033)
This comprehensive report delves into the global ESD (Electrostatic Discharge) Foam Packaging market, providing an in-depth analysis of its structure, trends, opportunities, and competitive landscape. Covering the period from 2019 to 2033, with a base year of 2025 and a forecast period extending to 2033, this report offers actionable insights for stakeholders across various industries. The market is projected to witness substantial growth driven by the increasing demand for sensitive electronic component protection.
ESD Foam Packaging Market Structure & Competitive Landscape
The global ESD foam packaging market, projected to reach a valuation of over 10 billion by 2033, exhibits a moderately concentrated structure with a blend of established global players and emerging regional manufacturers. Key companies such as Nefab, Tekins, Elcom, GWP Group, Botron, Conductive Containers, Helios, Electrotek, and Statclean are actively shaping the competitive environment through continuous innovation and strategic expansions. Innovation drivers are primarily fueled by the escalating need for enhanced static protection in miniaturized electronic devices and the stringent requirements of industries like aerospace and defense. Regulatory impacts, particularly concerning environmental sustainability and material safety, are increasingly influencing product development and manufacturing processes. Product substitutes, though limited in offering equivalent static dissipation properties, are being developed, posing a potential long-term challenge. End-user segmentation reveals a strong reliance on the Electrical and Electronics sector, followed by Automotive and Aerospace. Mergers and acquisitions (M&A) activity, estimated at over 50 billion in deal value over the historical period, reflects consolidation and strategic realignment among key players to gain market share and technological prowess. Concentration ratios in key segments are estimated to be in the range of 0.6 to 0.8, indicating a healthy competitive dynamic.
ESD Foam Packaging Market Trends & Opportunities
The ESD foam packaging market is on a robust growth trajectory, with a projected Compound Annual Growth Rate (CAGR) of approximately 7.5% during the forecast period (2025-2033). This expansion is underpinned by a confluence of critical trends and emerging opportunities. The relentless miniaturization and increasing complexity of electronic components across sectors like consumer electronics, telecommunications, and computing necessitate advanced protective solutions against electrostatic discharge, a primary driver of market growth. The Electrical and Electronics segment, currently commanding over 40% of the market share, is expected to continue its dominance due to the high volume of sensitive components being manufactured and transported globally. The Automotive industry is another significant growth engine, with the increasing integration of electronic systems in vehicles driving demand for ESD-safe packaging solutions for components like sensors, control units, and infotainment systems. The adoption of electric vehicles (EVs) further amplifies this trend due to the high-power electronic components involved.
Technological shifts are also playing a pivotal role. Advancements in material science have led to the development of novel conductive and dissipative polymer formulations, offering superior static protection, reduced weight, and improved durability. These materials are increasingly replacing traditional packaging solutions, even in demanding applications like aerospace and defense. The development of specialized ESD foam with tailored properties, such as cushioning, vibration dampening, and enhanced conductivity, caters to niche requirements and opens up new application avenues.
Consumer preferences, while indirectly influencing the market, are geared towards products that are reliably protected throughout the supply chain, ensuring optimal performance upon arrival. This translates into a demand for high-quality, dependable ESD packaging solutions. Competitive dynamics are characterized by a focus on product differentiation, cost-effectiveness, and the ability to provide customized packaging solutions. Companies are investing heavily in research and development to offer innovative products that meet evolving industry standards and customer expectations.
Market penetration rates for ESD foam packaging are steadily increasing across various industries, driven by a growing awareness of the detrimental effects of static discharge and the associated financial losses from component damage. The "Others" segment, encompassing medical devices, industrial automation, and defense, is also showing promising growth, fueled by stringent regulatory requirements and the critical nature of the components handled. The global market size, estimated to exceed 8 billion in the base year of 2025, is poised for substantial expansion, offering significant opportunities for market players to capitalize on.
Dominant Markets & Segments in ESD Foam Packaging
The Electrical and Electronics segment stands as the undisputed leader in the ESD foam packaging market, its dominance driven by the sheer volume and sensitivity of components manufactured and distributed within this sector. The robust growth of the global electronics industry, coupled with the increasing complexity and miniaturization of devices, directly translates into a higher demand for effective ESD protection. Key growth drivers within this segment include:
- High Production Volumes: Countries with significant electronics manufacturing hubs, such as China, South Korea, Taiwan, and the United States, are major consumers of ESD foam packaging.
- Technological Advancements: The continuous innovation in semiconductors, integrated circuits, and other electronic components necessitates advanced protective solutions to prevent damage from electrostatic discharge.
- Stringent Quality Control: To ensure product reliability and customer satisfaction, manufacturers are investing in high-quality ESD packaging solutions that meet rigorous industry standards.
The Automobile segment is another significant contributor to the ESD foam packaging market. The automotive industry's increasing reliance on sophisticated electronic control units (ECUs), sensors, and advanced driver-assistance systems (ADAS) makes them highly susceptible to static damage. The burgeoning electric vehicle (EV) market further accelerates this trend, as EVs are equipped with more complex and powerful electronic systems.
- EV Adoption: The global shift towards electric mobility is a major catalyst, driving demand for ESD packaging for high-voltage batteries, power electronics, and charging components.
- Automotive Supply Chain Complexity: The intricate global supply chain for automotive components requires reliable packaging to protect sensitive electronics during transit and handling.
- Safety Regulations: Increasing emphasis on vehicle safety and reliability mandates stringent protection for all electronic components.
The Aerospace and Defense sectors also represent crucial, albeit niche, markets for ESD foam packaging. The extreme sensitivity of avionics, guidance systems, and other critical defense hardware to ESD, coupled with the high cost of these components, makes robust ESD protection paramount.
- Critical Component Protection: The need to safeguard highly specialized and expensive electronic systems against electrostatic discharge is non-negotiable.
- Harsh Environment Requirements: ESD foam packaging for these sectors often needs to meet additional requirements, such as resistance to extreme temperatures and vibration.
Geographically, Asia Pacific is the dominant region, driven by its position as a global manufacturing hub for electronics and automotive components. Countries like China, Japan, and South Korea are key markets. North America and Europe also hold significant market share due to the presence of advanced manufacturing facilities and stringent quality standards in their respective automotive, aerospace, and defense industries.
In terms of Types, Conductive and Dissipative Polymer ESD foam packaging accounts for the largest market share. These materials offer a superior balance of conductivity, dissipativity, and mechanical properties, making them ideal for a wide range of applications.
- Advanced Material Properties: Conductive and dissipative polymers provide excellent static shielding and charge dissipation capabilities, crucial for protecting sensitive electronics.
- Versatility: These materials can be molded into various shapes and sizes, catering to diverse packaging needs.
- Growing R&D: Continuous research and development in polymer science are leading to enhanced formulations with improved performance characteristics.
ESD Foam Packaging Product Analysis
Recent product innovations in ESD foam packaging are primarily focused on enhancing static dissipation efficiency, improving cushioning properties, and developing more sustainable materials. Companies are introducing multi-layer foams that combine different electrostatic properties for optimized protection. Applications are expanding beyond traditional electronics to include sensitive medical devices, industrial automation components, and advanced scientific instrumentation. Competitive advantages are being forged through superior material science, customization capabilities to meet specific client needs, and adherence to international ESD standards. Technological advancements are leading to lighter, more durable, and cost-effective ESD foam solutions.
Key Drivers, Barriers & Challenges in ESD Foam Packaging
The ESD foam packaging market is propelled by several key drivers. The escalating demand for miniaturized and sensitive electronic devices across various industries is a primary growth catalyst. Stringent regulations and industry standards mandating ESD protection further bolster market growth. Technological advancements in material science, leading to improved performance and cost-effectiveness of ESD foams, also play a crucial role. The expanding global electronics and automotive manufacturing sectors contribute significantly to market expansion.
However, the market faces several barriers and challenges. The relatively high cost of specialized ESD foam packaging compared to conventional alternatives can be a restraint for some smaller enterprises. Supply chain disruptions, particularly those impacting raw material availability and logistics, pose a significant challenge. Intense competition from established players and the emergence of new entrants can lead to price pressures. Furthermore, the need for continuous innovation to keep pace with evolving technological demands and stringent performance requirements presents an ongoing challenge.
Growth Drivers in the ESD Foam Packaging Market
The ESD foam packaging market's growth is significantly driven by the insatiable demand for sophisticated electronic components across a multitude of industries. The continuous advancement in the size and complexity of these components, particularly in the electrical and electronics, automotive, and aerospace sectors, inherently increases their susceptibility to electrostatic discharge, necessitating advanced protective packaging. Regulatory mandates from organizations like the IEC and ANSI, which define strict standards for electrostatic discharge protection, further compel manufacturers to adopt high-quality ESD foam solutions. Technological innovations in material science, leading to the development of novel conductive and dissipative polymers, are enhancing the performance and cost-effectiveness of ESD foams, making them more accessible and desirable. The burgeoning global manufacturing output, especially in Asia Pacific, coupled with a growing awareness of the financial implications of ESD-related component failures, acts as a substantial growth impetus.
Challenges Impacting ESD Foam Packaging Growth
Despite its robust growth, the ESD foam packaging market grapples with several inherent challenges. The initial investment in specialized ESD foam packaging can be a barrier for smaller businesses or those operating in cost-sensitive segments, compared to generic packaging solutions. Fluctuations in the cost and availability of raw materials, such as specialized polymers and conductive additives, can impact production costs and lead times, creating supply chain vulnerabilities. The highly competitive nature of the market, with numerous global and regional players, often leads to intense price wars and margin pressures. Furthermore, keeping pace with the rapid pace of technological evolution in the electronics industry requires continuous research and development efforts to ensure ESD packaging solutions remain effective against increasingly sensitive and complex components, presenting a constant challenge to maintain relevance and a competitive edge.
Key Players Shaping the ESD Foam Packaging Market
- Nefab
- Tekins
- Elcom
- GWP Group
- Botron
- Conductive Containers
- Helios
- Electrotek
- Statclean
Significant ESD Foam Packaging Industry Milestones
- 2019: Increased adoption of sustainable ESD packaging materials driven by growing environmental concerns and regulatory pushes.
- 2020: Surge in demand for ESD packaging for medical devices due to the COVID-19 pandemic and increased production of sensitive medical equipment.
- 2021: Introduction of advanced conductive polymer foams offering enhanced shielding and dissipating properties.
- 2022: Mergers and acquisitions activity consolidates market share among key players, focusing on technological integration and expanded product portfolios.
- 2023: Development of smart ESD packaging solutions integrating sensors for real-time monitoring of environmental conditions and electrostatic charge.
- 2024: Growing emphasis on customizable ESD foam solutions tailored to specific application requirements and component geometries.
Future Outlook for ESD Foam Packaging Market
The future outlook for the ESD foam packaging market remains exceptionally bright, driven by sustained innovation and expanding application horizons. Strategic opportunities lie in the continued development of bio-based and recyclable ESD foam materials to address environmental concerns and meet evolving regulatory requirements. The increasing integration of 5G technology, AI-powered devices, and the expansion of the Internet of Things (IoT) will fuel demand for more sophisticated and reliable ESD protection for a wider array of electronic components. The growing global emphasis on supply chain resilience will also underscore the importance of high-performance ESD packaging in safeguarding valuable and sensitive goods. Market potential is significant in emerging economies as their manufacturing sectors mature and increasingly adopt advanced technologies, further solidifying the indispensable role of ESD foam packaging in the global industrial landscape.
ESD Foam Packaging Segmentation
-
1. Application
- 1.1. Electrical and Electronics
- 1.2. Automobile
- 1.3. Defense and Military
- 1.4. Manufacturing
- 1.5. Aerospace
- 1.6. Others
-
2. Types
- 2.1. Conductive and Dissipative Polymer
- 2.2. Metal
- 2.3. Additive
ESD Foam Packaging Segmentation By Geography
-
1. North America
- 1.1. United States
- 1.2. Canada
- 1.3. Mexico
-
2. South America
- 2.1. Brazil
- 2.2. Argentina
- 2.3. Rest of South America
-
3. Europe
- 3.1. United Kingdom
- 3.2. Germany
- 3.3. France
- 3.4. Italy
- 3.5. Spain
- 3.6. Russia
- 3.7. Benelux
- 3.8. Nordics
- 3.9. Rest of Europe
-
4. Middle East & Africa
- 4.1. Turkey
- 4.2. Israel
- 4.3. GCC
- 4.4. North Africa
- 4.5. South Africa
- 4.6. Rest of Middle East & Africa
-
5. Asia Pacific
- 5.1. China
- 5.2. India
- 5.3. Japan
- 5.4. South Korea
- 5.5. ASEAN
- 5.6. Oceania
- 5.7. Rest of Asia Pacific
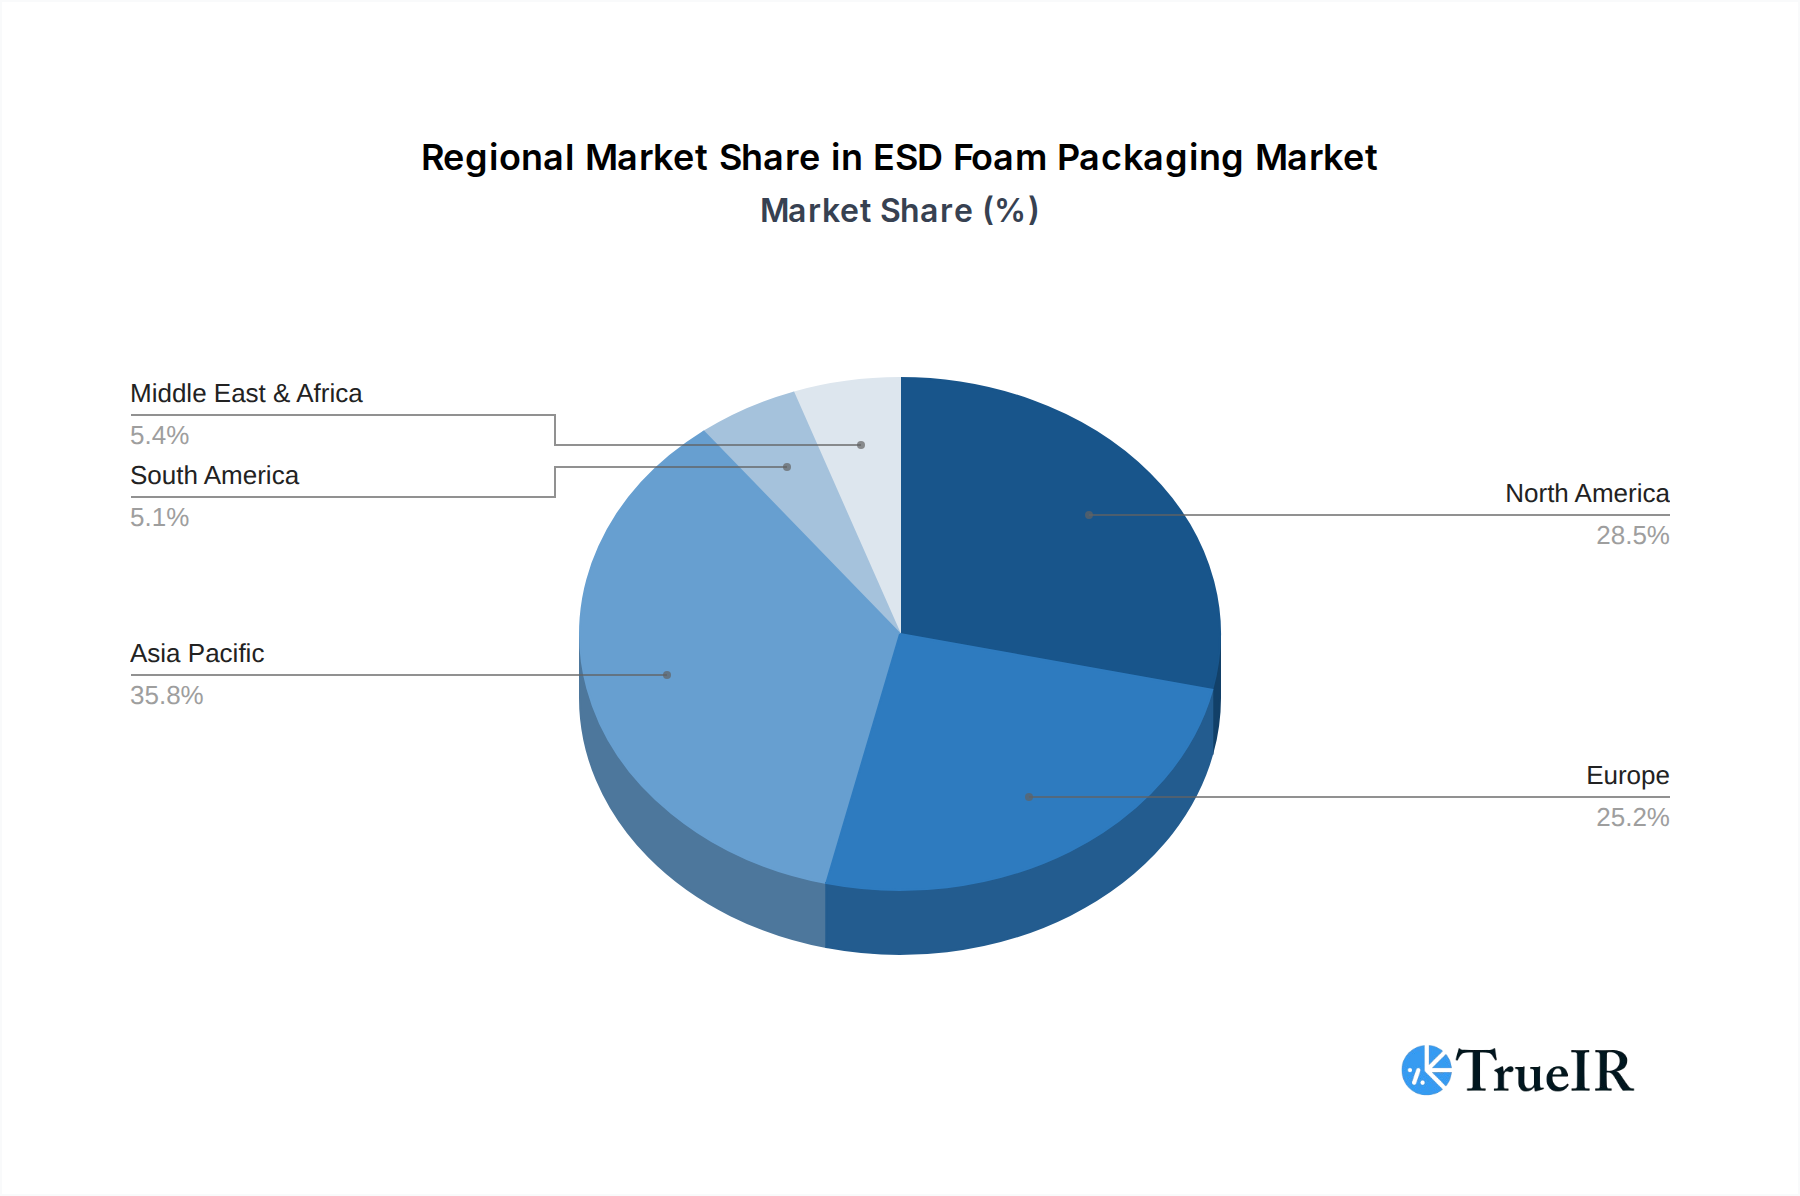
ESD Foam Packaging Regional Market Share
Geographic Coverage of ESD Foam Packaging
ESD Foam Packaging REPORT HIGHLIGHTS
| Aspects | Details |
|---|---|
| Study Period | 2020-2034 |
| Base Year | 2025 |
| Estimated Year | 2026 |
| Forecast Period | 2026-2034 |
| Historical Period | 2020-2025 |
| Growth Rate | CAGR of 4.54% from 2020-2034 |
| Segmentation |
|
Table of Contents
- 1. Introduction
- 1.1. Research Scope
- 1.2. Market Segmentation
- 1.3. Research Objective
- 1.4. Definitions and Assumptions
- 2. Executive Summary
- 2.1. Market Snapshot
- 3. Market Dynamics
- 3.1. Market Drivers
- 3.2. Market Restrains
- 3.3. Market Trends
- 3.4. Market Opportunities
- 4. Market Factor Analysis
- 4.1. Porters Five Forces
- 4.1.1. Bargaining Power of Suppliers
- 4.1.2. Bargaining Power of Buyers
- 4.1.3. Threat of New Entrants
- 4.1.4. Threat of Substitutes
- 4.1.5. Competitive Rivalry
- 4.2. PESTEL analysis
- 4.3. BCG Analysis
- 4.3.1. Stars (High Growth, High Market Share)
- 4.3.2. Cash Cows (Low Growth, High Market Share)
- 4.3.3. Question Mark (High Growth, Low Market Share)
- 4.3.4. Dogs (Low Growth, Low Market Share)
- 4.4. Ansoff Matrix Analysis
- 4.5. Supply Chain Analysis
- 4.6. Regulatory Landscape
- 4.7. Current Market Potential and Opportunity Assessment (TAM–SAM–SOM Framework)
- 4.8. TIR Analyst Note
- 4.1. Porters Five Forces
- 5. Market Analysis, Insights and Forecast 2021-2033
- 5.1. Market Analysis, Insights and Forecast - by Application
- 5.1.1. Electrical and Electronics
- 5.1.2. Automobile
- 5.1.3. Defense and Military
- 5.1.4. Manufacturing
- 5.1.5. Aerospace
- 5.1.6. Others
- 5.2. Market Analysis, Insights and Forecast - by Types
- 5.2.1. Conductive and Dissipative Polymer
- 5.2.2. Metal
- 5.2.3. Additive
- 5.3. Market Analysis, Insights and Forecast - by Region
- 5.3.1. North America
- 5.3.2. South America
- 5.3.3. Europe
- 5.3.4. Middle East & Africa
- 5.3.5. Asia Pacific
- 5.1. Market Analysis, Insights and Forecast - by Application
- 6. Global ESD Foam Packaging Analysis, Insights and Forecast, 2021-2033
- 6.1. Market Analysis, Insights and Forecast - by Application
- 6.1.1. Electrical and Electronics
- 6.1.2. Automobile
- 6.1.3. Defense and Military
- 6.1.4. Manufacturing
- 6.1.5. Aerospace
- 6.1.6. Others
- 6.2. Market Analysis, Insights and Forecast - by Types
- 6.2.1. Conductive and Dissipative Polymer
- 6.2.2. Metal
- 6.2.3. Additive
- 6.1. Market Analysis, Insights and Forecast - by Application
- 7. North America ESD Foam Packaging Analysis, Insights and Forecast, 2020-2032
- 7.1. Market Analysis, Insights and Forecast - by Application
- 7.1.1. Electrical and Electronics
- 7.1.2. Automobile
- 7.1.3. Defense and Military
- 7.1.4. Manufacturing
- 7.1.5. Aerospace
- 7.1.6. Others
- 7.2. Market Analysis, Insights and Forecast - by Types
- 7.2.1. Conductive and Dissipative Polymer
- 7.2.2. Metal
- 7.2.3. Additive
- 7.1. Market Analysis, Insights and Forecast - by Application
- 8. South America ESD Foam Packaging Analysis, Insights and Forecast, 2020-2032
- 8.1. Market Analysis, Insights and Forecast - by Application
- 8.1.1. Electrical and Electronics
- 8.1.2. Automobile
- 8.1.3. Defense and Military
- 8.1.4. Manufacturing
- 8.1.5. Aerospace
- 8.1.6. Others
- 8.2. Market Analysis, Insights and Forecast - by Types
- 8.2.1. Conductive and Dissipative Polymer
- 8.2.2. Metal
- 8.2.3. Additive
- 8.1. Market Analysis, Insights and Forecast - by Application
- 9. Europe ESD Foam Packaging Analysis, Insights and Forecast, 2020-2032
- 9.1. Market Analysis, Insights and Forecast - by Application
- 9.1.1. Electrical and Electronics
- 9.1.2. Automobile
- 9.1.3. Defense and Military
- 9.1.4. Manufacturing
- 9.1.5. Aerospace
- 9.1.6. Others
- 9.2. Market Analysis, Insights and Forecast - by Types
- 9.2.1. Conductive and Dissipative Polymer
- 9.2.2. Metal
- 9.2.3. Additive
- 9.1. Market Analysis, Insights and Forecast - by Application
- 10. Middle East & Africa ESD Foam Packaging Analysis, Insights and Forecast, 2020-2032
- 10.1. Market Analysis, Insights and Forecast - by Application
- 10.1.1. Electrical and Electronics
- 10.1.2. Automobile
- 10.1.3. Defense and Military
- 10.1.4. Manufacturing
- 10.1.5. Aerospace
- 10.1.6. Others
- 10.2. Market Analysis, Insights and Forecast - by Types
- 10.2.1. Conductive and Dissipative Polymer
- 10.2.2. Metal
- 10.2.3. Additive
- 10.1. Market Analysis, Insights and Forecast - by Application
- 11. Asia Pacific ESD Foam Packaging Analysis, Insights and Forecast, 2020-2032
- 11.1. Market Analysis, Insights and Forecast - by Application
- 11.1.1. Electrical and Electronics
- 11.1.2. Automobile
- 11.1.3. Defense and Military
- 11.1.4. Manufacturing
- 11.1.5. Aerospace
- 11.1.6. Others
- 11.2. Market Analysis, Insights and Forecast - by Types
- 11.2.1. Conductive and Dissipative Polymer
- 11.2.2. Metal
- 11.2.3. Additive
- 11.1. Market Analysis, Insights and Forecast - by Application
- 12. Competitive Analysis
- 12.1. Company Profiles
- 12.1.1 Nefab
- 12.1.1.1. Company Overview
- 12.1.1.2. Products
- 12.1.1.3. Company Financials
- 12.1.1.4. SWOT Analysis
- 12.1.2 Tekins
- 12.1.2.1. Company Overview
- 12.1.2.2. Products
- 12.1.2.3. Company Financials
- 12.1.2.4. SWOT Analysis
- 12.1.3 Elcom
- 12.1.3.1. Company Overview
- 12.1.3.2. Products
- 12.1.3.3. Company Financials
- 12.1.3.4. SWOT Analysis
- 12.1.4 GWP Group
- 12.1.4.1. Company Overview
- 12.1.4.2. Products
- 12.1.4.3. Company Financials
- 12.1.4.4. SWOT Analysis
- 12.1.5 Botron
- 12.1.5.1. Company Overview
- 12.1.5.2. Products
- 12.1.5.3. Company Financials
- 12.1.5.4. SWOT Analysis
- 12.1.6 Conductive Containers
- 12.1.6.1. Company Overview
- 12.1.6.2. Products
- 12.1.6.3. Company Financials
- 12.1.6.4. SWOT Analysis
- 12.1.7 Helios
- 12.1.7.1. Company Overview
- 12.1.7.2. Products
- 12.1.7.3. Company Financials
- 12.1.7.4. SWOT Analysis
- 12.1.8 Electrotek
- 12.1.8.1. Company Overview
- 12.1.8.2. Products
- 12.1.8.3. Company Financials
- 12.1.8.4. SWOT Analysis
- 12.1.9 Statclean
- 12.1.9.1. Company Overview
- 12.1.9.2. Products
- 12.1.9.3. Company Financials
- 12.1.9.4. SWOT Analysis
- 12.1.1 Nefab
- 12.2. Market Entropy
- 12.2.1 Company's Key Areas Served
- 12.2.2 Recent Developments
- 12.3. Company Market Share Analysis 2025
- 12.3.1 Top 5 Companies Market Share Analysis
- 12.3.2 Top 3 Companies Market Share Analysis
- 12.4. List of Potential Customers
- 13. Research Methodology
List of Figures
- Figure 1: Global ESD Foam Packaging Revenue Breakdown (undefined, %) by Region 2025 & 2033
- Figure 2: Global ESD Foam Packaging Volume Breakdown (K, %) by Region 2025 & 2033
- Figure 3: North America ESD Foam Packaging Revenue (undefined), by Application 2025 & 2033
- Figure 4: North America ESD Foam Packaging Volume (K), by Application 2025 & 2033
- Figure 5: North America ESD Foam Packaging Revenue Share (%), by Application 2025 & 2033
- Figure 6: North America ESD Foam Packaging Volume Share (%), by Application 2025 & 2033
- Figure 7: North America ESD Foam Packaging Revenue (undefined), by Types 2025 & 2033
- Figure 8: North America ESD Foam Packaging Volume (K), by Types 2025 & 2033
- Figure 9: North America ESD Foam Packaging Revenue Share (%), by Types 2025 & 2033
- Figure 10: North America ESD Foam Packaging Volume Share (%), by Types 2025 & 2033
- Figure 11: North America ESD Foam Packaging Revenue (undefined), by Country 2025 & 2033
- Figure 12: North America ESD Foam Packaging Volume (K), by Country 2025 & 2033
- Figure 13: North America ESD Foam Packaging Revenue Share (%), by Country 2025 & 2033
- Figure 14: North America ESD Foam Packaging Volume Share (%), by Country 2025 & 2033
- Figure 15: South America ESD Foam Packaging Revenue (undefined), by Application 2025 & 2033
- Figure 16: South America ESD Foam Packaging Volume (K), by Application 2025 & 2033
- Figure 17: South America ESD Foam Packaging Revenue Share (%), by Application 2025 & 2033
- Figure 18: South America ESD Foam Packaging Volume Share (%), by Application 2025 & 2033
- Figure 19: South America ESD Foam Packaging Revenue (undefined), by Types 2025 & 2033
- Figure 20: South America ESD Foam Packaging Volume (K), by Types 2025 & 2033
- Figure 21: South America ESD Foam Packaging Revenue Share (%), by Types 2025 & 2033
- Figure 22: South America ESD Foam Packaging Volume Share (%), by Types 2025 & 2033
- Figure 23: South America ESD Foam Packaging Revenue (undefined), by Country 2025 & 2033
- Figure 24: South America ESD Foam Packaging Volume (K), by Country 2025 & 2033
- Figure 25: South America ESD Foam Packaging Revenue Share (%), by Country 2025 & 2033
- Figure 26: South America ESD Foam Packaging Volume Share (%), by Country 2025 & 2033
- Figure 27: Europe ESD Foam Packaging Revenue (undefined), by Application 2025 & 2033
- Figure 28: Europe ESD Foam Packaging Volume (K), by Application 2025 & 2033
- Figure 29: Europe ESD Foam Packaging Revenue Share (%), by Application 2025 & 2033
- Figure 30: Europe ESD Foam Packaging Volume Share (%), by Application 2025 & 2033
- Figure 31: Europe ESD Foam Packaging Revenue (undefined), by Types 2025 & 2033
- Figure 32: Europe ESD Foam Packaging Volume (K), by Types 2025 & 2033
- Figure 33: Europe ESD Foam Packaging Revenue Share (%), by Types 2025 & 2033
- Figure 34: Europe ESD Foam Packaging Volume Share (%), by Types 2025 & 2033
- Figure 35: Europe ESD Foam Packaging Revenue (undefined), by Country 2025 & 2033
- Figure 36: Europe ESD Foam Packaging Volume (K), by Country 2025 & 2033
- Figure 37: Europe ESD Foam Packaging Revenue Share (%), by Country 2025 & 2033
- Figure 38: Europe ESD Foam Packaging Volume Share (%), by Country 2025 & 2033
- Figure 39: Middle East & Africa ESD Foam Packaging Revenue (undefined), by Application 2025 & 2033
- Figure 40: Middle East & Africa ESD Foam Packaging Volume (K), by Application 2025 & 2033
- Figure 41: Middle East & Africa ESD Foam Packaging Revenue Share (%), by Application 2025 & 2033
- Figure 42: Middle East & Africa ESD Foam Packaging Volume Share (%), by Application 2025 & 2033
- Figure 43: Middle East & Africa ESD Foam Packaging Revenue (undefined), by Types 2025 & 2033
- Figure 44: Middle East & Africa ESD Foam Packaging Volume (K), by Types 2025 & 2033
- Figure 45: Middle East & Africa ESD Foam Packaging Revenue Share (%), by Types 2025 & 2033
- Figure 46: Middle East & Africa ESD Foam Packaging Volume Share (%), by Types 2025 & 2033
- Figure 47: Middle East & Africa ESD Foam Packaging Revenue (undefined), by Country 2025 & 2033
- Figure 48: Middle East & Africa ESD Foam Packaging Volume (K), by Country 2025 & 2033
- Figure 49: Middle East & Africa ESD Foam Packaging Revenue Share (%), by Country 2025 & 2033
- Figure 50: Middle East & Africa ESD Foam Packaging Volume Share (%), by Country 2025 & 2033
- Figure 51: Asia Pacific ESD Foam Packaging Revenue (undefined), by Application 2025 & 2033
- Figure 52: Asia Pacific ESD Foam Packaging Volume (K), by Application 2025 & 2033
- Figure 53: Asia Pacific ESD Foam Packaging Revenue Share (%), by Application 2025 & 2033
- Figure 54: Asia Pacific ESD Foam Packaging Volume Share (%), by Application 2025 & 2033
- Figure 55: Asia Pacific ESD Foam Packaging Revenue (undefined), by Types 2025 & 2033
- Figure 56: Asia Pacific ESD Foam Packaging Volume (K), by Types 2025 & 2033
- Figure 57: Asia Pacific ESD Foam Packaging Revenue Share (%), by Types 2025 & 2033
- Figure 58: Asia Pacific ESD Foam Packaging Volume Share (%), by Types 2025 & 2033
- Figure 59: Asia Pacific ESD Foam Packaging Revenue (undefined), by Country 2025 & 2033
- Figure 60: Asia Pacific ESD Foam Packaging Volume (K), by Country 2025 & 2033
- Figure 61: Asia Pacific ESD Foam Packaging Revenue Share (%), by Country 2025 & 2033
- Figure 62: Asia Pacific ESD Foam Packaging Volume Share (%), by Country 2025 & 2033
List of Tables
- Table 1: Global ESD Foam Packaging Revenue undefined Forecast, by Application 2020 & 2033
- Table 2: Global ESD Foam Packaging Volume K Forecast, by Application 2020 & 2033
- Table 3: Global ESD Foam Packaging Revenue undefined Forecast, by Types 2020 & 2033
- Table 4: Global ESD Foam Packaging Volume K Forecast, by Types 2020 & 2033
- Table 5: Global ESD Foam Packaging Revenue undefined Forecast, by Region 2020 & 2033
- Table 6: Global ESD Foam Packaging Volume K Forecast, by Region 2020 & 2033
- Table 7: Global ESD Foam Packaging Revenue undefined Forecast, by Application 2020 & 2033
- Table 8: Global ESD Foam Packaging Volume K Forecast, by Application 2020 & 2033
- Table 9: Global ESD Foam Packaging Revenue undefined Forecast, by Types 2020 & 2033
- Table 10: Global ESD Foam Packaging Volume K Forecast, by Types 2020 & 2033
- Table 11: Global ESD Foam Packaging Revenue undefined Forecast, by Country 2020 & 2033
- Table 12: Global ESD Foam Packaging Volume K Forecast, by Country 2020 & 2033
- Table 13: United States ESD Foam Packaging Revenue (undefined) Forecast, by Application 2020 & 2033
- Table 14: United States ESD Foam Packaging Volume (K) Forecast, by Application 2020 & 2033
- Table 15: Canada ESD Foam Packaging Revenue (undefined) Forecast, by Application 2020 & 2033
- Table 16: Canada ESD Foam Packaging Volume (K) Forecast, by Application 2020 & 2033
- Table 17: Mexico ESD Foam Packaging Revenue (undefined) Forecast, by Application 2020 & 2033
- Table 18: Mexico ESD Foam Packaging Volume (K) Forecast, by Application 2020 & 2033
- Table 19: Global ESD Foam Packaging Revenue undefined Forecast, by Application 2020 & 2033
- Table 20: Global ESD Foam Packaging Volume K Forecast, by Application 2020 & 2033
- Table 21: Global ESD Foam Packaging Revenue undefined Forecast, by Types 2020 & 2033
- Table 22: Global ESD Foam Packaging Volume K Forecast, by Types 2020 & 2033
- Table 23: Global ESD Foam Packaging Revenue undefined Forecast, by Country 2020 & 2033
- Table 24: Global ESD Foam Packaging Volume K Forecast, by Country 2020 & 2033
- Table 25: Brazil ESD Foam Packaging Revenue (undefined) Forecast, by Application 2020 & 2033
- Table 26: Brazil ESD Foam Packaging Volume (K) Forecast, by Application 2020 & 2033
- Table 27: Argentina ESD Foam Packaging Revenue (undefined) Forecast, by Application 2020 & 2033
- Table 28: Argentina ESD Foam Packaging Volume (K) Forecast, by Application 2020 & 2033
- Table 29: Rest of South America ESD Foam Packaging Revenue (undefined) Forecast, by Application 2020 & 2033
- Table 30: Rest of South America ESD Foam Packaging Volume (K) Forecast, by Application 2020 & 2033
- Table 31: Global ESD Foam Packaging Revenue undefined Forecast, by Application 2020 & 2033
- Table 32: Global ESD Foam Packaging Volume K Forecast, by Application 2020 & 2033
- Table 33: Global ESD Foam Packaging Revenue undefined Forecast, by Types 2020 & 2033
- Table 34: Global ESD Foam Packaging Volume K Forecast, by Types 2020 & 2033
- Table 35: Global ESD Foam Packaging Revenue undefined Forecast, by Country 2020 & 2033
- Table 36: Global ESD Foam Packaging Volume K Forecast, by Country 2020 & 2033
- Table 37: United Kingdom ESD Foam Packaging Revenue (undefined) Forecast, by Application 2020 & 2033
- Table 38: United Kingdom ESD Foam Packaging Volume (K) Forecast, by Application 2020 & 2033
- Table 39: Germany ESD Foam Packaging Revenue (undefined) Forecast, by Application 2020 & 2033
- Table 40: Germany ESD Foam Packaging Volume (K) Forecast, by Application 2020 & 2033
- Table 41: France ESD Foam Packaging Revenue (undefined) Forecast, by Application 2020 & 2033
- Table 42: France ESD Foam Packaging Volume (K) Forecast, by Application 2020 & 2033
- Table 43: Italy ESD Foam Packaging Revenue (undefined) Forecast, by Application 2020 & 2033
- Table 44: Italy ESD Foam Packaging Volume (K) Forecast, by Application 2020 & 2033
- Table 45: Spain ESD Foam Packaging Revenue (undefined) Forecast, by Application 2020 & 2033
- Table 46: Spain ESD Foam Packaging Volume (K) Forecast, by Application 2020 & 2033
- Table 47: Russia ESD Foam Packaging Revenue (undefined) Forecast, by Application 2020 & 2033
- Table 48: Russia ESD Foam Packaging Volume (K) Forecast, by Application 2020 & 2033
- Table 49: Benelux ESD Foam Packaging Revenue (undefined) Forecast, by Application 2020 & 2033
- Table 50: Benelux ESD Foam Packaging Volume (K) Forecast, by Application 2020 & 2033
- Table 51: Nordics ESD Foam Packaging Revenue (undefined) Forecast, by Application 2020 & 2033
- Table 52: Nordics ESD Foam Packaging Volume (K) Forecast, by Application 2020 & 2033
- Table 53: Rest of Europe ESD Foam Packaging Revenue (undefined) Forecast, by Application 2020 & 2033
- Table 54: Rest of Europe ESD Foam Packaging Volume (K) Forecast, by Application 2020 & 2033
- Table 55: Global ESD Foam Packaging Revenue undefined Forecast, by Application 2020 & 2033
- Table 56: Global ESD Foam Packaging Volume K Forecast, by Application 2020 & 2033
- Table 57: Global ESD Foam Packaging Revenue undefined Forecast, by Types 2020 & 2033
- Table 58: Global ESD Foam Packaging Volume K Forecast, by Types 2020 & 2033
- Table 59: Global ESD Foam Packaging Revenue undefined Forecast, by Country 2020 & 2033
- Table 60: Global ESD Foam Packaging Volume K Forecast, by Country 2020 & 2033
- Table 61: Turkey ESD Foam Packaging Revenue (undefined) Forecast, by Application 2020 & 2033
- Table 62: Turkey ESD Foam Packaging Volume (K) Forecast, by Application 2020 & 2033
- Table 63: Israel ESD Foam Packaging Revenue (undefined) Forecast, by Application 2020 & 2033
- Table 64: Israel ESD Foam Packaging Volume (K) Forecast, by Application 2020 & 2033
- Table 65: GCC ESD Foam Packaging Revenue (undefined) Forecast, by Application 2020 & 2033
- Table 66: GCC ESD Foam Packaging Volume (K) Forecast, by Application 2020 & 2033
- Table 67: North Africa ESD Foam Packaging Revenue (undefined) Forecast, by Application 2020 & 2033
- Table 68: North Africa ESD Foam Packaging Volume (K) Forecast, by Application 2020 & 2033
- Table 69: South Africa ESD Foam Packaging Revenue (undefined) Forecast, by Application 2020 & 2033
- Table 70: South Africa ESD Foam Packaging Volume (K) Forecast, by Application 2020 & 2033
- Table 71: Rest of Middle East & Africa ESD Foam Packaging Revenue (undefined) Forecast, by Application 2020 & 2033
- Table 72: Rest of Middle East & Africa ESD Foam Packaging Volume (K) Forecast, by Application 2020 & 2033
- Table 73: Global ESD Foam Packaging Revenue undefined Forecast, by Application 2020 & 2033
- Table 74: Global ESD Foam Packaging Volume K Forecast, by Application 2020 & 2033
- Table 75: Global ESD Foam Packaging Revenue undefined Forecast, by Types 2020 & 2033
- Table 76: Global ESD Foam Packaging Volume K Forecast, by Types 2020 & 2033
- Table 77: Global ESD Foam Packaging Revenue undefined Forecast, by Country 2020 & 2033
- Table 78: Global ESD Foam Packaging Volume K Forecast, by Country 2020 & 2033
- Table 79: China ESD Foam Packaging Revenue (undefined) Forecast, by Application 2020 & 2033
- Table 80: China ESD Foam Packaging Volume (K) Forecast, by Application 2020 & 2033
- Table 81: India ESD Foam Packaging Revenue (undefined) Forecast, by Application 2020 & 2033
- Table 82: India ESD Foam Packaging Volume (K) Forecast, by Application 2020 & 2033
- Table 83: Japan ESD Foam Packaging Revenue (undefined) Forecast, by Application 2020 & 2033
- Table 84: Japan ESD Foam Packaging Volume (K) Forecast, by Application 2020 & 2033
- Table 85: South Korea ESD Foam Packaging Revenue (undefined) Forecast, by Application 2020 & 2033
- Table 86: South Korea ESD Foam Packaging Volume (K) Forecast, by Application 2020 & 2033
- Table 87: ASEAN ESD Foam Packaging Revenue (undefined) Forecast, by Application 2020 & 2033
- Table 88: ASEAN ESD Foam Packaging Volume (K) Forecast, by Application 2020 & 2033
- Table 89: Oceania ESD Foam Packaging Revenue (undefined) Forecast, by Application 2020 & 2033
- Table 90: Oceania ESD Foam Packaging Volume (K) Forecast, by Application 2020 & 2033
- Table 91: Rest of Asia Pacific ESD Foam Packaging Revenue (undefined) Forecast, by Application 2020 & 2033
- Table 92: Rest of Asia Pacific ESD Foam Packaging Volume (K) Forecast, by Application 2020 & 2033
Frequently Asked Questions
1. What is the projected Compound Annual Growth Rate (CAGR) of the ESD Foam Packaging?
The projected CAGR is approximately 4.54%.
2. Which companies are prominent players in the ESD Foam Packaging?
Key companies in the market include Nefab, Tekins, Elcom, GWP Group, Botron, Conductive Containers, Helios, Electrotek, Statclean.
3. What are the main segments of the ESD Foam Packaging?
The market segments include Application, Types.
4. Can you provide details about the market size?
The market size is estimated to be USD XXX N/A as of 2022.
5. What are some drivers contributing to market growth?
N/A
6. What are the notable trends driving market growth?
N/A
7. Are there any restraints impacting market growth?
N/A
8. Can you provide examples of recent developments in the market?
N/A
9. What pricing options are available for accessing the report?
Pricing options include single-user, multi-user, and enterprise licenses priced at USD 3350.00, USD 5025.00, and USD 6700.00 respectively.
10. Is the market size provided in terms of value or volume?
The market size is provided in terms of value, measured in N/A and volume, measured in K.
11. Are there any specific market keywords associated with the report?
Yes, the market keyword associated with the report is "ESD Foam Packaging," which aids in identifying and referencing the specific market segment covered.
12. How do I determine which pricing option suits my needs best?
The pricing options vary based on user requirements and access needs. Individual users may opt for single-user licenses, while businesses requiring broader access may choose multi-user or enterprise licenses for cost-effective access to the report.
13. Are there any additional resources or data provided in the ESD Foam Packaging report?
While the report offers comprehensive insights, it's advisable to review the specific contents or supplementary materials provided to ascertain if additional resources or data are available.
14. How can I stay updated on further developments or reports in the ESD Foam Packaging?
To stay informed about further developments, trends, and reports in the ESD Foam Packaging, consider subscribing to industry newsletters, following relevant companies and organizations, or regularly checking reputable industry news sources and publications.
Methodology
Step 1 - Identification of Relevant Samples Size from Population Database


Step 2 - Approaches for Defining Global Market Size (Value, Volume* & Price*)

Note*: In applicable scenarios
Step 3 - Data Sources
Primary Research
- Web Analytics
- Survey Reports
- Research Institute
- Latest Research Reports
- Opinion Leaders
Secondary Research
- Annual Reports
- White Paper
- Latest Press Release
- Industry Association
- Paid Database
- Investor Presentations

Step 4 - Data Triangulation
Involves using different sources of information in order to increase the validity of a study
These sources are likely to be stakeholders in a program - participants, other researchers, program staff, other community members, and so on.
Then we put all data in single framework & apply various statistical tools to find out the dynamic on the market.
During the analysis stage, feedback from the stakeholder groups would be compared to determine areas of agreement as well as areas of divergence