
Key Insights
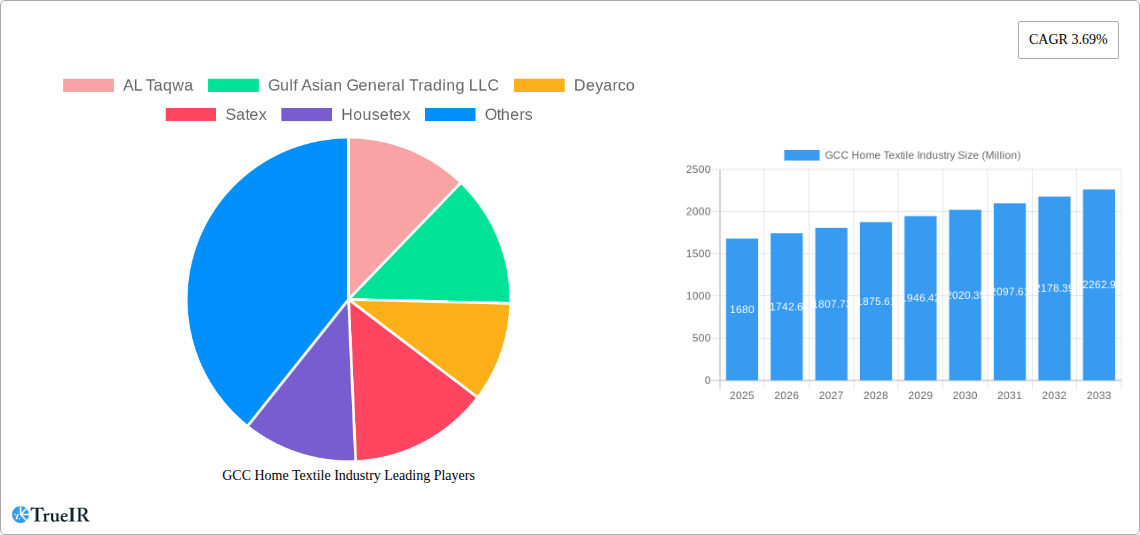
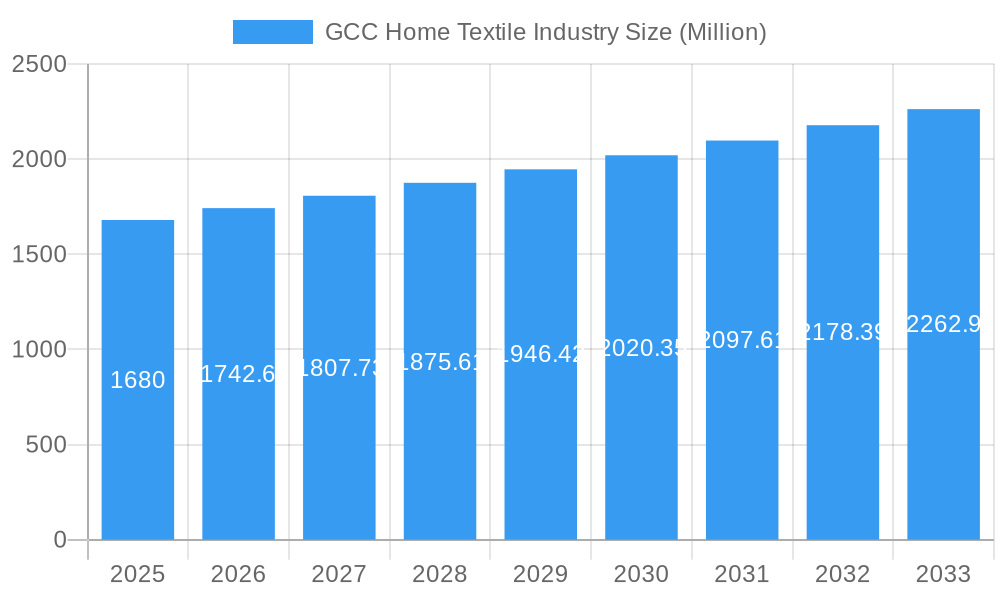
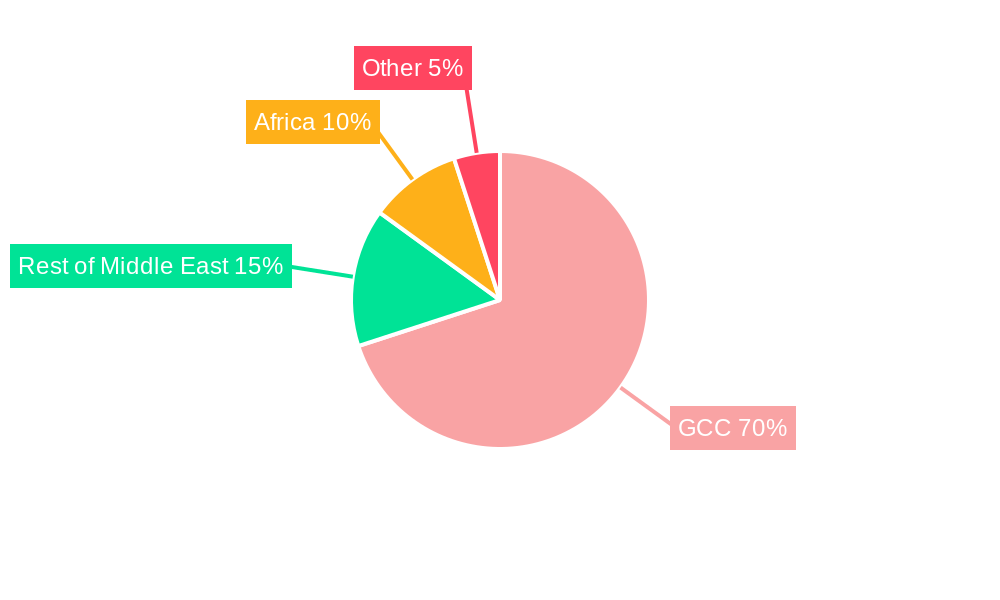
The GCC home textile industry, valued at $1.68 billion in 2025, is projected to experience steady growth, with a compound annual growth rate (CAGR) of 3.69% from 2025 to 2033. This growth is fueled by several key drivers. Rising disposable incomes within the GCC region are leading to increased spending on home furnishings and a preference for high-quality textiles. Furthermore, a burgeoning tourism sector and large-scale construction projects are creating significant demand for home textiles in hotels, resorts, and new residential developments. The increasing popularity of online shopping platforms also contributes to market expansion, providing consumers with greater convenience and access to a wider variety of products. However, the industry faces challenges, including fluctuating raw material prices and potential economic volatility impacting consumer spending. The market is segmented by product type (bed linen, bath linen, kitchen linen, upholstery, floor coverings) and distribution channel (supermarkets/hypermarkets, specialty stores, online, other channels). Leading players like Al Taqwa, Gulf Asian General Trading LLC, and Deyarco are leveraging their strong brand reputation and distribution networks to maintain market share. Growth strategies for these companies include expanding product lines, focusing on eco-friendly and sustainable products to appeal to environmentally conscious consumers, and enhancing their online presence to cater to the growing e-commerce market. The regional distribution of the market shows significant concentration within the GCC itself, with Saudi Arabia and the UAE being major consumers. However, there's potential for expansion into other regions, particularly in the Middle East and Africa, driven by increasing urbanization and changing lifestyles.
GCC Home Textile Industry Market Size (In Billion)
The competitive landscape is characterized by a mix of established players and emerging brands. Established players are focusing on innovation, introducing new product lines to meet evolving consumer preferences. This includes an increasing demand for sustainable and ethically sourced materials, a trend likely to shape the industry's future. The segment of online sales will continue to grow, demanding that companies adapt their strategies to meet consumer expectations regarding convenient online shopping and prompt delivery services. Understanding evolving consumer preferences and actively adopting sustainable practices will be crucial for success in this dynamic and increasingly competitive market. The forecast period, covering 2025-2033, presents a promising outlook, although companies must carefully navigate economic uncertainties and maintain adaptability to maintain a strong position in the long term.
GCC Home Textile Industry Company Market Share
GCC Home Textile Industry Market Report: 2019-2033
This comprehensive report provides an in-depth analysis of the GCC home textile industry, offering invaluable insights into market trends, competitive dynamics, and future growth prospects. With a study period spanning 2019-2033, a base year of 2025, and a forecast period of 2025-2033, this report is an essential resource for industry stakeholders, investors, and strategic decision-makers. The report leverages extensive data and analysis to cover all aspects of the GCC home textile market, including market size estimations (reaching XX Million by 2033), key players, and emerging trends.
GCC Home Textile Industry Market Structure & Competitive Landscape
The GCC home textile market exhibits a moderately concentrated structure, with a few major players and a large number of smaller companies. The Herfindahl-Hirschman Index (HHI) for 2024 is estimated at xx, indicating a moderately competitive landscape. Innovation is driven by factors such as changing consumer preferences towards sustainable and technologically advanced products, growing demand for luxury home textiles, and increasing disposable incomes. Regulatory frameworks, including those related to product safety and labeling, significantly influence market dynamics. Product substitutes, such as synthetic materials, pose a challenge to the natural fiber segment. The end-user market is primarily segmented by household size, income levels, and lifestyle preferences.
- Market Concentration: HHI (2024): xx; Top 5 players account for xx% of market share.
- Innovation Drivers: Sustainable materials, smart textiles, customized designs.
- Regulatory Impacts: Product safety standards, labeling requirements, import/export regulations.
- Product Substitutes: Synthetic fabrics, alternative floor coverings.
- End-User Segmentation: Based on income, household size, lifestyle.
- M&A Trends: Limited significant M&A activity in recent years, with an estimated xx Million in deal value between 2019-2024.
GCC Home Textile Industry Market Trends & Opportunities
The GCC home textile market is experiencing robust growth, driven by a combination of factors. The market size is projected to reach xx Million by 2033, exhibiting a Compound Annual Growth Rate (CAGR) of xx% during the forecast period (2025-2033). Technological advancements are leading to the introduction of innovative products with enhanced features, such as stain-resistant fabrics, temperature-regulating materials, and antimicrobial treatments. Consumer preferences are shifting towards sustainable and ethically sourced products, increasing demand for organic cotton and recycled materials. The rise of e-commerce is transforming the distribution landscape, opening new avenues for market penetration. Competitive dynamics are shaped by pricing strategies, product differentiation, and branding initiatives. The market penetration rate for online sales is projected to reach xx% by 2033.
Dominant Markets & Segments in GCC Home Textile Industry
The UAE and Saudi Arabia represent the largest markets within the GCC, driven by robust economic growth, expanding middle class, and rising disposable incomes. Within product types, bed linen holds the largest market share, followed by bath linen and upholstery. Supermarkets and hypermarkets are the dominant distribution channels, although the online segment is experiencing rapid growth.
- Key Growth Drivers: Rising disposable incomes, increasing urbanization, expanding tourism sector, supportive government policies.
UAE & Saudi Arabia Dominance: These countries account for approximately xx% of the total GCC market. Detailed analysis showcases the significant influence of factors such as increased construction activity, expanding tourism and hospitality industries in driving market growth in these key regions. These factors, coupled with strong economic conditions and rising disposable incomes amongst the population, contribute to high consumption levels and further bolster the growth of the home textile market within these countries.
Product Type Dominance: The bed linen segment continues to command a significant portion of the overall market share, fueled by increasing demand for high-quality and aesthetically pleasing bedding. The high demand for luxurious and comfortable bedding solutions amongst high-income households fuels this segment's growth.
GCC Home Textile Industry Product Analysis
Product innovation in the GCC home textile industry is focused on enhancing functionality, aesthetics, and sustainability. Technological advancements, such as the use of nanotechnology for stain-resistance and antimicrobial properties, are improving product performance. Market fit is achieved by catering to diverse consumer needs, ranging from budget-conscious to luxury-seeking consumers. The industry is seeing a growing demand for eco-friendly and ethically sourced products, aligning with global sustainability trends.
Key Drivers, Barriers & Challenges in GCC Home Textile Industry
Key Drivers: Rising disposable incomes, growing urbanization, increasing tourism, and government initiatives promoting local manufacturing are key drivers for the GCC home textile market. Technological advancements like smart textiles further fuel this growth.
Challenges: Supply chain disruptions, particularly concerning raw material sourcing and logistics, pose a significant challenge. Regulatory hurdles and import/export regulations can also impact market growth. Intense competition, especially from international brands, puts pressure on pricing and profitability. These factors result in xx% of businesses facing increased operational costs.
Growth Drivers in the GCC Home Textile Industry Market
Strong economic growth across the GCC, rising disposable incomes within the consumer base, and a growing population are significant growth catalysts. Government initiatives promoting local manufacturing and investment in the textile sector play a substantial role. Technological advancements, such as the introduction of innovative fabrics and smart home technologies, further support market expansion.
Challenges Impacting GCC Home Textile Industry Growth
Fluctuations in global commodity prices and raw material availability pose a significant challenge. Supply chain disruptions and logistical complexities impact production and delivery timelines. Intense competition from international brands necessitates continuous innovation and price competitiveness. This translates into a xx% reduction in profit margins for certain companies.
Key Players Shaping the GCC Home Textile Industry Market
- AL Taqwa
- Gulf Asian General Trading LLC
- Deyarco
- Satex
- Housetex
- Al Sorayai Group
- Dicitex
- Orient Textiles International LLC
- CLF Como Luxury Fabrics LLC
- B Tex International L L C
Significant GCC Home Textile Industry Industry Milestones
- February 2023: Launch of Frugado.com, an online platform offering curated home textiles and fashion items, expanding consumer choice and accelerating online market penetration.
- October 2023: Partnership between LETSDRY and LuLu Hypermarket, significantly increasing the distribution reach of bath linen products and establishing a strong retail presence within the GCC.
Future Outlook for GCC Home Textile Industry Market
The GCC home textile market is poised for continued growth, driven by strong economic fundamentals, evolving consumer preferences, and technological advancements. Strategic opportunities lie in developing sustainable and innovative products, enhancing supply chain efficiency, and expanding online presence. The market's potential is further strengthened by government support and initiatives promoting domestic manufacturing. The overall market is expected to see a sustained period of growth, solidifying its position as a prominent player in the global home textile industry.
GCC Home Textile Industry Segmentation
-
1. Product Type
- 1.1. Bed linen
- 1.2. Bath Linen
- 1.3. Kitchen Linen
- 1.4. Upholstery
- 1.5. Floor Covering
-
2. Distribution Channel
- 2.1. Supermarkets & Hypermarkets
- 2.2. Specialty Stores
- 2.3. Online
- 2.4. Other Distribution Channels
-
3. Geography
- 3.1. Saudi Arabia
- 3.2. United Arab Emirates
- 3.3. Oman
- 3.4. Kuwait
- 3.5. Qatar
- 3.6. Bahrain
GCC Home Textile Industry Segmentation By Geography
- 1. Saudi Arabia
- 2. United Arab Emirates
- 3. Oman
- 4. Kuwait
- 5. Qatar
- 6. Bahrain
GCC Home Textile Industry Regional Market Share
Geographic Coverage of GCC Home Textile Industry
GCC Home Textile Industry REPORT HIGHLIGHTS
| Aspects | Details |
|---|---|
| Study Period | 2020-2034 |
| Base Year | 2025 |
| Estimated Year | 2026 |
| Forecast Period | 2026-2034 |
| Historical Period | 2020-2025 |
| Growth Rate | CAGR of 3.69% from 2020-2034 |
| Segmentation |
|
Table of Contents
- 1. Introduction
- 1.1. Research Scope
- 1.2. Market Segmentation
- 1.3. Research Methodology
- 1.4. Definitions and Assumptions
- 2. Executive Summary
- 2.1. Introduction
- 3. Market Dynamics
- 3.1. Introduction
- 3.2. Market Drivers
- 3.2.1. Rise of Smart Kitchen is Driving the Market; Growing Urbanisation is Driving Need for Quick Meal Preparation
- 3.3. Market Restrains
- 3.3.1. Changing Needs and Taste of Customers; Limited Usage of the Product
- 3.4. Market Trends
- 3.4.1. Saudi Arabia is driving the growth of the market
- 4. Market Factor Analysis
- 4.1. Porters Five Forces
- 4.2. Supply/Value Chain
- 4.3. PESTEL analysis
- 4.4. Market Entropy
- 4.5. Patent/Trademark Analysis
- 5. Global GCC Home Textile Industry Analysis, Insights and Forecast, 2020-2032
- 5.1. Market Analysis, Insights and Forecast - by Product Type
- 5.1.1. Bed linen
- 5.1.2. Bath Linen
- 5.1.3. Kitchen Linen
- 5.1.4. Upholstery
- 5.1.5. Floor Covering
- 5.2. Market Analysis, Insights and Forecast - by Distribution Channel
- 5.2.1. Supermarkets & Hypermarkets
- 5.2.2. Specialty Stores
- 5.2.3. Online
- 5.2.4. Other Distribution Channels
- 5.3. Market Analysis, Insights and Forecast - by Geography
- 5.3.1. Saudi Arabia
- 5.3.2. United Arab Emirates
- 5.3.3. Oman
- 5.3.4. Kuwait
- 5.3.5. Qatar
- 5.3.6. Bahrain
- 5.4. Market Analysis, Insights and Forecast - by Region
- 5.4.1. Saudi Arabia
- 5.4.2. United Arab Emirates
- 5.4.3. Oman
- 5.4.4. Kuwait
- 5.4.5. Qatar
- 5.4.6. Bahrain
- 5.1. Market Analysis, Insights and Forecast - by Product Type
- 6. Saudi Arabia GCC Home Textile Industry Analysis, Insights and Forecast, 2020-2032
- 6.1. Market Analysis, Insights and Forecast - by Product Type
- 6.1.1. Bed linen
- 6.1.2. Bath Linen
- 6.1.3. Kitchen Linen
- 6.1.4. Upholstery
- 6.1.5. Floor Covering
- 6.2. Market Analysis, Insights and Forecast - by Distribution Channel
- 6.2.1. Supermarkets & Hypermarkets
- 6.2.2. Specialty Stores
- 6.2.3. Online
- 6.2.4. Other Distribution Channels
- 6.3. Market Analysis, Insights and Forecast - by Geography
- 6.3.1. Saudi Arabia
- 6.3.2. United Arab Emirates
- 6.3.3. Oman
- 6.3.4. Kuwait
- 6.3.5. Qatar
- 6.3.6. Bahrain
- 6.1. Market Analysis, Insights and Forecast - by Product Type
- 7. United Arab Emirates GCC Home Textile Industry Analysis, Insights and Forecast, 2020-2032
- 7.1. Market Analysis, Insights and Forecast - by Product Type
- 7.1.1. Bed linen
- 7.1.2. Bath Linen
- 7.1.3. Kitchen Linen
- 7.1.4. Upholstery
- 7.1.5. Floor Covering
- 7.2. Market Analysis, Insights and Forecast - by Distribution Channel
- 7.2.1. Supermarkets & Hypermarkets
- 7.2.2. Specialty Stores
- 7.2.3. Online
- 7.2.4. Other Distribution Channels
- 7.3. Market Analysis, Insights and Forecast - by Geography
- 7.3.1. Saudi Arabia
- 7.3.2. United Arab Emirates
- 7.3.3. Oman
- 7.3.4. Kuwait
- 7.3.5. Qatar
- 7.3.6. Bahrain
- 7.1. Market Analysis, Insights and Forecast - by Product Type
- 8. Oman GCC Home Textile Industry Analysis, Insights and Forecast, 2020-2032
- 8.1. Market Analysis, Insights and Forecast - by Product Type
- 8.1.1. Bed linen
- 8.1.2. Bath Linen
- 8.1.3. Kitchen Linen
- 8.1.4. Upholstery
- 8.1.5. Floor Covering
- 8.2. Market Analysis, Insights and Forecast - by Distribution Channel
- 8.2.1. Supermarkets & Hypermarkets
- 8.2.2. Specialty Stores
- 8.2.3. Online
- 8.2.4. Other Distribution Channels
- 8.3. Market Analysis, Insights and Forecast - by Geography
- 8.3.1. Saudi Arabia
- 8.3.2. United Arab Emirates
- 8.3.3. Oman
- 8.3.4. Kuwait
- 8.3.5. Qatar
- 8.3.6. Bahrain
- 8.1. Market Analysis, Insights and Forecast - by Product Type
- 9. Kuwait GCC Home Textile Industry Analysis, Insights and Forecast, 2020-2032
- 9.1. Market Analysis, Insights and Forecast - by Product Type
- 9.1.1. Bed linen
- 9.1.2. Bath Linen
- 9.1.3. Kitchen Linen
- 9.1.4. Upholstery
- 9.1.5. Floor Covering
- 9.2. Market Analysis, Insights and Forecast - by Distribution Channel
- 9.2.1. Supermarkets & Hypermarkets
- 9.2.2. Specialty Stores
- 9.2.3. Online
- 9.2.4. Other Distribution Channels
- 9.3. Market Analysis, Insights and Forecast - by Geography
- 9.3.1. Saudi Arabia
- 9.3.2. United Arab Emirates
- 9.3.3. Oman
- 9.3.4. Kuwait
- 9.3.5. Qatar
- 9.3.6. Bahrain
- 9.1. Market Analysis, Insights and Forecast - by Product Type
- 10. Qatar GCC Home Textile Industry Analysis, Insights and Forecast, 2020-2032
- 10.1. Market Analysis, Insights and Forecast - by Product Type
- 10.1.1. Bed linen
- 10.1.2. Bath Linen
- 10.1.3. Kitchen Linen
- 10.1.4. Upholstery
- 10.1.5. Floor Covering
- 10.2. Market Analysis, Insights and Forecast - by Distribution Channel
- 10.2.1. Supermarkets & Hypermarkets
- 10.2.2. Specialty Stores
- 10.2.3. Online
- 10.2.4. Other Distribution Channels
- 10.3. Market Analysis, Insights and Forecast - by Geography
- 10.3.1. Saudi Arabia
- 10.3.2. United Arab Emirates
- 10.3.3. Oman
- 10.3.4. Kuwait
- 10.3.5. Qatar
- 10.3.6. Bahrain
- 10.1. Market Analysis, Insights and Forecast - by Product Type
- 11. Bahrain GCC Home Textile Industry Analysis, Insights and Forecast, 2020-2032
- 11.1. Market Analysis, Insights and Forecast - by Product Type
- 11.1.1. Bed linen
- 11.1.2. Bath Linen
- 11.1.3. Kitchen Linen
- 11.1.4. Upholstery
- 11.1.5. Floor Covering
- 11.2. Market Analysis, Insights and Forecast - by Distribution Channel
- 11.2.1. Supermarkets & Hypermarkets
- 11.2.2. Specialty Stores
- 11.2.3. Online
- 11.2.4. Other Distribution Channels
- 11.3. Market Analysis, Insights and Forecast - by Geography
- 11.3.1. Saudi Arabia
- 11.3.2. United Arab Emirates
- 11.3.3. Oman
- 11.3.4. Kuwait
- 11.3.5. Qatar
- 11.3.6. Bahrain
- 11.1. Market Analysis, Insights and Forecast - by Product Type
- 12. North America GCC Home Textile Industry Analysis, Insights and Forecast, 2020-2032
- 12.1. Market Analysis, Insights and Forecast - By Country/Sub-region
- 12.1.1 United States
- 12.1.2 Canada
- 12.1.3 Mexico
- 13. Europe GCC Home Textile Industry Analysis, Insights and Forecast, 2020-2032
- 13.1. Market Analysis, Insights and Forecast - By Country/Sub-region
- 13.1.1 Germany
- 13.1.2 United Kingdom
- 13.1.3 France
- 13.1.4 Spain
- 13.1.5 Italy
- 13.1.6 Spain
- 13.1.7 Belgium
- 13.1.8 Netherland
- 13.1.9 Nordics
- 13.1.10 Rest of Europe
- 14. Asia Pacific GCC Home Textile Industry Analysis, Insights and Forecast, 2020-2032
- 14.1. Market Analysis, Insights and Forecast - By Country/Sub-region
- 14.1.1 China
- 14.1.2 Japan
- 14.1.3 India
- 14.1.4 South Korea
- 14.1.5 Southeast Asia
- 14.1.6 Australia
- 14.1.7 Indonesia
- 14.1.8 Phillipes
- 14.1.9 Singapore
- 14.1.10 Thailandc
- 14.1.11 Rest of Asia Pacific
- 15. South America GCC Home Textile Industry Analysis, Insights and Forecast, 2020-2032
- 15.1. Market Analysis, Insights and Forecast - By Country/Sub-region
- 15.1.1 Brazil
- 15.1.2 Argentina
- 15.1.3 Peru
- 15.1.4 Chile
- 15.1.5 Colombia
- 15.1.6 Ecuador
- 15.1.7 Venezuela
- 15.1.8 Rest of South America
- 16. North America GCC Home Textile Industry Analysis, Insights and Forecast, 2020-2032
- 16.1. Market Analysis, Insights and Forecast - By Country/Sub-region
- 16.1.1 United States
- 16.1.2 Canada
- 16.1.3 Mexico
- 17. MEA GCC Home Textile Industry Analysis, Insights and Forecast, 2020-2032
- 17.1. Market Analysis, Insights and Forecast - By Country/Sub-region
- 17.1.1 United Arab Emirates
- 17.1.2 Saudi Arabia
- 17.1.3 South Africa
- 17.1.4 Rest of Middle East and Africa
- 18. Competitive Analysis
- 18.1. Global Market Share Analysis 2025
- 18.2. Company Profiles
- 18.2.1 AL Taqwa
- 18.2.1.1. Overview
- 18.2.1.2. Products
- 18.2.1.3. SWOT Analysis
- 18.2.1.4. Recent Developments
- 18.2.1.5. Financials (Based on Availability)
- 18.2.2 Gulf Asian General Trading LLC
- 18.2.2.1. Overview
- 18.2.2.2. Products
- 18.2.2.3. SWOT Analysis
- 18.2.2.4. Recent Developments
- 18.2.2.5. Financials (Based on Availability)
- 18.2.3 Deyarco
- 18.2.3.1. Overview
- 18.2.3.2. Products
- 18.2.3.3. SWOT Analysis
- 18.2.3.4. Recent Developments
- 18.2.3.5. Financials (Based on Availability)
- 18.2.4 Satex
- 18.2.4.1. Overview
- 18.2.4.2. Products
- 18.2.4.3. SWOT Analysis
- 18.2.4.4. Recent Developments
- 18.2.4.5. Financials (Based on Availability)
- 18.2.5 Housetex
- 18.2.5.1. Overview
- 18.2.5.2. Products
- 18.2.5.3. SWOT Analysis
- 18.2.5.4. Recent Developments
- 18.2.5.5. Financials (Based on Availability)
- 18.2.6 Al Sorayai Group
- 18.2.6.1. Overview
- 18.2.6.2. Products
- 18.2.6.3. SWOT Analysis
- 18.2.6.4. Recent Developments
- 18.2.6.5. Financials (Based on Availability)
- 18.2.7 Dicitex
- 18.2.7.1. Overview
- 18.2.7.2. Products
- 18.2.7.3. SWOT Analysis
- 18.2.7.4. Recent Developments
- 18.2.7.5. Financials (Based on Availability)
- 18.2.8 Orient Textiles International LLC
- 18.2.8.1. Overview
- 18.2.8.2. Products
- 18.2.8.3. SWOT Analysis
- 18.2.8.4. Recent Developments
- 18.2.8.5. Financials (Based on Availability)
- 18.2.9 CLF Como Luxury Fabrics LLC
- 18.2.9.1. Overview
- 18.2.9.2. Products
- 18.2.9.3. SWOT Analysis
- 18.2.9.4. Recent Developments
- 18.2.9.5. Financials (Based on Availability)
- 18.2.10 B Tex International L L C
- 18.2.10.1. Overview
- 18.2.10.2. Products
- 18.2.10.3. SWOT Analysis
- 18.2.10.4. Recent Developments
- 18.2.10.5. Financials (Based on Availability)
- 18.2.1 AL Taqwa
List of Figures
- Figure 1: Global GCC Home Textile Industry Revenue Breakdown (Million, %) by Region 2025 & 2033
- Figure 2: Global GCC Home Textile Industry Volume Breakdown (K Unit, %) by Region 2025 & 2033
- Figure 3: North America GCC Home Textile Industry Revenue (Million), by Country 2025 & 2033
- Figure 4: North America GCC Home Textile Industry Volume (K Unit), by Country 2025 & 2033
- Figure 5: North America GCC Home Textile Industry Revenue Share (%), by Country 2025 & 2033
- Figure 6: North America GCC Home Textile Industry Volume Share (%), by Country 2025 & 2033
- Figure 7: Europe GCC Home Textile Industry Revenue (Million), by Country 2025 & 2033
- Figure 8: Europe GCC Home Textile Industry Volume (K Unit), by Country 2025 & 2033
- Figure 9: Europe GCC Home Textile Industry Revenue Share (%), by Country 2025 & 2033
- Figure 10: Europe GCC Home Textile Industry Volume Share (%), by Country 2025 & 2033
- Figure 11: Asia Pacific GCC Home Textile Industry Revenue (Million), by Country 2025 & 2033
- Figure 12: Asia Pacific GCC Home Textile Industry Volume (K Unit), by Country 2025 & 2033
- Figure 13: Asia Pacific GCC Home Textile Industry Revenue Share (%), by Country 2025 & 2033
- Figure 14: Asia Pacific GCC Home Textile Industry Volume Share (%), by Country 2025 & 2033
- Figure 15: South America GCC Home Textile Industry Revenue (Million), by Country 2025 & 2033
- Figure 16: South America GCC Home Textile Industry Volume (K Unit), by Country 2025 & 2033
- Figure 17: South America GCC Home Textile Industry Revenue Share (%), by Country 2025 & 2033
- Figure 18: South America GCC Home Textile Industry Volume Share (%), by Country 2025 & 2033
- Figure 19: North America GCC Home Textile Industry Revenue (Million), by Country 2025 & 2033
- Figure 20: North America GCC Home Textile Industry Volume (K Unit), by Country 2025 & 2033
- Figure 21: North America GCC Home Textile Industry Revenue Share (%), by Country 2025 & 2033
- Figure 22: North America GCC Home Textile Industry Volume Share (%), by Country 2025 & 2033
- Figure 23: MEA GCC Home Textile Industry Revenue (Million), by Country 2025 & 2033
- Figure 24: MEA GCC Home Textile Industry Volume (K Unit), by Country 2025 & 2033
- Figure 25: MEA GCC Home Textile Industry Revenue Share (%), by Country 2025 & 2033
- Figure 26: MEA GCC Home Textile Industry Volume Share (%), by Country 2025 & 2033
- Figure 27: Saudi Arabia GCC Home Textile Industry Revenue (Million), by Product Type 2025 & 2033
- Figure 28: Saudi Arabia GCC Home Textile Industry Volume (K Unit), by Product Type 2025 & 2033
- Figure 29: Saudi Arabia GCC Home Textile Industry Revenue Share (%), by Product Type 2025 & 2033
- Figure 30: Saudi Arabia GCC Home Textile Industry Volume Share (%), by Product Type 2025 & 2033
- Figure 31: Saudi Arabia GCC Home Textile Industry Revenue (Million), by Distribution Channel 2025 & 2033
- Figure 32: Saudi Arabia GCC Home Textile Industry Volume (K Unit), by Distribution Channel 2025 & 2033
- Figure 33: Saudi Arabia GCC Home Textile Industry Revenue Share (%), by Distribution Channel 2025 & 2033
- Figure 34: Saudi Arabia GCC Home Textile Industry Volume Share (%), by Distribution Channel 2025 & 2033
- Figure 35: Saudi Arabia GCC Home Textile Industry Revenue (Million), by Geography 2025 & 2033
- Figure 36: Saudi Arabia GCC Home Textile Industry Volume (K Unit), by Geography 2025 & 2033
- Figure 37: Saudi Arabia GCC Home Textile Industry Revenue Share (%), by Geography 2025 & 2033
- Figure 38: Saudi Arabia GCC Home Textile Industry Volume Share (%), by Geography 2025 & 2033
- Figure 39: Saudi Arabia GCC Home Textile Industry Revenue (Million), by Country 2025 & 2033
- Figure 40: Saudi Arabia GCC Home Textile Industry Volume (K Unit), by Country 2025 & 2033
- Figure 41: Saudi Arabia GCC Home Textile Industry Revenue Share (%), by Country 2025 & 2033
- Figure 42: Saudi Arabia GCC Home Textile Industry Volume Share (%), by Country 2025 & 2033
- Figure 43: United Arab Emirates GCC Home Textile Industry Revenue (Million), by Product Type 2025 & 2033
- Figure 44: United Arab Emirates GCC Home Textile Industry Volume (K Unit), by Product Type 2025 & 2033
- Figure 45: United Arab Emirates GCC Home Textile Industry Revenue Share (%), by Product Type 2025 & 2033
- Figure 46: United Arab Emirates GCC Home Textile Industry Volume Share (%), by Product Type 2025 & 2033
- Figure 47: United Arab Emirates GCC Home Textile Industry Revenue (Million), by Distribution Channel 2025 & 2033
- Figure 48: United Arab Emirates GCC Home Textile Industry Volume (K Unit), by Distribution Channel 2025 & 2033
- Figure 49: United Arab Emirates GCC Home Textile Industry Revenue Share (%), by Distribution Channel 2025 & 2033
- Figure 50: United Arab Emirates GCC Home Textile Industry Volume Share (%), by Distribution Channel 2025 & 2033
- Figure 51: United Arab Emirates GCC Home Textile Industry Revenue (Million), by Geography 2025 & 2033
- Figure 52: United Arab Emirates GCC Home Textile Industry Volume (K Unit), by Geography 2025 & 2033
- Figure 53: United Arab Emirates GCC Home Textile Industry Revenue Share (%), by Geography 2025 & 2033
- Figure 54: United Arab Emirates GCC Home Textile Industry Volume Share (%), by Geography 2025 & 2033
- Figure 55: United Arab Emirates GCC Home Textile Industry Revenue (Million), by Country 2025 & 2033
- Figure 56: United Arab Emirates GCC Home Textile Industry Volume (K Unit), by Country 2025 & 2033
- Figure 57: United Arab Emirates GCC Home Textile Industry Revenue Share (%), by Country 2025 & 2033
- Figure 58: United Arab Emirates GCC Home Textile Industry Volume Share (%), by Country 2025 & 2033
- Figure 59: Oman GCC Home Textile Industry Revenue (Million), by Product Type 2025 & 2033
- Figure 60: Oman GCC Home Textile Industry Volume (K Unit), by Product Type 2025 & 2033
- Figure 61: Oman GCC Home Textile Industry Revenue Share (%), by Product Type 2025 & 2033
- Figure 62: Oman GCC Home Textile Industry Volume Share (%), by Product Type 2025 & 2033
- Figure 63: Oman GCC Home Textile Industry Revenue (Million), by Distribution Channel 2025 & 2033
- Figure 64: Oman GCC Home Textile Industry Volume (K Unit), by Distribution Channel 2025 & 2033
- Figure 65: Oman GCC Home Textile Industry Revenue Share (%), by Distribution Channel 2025 & 2033
- Figure 66: Oman GCC Home Textile Industry Volume Share (%), by Distribution Channel 2025 & 2033
- Figure 67: Oman GCC Home Textile Industry Revenue (Million), by Geography 2025 & 2033
- Figure 68: Oman GCC Home Textile Industry Volume (K Unit), by Geography 2025 & 2033
- Figure 69: Oman GCC Home Textile Industry Revenue Share (%), by Geography 2025 & 2033
- Figure 70: Oman GCC Home Textile Industry Volume Share (%), by Geography 2025 & 2033
- Figure 71: Oman GCC Home Textile Industry Revenue (Million), by Country 2025 & 2033
- Figure 72: Oman GCC Home Textile Industry Volume (K Unit), by Country 2025 & 2033
- Figure 73: Oman GCC Home Textile Industry Revenue Share (%), by Country 2025 & 2033
- Figure 74: Oman GCC Home Textile Industry Volume Share (%), by Country 2025 & 2033
- Figure 75: Kuwait GCC Home Textile Industry Revenue (Million), by Product Type 2025 & 2033
- Figure 76: Kuwait GCC Home Textile Industry Volume (K Unit), by Product Type 2025 & 2033
- Figure 77: Kuwait GCC Home Textile Industry Revenue Share (%), by Product Type 2025 & 2033
- Figure 78: Kuwait GCC Home Textile Industry Volume Share (%), by Product Type 2025 & 2033
- Figure 79: Kuwait GCC Home Textile Industry Revenue (Million), by Distribution Channel 2025 & 2033
- Figure 80: Kuwait GCC Home Textile Industry Volume (K Unit), by Distribution Channel 2025 & 2033
- Figure 81: Kuwait GCC Home Textile Industry Revenue Share (%), by Distribution Channel 2025 & 2033
- Figure 82: Kuwait GCC Home Textile Industry Volume Share (%), by Distribution Channel 2025 & 2033
- Figure 83: Kuwait GCC Home Textile Industry Revenue (Million), by Geography 2025 & 2033
- Figure 84: Kuwait GCC Home Textile Industry Volume (K Unit), by Geography 2025 & 2033
- Figure 85: Kuwait GCC Home Textile Industry Revenue Share (%), by Geography 2025 & 2033
- Figure 86: Kuwait GCC Home Textile Industry Volume Share (%), by Geography 2025 & 2033
- Figure 87: Kuwait GCC Home Textile Industry Revenue (Million), by Country 2025 & 2033
- Figure 88: Kuwait GCC Home Textile Industry Volume (K Unit), by Country 2025 & 2033
- Figure 89: Kuwait GCC Home Textile Industry Revenue Share (%), by Country 2025 & 2033
- Figure 90: Kuwait GCC Home Textile Industry Volume Share (%), by Country 2025 & 2033
- Figure 91: Qatar GCC Home Textile Industry Revenue (Million), by Product Type 2025 & 2033
- Figure 92: Qatar GCC Home Textile Industry Volume (K Unit), by Product Type 2025 & 2033
- Figure 93: Qatar GCC Home Textile Industry Revenue Share (%), by Product Type 2025 & 2033
- Figure 94: Qatar GCC Home Textile Industry Volume Share (%), by Product Type 2025 & 2033
- Figure 95: Qatar GCC Home Textile Industry Revenue (Million), by Distribution Channel 2025 & 2033
- Figure 96: Qatar GCC Home Textile Industry Volume (K Unit), by Distribution Channel 2025 & 2033
- Figure 97: Qatar GCC Home Textile Industry Revenue Share (%), by Distribution Channel 2025 & 2033
- Figure 98: Qatar GCC Home Textile Industry Volume Share (%), by Distribution Channel 2025 & 2033
- Figure 99: Qatar GCC Home Textile Industry Revenue (Million), by Geography 2025 & 2033
- Figure 100: Qatar GCC Home Textile Industry Volume (K Unit), by Geography 2025 & 2033
- Figure 101: Qatar GCC Home Textile Industry Revenue Share (%), by Geography 2025 & 2033
- Figure 102: Qatar GCC Home Textile Industry Volume Share (%), by Geography 2025 & 2033
- Figure 103: Qatar GCC Home Textile Industry Revenue (Million), by Country 2025 & 2033
- Figure 104: Qatar GCC Home Textile Industry Volume (K Unit), by Country 2025 & 2033
- Figure 105: Qatar GCC Home Textile Industry Revenue Share (%), by Country 2025 & 2033
- Figure 106: Qatar GCC Home Textile Industry Volume Share (%), by Country 2025 & 2033
- Figure 107: Bahrain GCC Home Textile Industry Revenue (Million), by Product Type 2025 & 2033
- Figure 108: Bahrain GCC Home Textile Industry Volume (K Unit), by Product Type 2025 & 2033
- Figure 109: Bahrain GCC Home Textile Industry Revenue Share (%), by Product Type 2025 & 2033
- Figure 110: Bahrain GCC Home Textile Industry Volume Share (%), by Product Type 2025 & 2033
- Figure 111: Bahrain GCC Home Textile Industry Revenue (Million), by Distribution Channel 2025 & 2033
- Figure 112: Bahrain GCC Home Textile Industry Volume (K Unit), by Distribution Channel 2025 & 2033
- Figure 113: Bahrain GCC Home Textile Industry Revenue Share (%), by Distribution Channel 2025 & 2033
- Figure 114: Bahrain GCC Home Textile Industry Volume Share (%), by Distribution Channel 2025 & 2033
- Figure 115: Bahrain GCC Home Textile Industry Revenue (Million), by Geography 2025 & 2033
- Figure 116: Bahrain GCC Home Textile Industry Volume (K Unit), by Geography 2025 & 2033
- Figure 117: Bahrain GCC Home Textile Industry Revenue Share (%), by Geography 2025 & 2033
- Figure 118: Bahrain GCC Home Textile Industry Volume Share (%), by Geography 2025 & 2033
- Figure 119: Bahrain GCC Home Textile Industry Revenue (Million), by Country 2025 & 2033
- Figure 120: Bahrain GCC Home Textile Industry Volume (K Unit), by Country 2025 & 2033
- Figure 121: Bahrain GCC Home Textile Industry Revenue Share (%), by Country 2025 & 2033
- Figure 122: Bahrain GCC Home Textile Industry Volume Share (%), by Country 2025 & 2033
List of Tables
- Table 1: Global GCC Home Textile Industry Revenue Million Forecast, by Region 2020 & 2033
- Table 2: Global GCC Home Textile Industry Volume K Unit Forecast, by Region 2020 & 2033
- Table 3: Global GCC Home Textile Industry Revenue Million Forecast, by Product Type 2020 & 2033
- Table 4: Global GCC Home Textile Industry Volume K Unit Forecast, by Product Type 2020 & 2033
- Table 5: Global GCC Home Textile Industry Revenue Million Forecast, by Distribution Channel 2020 & 2033
- Table 6: Global GCC Home Textile Industry Volume K Unit Forecast, by Distribution Channel 2020 & 2033
- Table 7: Global GCC Home Textile Industry Revenue Million Forecast, by Geography 2020 & 2033
- Table 8: Global GCC Home Textile Industry Volume K Unit Forecast, by Geography 2020 & 2033
- Table 9: Global GCC Home Textile Industry Revenue Million Forecast, by Region 2020 & 2033
- Table 10: Global GCC Home Textile Industry Volume K Unit Forecast, by Region 2020 & 2033
- Table 11: Global GCC Home Textile Industry Revenue Million Forecast, by Country 2020 & 2033
- Table 12: Global GCC Home Textile Industry Volume K Unit Forecast, by Country 2020 & 2033
- Table 13: United States GCC Home Textile Industry Revenue (Million) Forecast, by Application 2020 & 2033
- Table 14: United States GCC Home Textile Industry Volume (K Unit) Forecast, by Application 2020 & 2033
- Table 15: Canada GCC Home Textile Industry Revenue (Million) Forecast, by Application 2020 & 2033
- Table 16: Canada GCC Home Textile Industry Volume (K Unit) Forecast, by Application 2020 & 2033
- Table 17: Mexico GCC Home Textile Industry Revenue (Million) Forecast, by Application 2020 & 2033
- Table 18: Mexico GCC Home Textile Industry Volume (K Unit) Forecast, by Application 2020 & 2033
- Table 19: Global GCC Home Textile Industry Revenue Million Forecast, by Country 2020 & 2033
- Table 20: Global GCC Home Textile Industry Volume K Unit Forecast, by Country 2020 & 2033
- Table 21: Germany GCC Home Textile Industry Revenue (Million) Forecast, by Application 2020 & 2033
- Table 22: Germany GCC Home Textile Industry Volume (K Unit) Forecast, by Application 2020 & 2033
- Table 23: United Kingdom GCC Home Textile Industry Revenue (Million) Forecast, by Application 2020 & 2033
- Table 24: United Kingdom GCC Home Textile Industry Volume (K Unit) Forecast, by Application 2020 & 2033
- Table 25: France GCC Home Textile Industry Revenue (Million) Forecast, by Application 2020 & 2033
- Table 26: France GCC Home Textile Industry Volume (K Unit) Forecast, by Application 2020 & 2033
- Table 27: Spain GCC Home Textile Industry Revenue (Million) Forecast, by Application 2020 & 2033
- Table 28: Spain GCC Home Textile Industry Volume (K Unit) Forecast, by Application 2020 & 2033
- Table 29: Italy GCC Home Textile Industry Revenue (Million) Forecast, by Application 2020 & 2033
- Table 30: Italy GCC Home Textile Industry Volume (K Unit) Forecast, by Application 2020 & 2033
- Table 31: Spain GCC Home Textile Industry Revenue (Million) Forecast, by Application 2020 & 2033
- Table 32: Spain GCC Home Textile Industry Volume (K Unit) Forecast, by Application 2020 & 2033
- Table 33: Belgium GCC Home Textile Industry Revenue (Million) Forecast, by Application 2020 & 2033
- Table 34: Belgium GCC Home Textile Industry Volume (K Unit) Forecast, by Application 2020 & 2033
- Table 35: Netherland GCC Home Textile Industry Revenue (Million) Forecast, by Application 2020 & 2033
- Table 36: Netherland GCC Home Textile Industry Volume (K Unit) Forecast, by Application 2020 & 2033
- Table 37: Nordics GCC Home Textile Industry Revenue (Million) Forecast, by Application 2020 & 2033
- Table 38: Nordics GCC Home Textile Industry Volume (K Unit) Forecast, by Application 2020 & 2033
- Table 39: Rest of Europe GCC Home Textile Industry Revenue (Million) Forecast, by Application 2020 & 2033
- Table 40: Rest of Europe GCC Home Textile Industry Volume (K Unit) Forecast, by Application 2020 & 2033
- Table 41: Global GCC Home Textile Industry Revenue Million Forecast, by Country 2020 & 2033
- Table 42: Global GCC Home Textile Industry Volume K Unit Forecast, by Country 2020 & 2033
- Table 43: China GCC Home Textile Industry Revenue (Million) Forecast, by Application 2020 & 2033
- Table 44: China GCC Home Textile Industry Volume (K Unit) Forecast, by Application 2020 & 2033
- Table 45: Japan GCC Home Textile Industry Revenue (Million) Forecast, by Application 2020 & 2033
- Table 46: Japan GCC Home Textile Industry Volume (K Unit) Forecast, by Application 2020 & 2033
- Table 47: India GCC Home Textile Industry Revenue (Million) Forecast, by Application 2020 & 2033
- Table 48: India GCC Home Textile Industry Volume (K Unit) Forecast, by Application 2020 & 2033
- Table 49: South Korea GCC Home Textile Industry Revenue (Million) Forecast, by Application 2020 & 2033
- Table 50: South Korea GCC Home Textile Industry Volume (K Unit) Forecast, by Application 2020 & 2033
- Table 51: Southeast Asia GCC Home Textile Industry Revenue (Million) Forecast, by Application 2020 & 2033
- Table 52: Southeast Asia GCC Home Textile Industry Volume (K Unit) Forecast, by Application 2020 & 2033
- Table 53: Australia GCC Home Textile Industry Revenue (Million) Forecast, by Application 2020 & 2033
- Table 54: Australia GCC Home Textile Industry Volume (K Unit) Forecast, by Application 2020 & 2033
- Table 55: Indonesia GCC Home Textile Industry Revenue (Million) Forecast, by Application 2020 & 2033
- Table 56: Indonesia GCC Home Textile Industry Volume (K Unit) Forecast, by Application 2020 & 2033
- Table 57: Phillipes GCC Home Textile Industry Revenue (Million) Forecast, by Application 2020 & 2033
- Table 58: Phillipes GCC Home Textile Industry Volume (K Unit) Forecast, by Application 2020 & 2033
- Table 59: Singapore GCC Home Textile Industry Revenue (Million) Forecast, by Application 2020 & 2033
- Table 60: Singapore GCC Home Textile Industry Volume (K Unit) Forecast, by Application 2020 & 2033
- Table 61: Thailandc GCC Home Textile Industry Revenue (Million) Forecast, by Application 2020 & 2033
- Table 62: Thailandc GCC Home Textile Industry Volume (K Unit) Forecast, by Application 2020 & 2033
- Table 63: Rest of Asia Pacific GCC Home Textile Industry Revenue (Million) Forecast, by Application 2020 & 2033
- Table 64: Rest of Asia Pacific GCC Home Textile Industry Volume (K Unit) Forecast, by Application 2020 & 2033
- Table 65: Global GCC Home Textile Industry Revenue Million Forecast, by Country 2020 & 2033
- Table 66: Global GCC Home Textile Industry Volume K Unit Forecast, by Country 2020 & 2033
- Table 67: Brazil GCC Home Textile Industry Revenue (Million) Forecast, by Application 2020 & 2033
- Table 68: Brazil GCC Home Textile Industry Volume (K Unit) Forecast, by Application 2020 & 2033
- Table 69: Argentina GCC Home Textile Industry Revenue (Million) Forecast, by Application 2020 & 2033
- Table 70: Argentina GCC Home Textile Industry Volume (K Unit) Forecast, by Application 2020 & 2033
- Table 71: Peru GCC Home Textile Industry Revenue (Million) Forecast, by Application 2020 & 2033
- Table 72: Peru GCC Home Textile Industry Volume (K Unit) Forecast, by Application 2020 & 2033
- Table 73: Chile GCC Home Textile Industry Revenue (Million) Forecast, by Application 2020 & 2033
- Table 74: Chile GCC Home Textile Industry Volume (K Unit) Forecast, by Application 2020 & 2033
- Table 75: Colombia GCC Home Textile Industry Revenue (Million) Forecast, by Application 2020 & 2033
- Table 76: Colombia GCC Home Textile Industry Volume (K Unit) Forecast, by Application 2020 & 2033
- Table 77: Ecuador GCC Home Textile Industry Revenue (Million) Forecast, by Application 2020 & 2033
- Table 78: Ecuador GCC Home Textile Industry Volume (K Unit) Forecast, by Application 2020 & 2033
- Table 79: Venezuela GCC Home Textile Industry Revenue (Million) Forecast, by Application 2020 & 2033
- Table 80: Venezuela GCC Home Textile Industry Volume (K Unit) Forecast, by Application 2020 & 2033
- Table 81: Rest of South America GCC Home Textile Industry Revenue (Million) Forecast, by Application 2020 & 2033
- Table 82: Rest of South America GCC Home Textile Industry Volume (K Unit) Forecast, by Application 2020 & 2033
- Table 83: Global GCC Home Textile Industry Revenue Million Forecast, by Country 2020 & 2033
- Table 84: Global GCC Home Textile Industry Volume K Unit Forecast, by Country 2020 & 2033
- Table 85: United States GCC Home Textile Industry Revenue (Million) Forecast, by Application 2020 & 2033
- Table 86: United States GCC Home Textile Industry Volume (K Unit) Forecast, by Application 2020 & 2033
- Table 87: Canada GCC Home Textile Industry Revenue (Million) Forecast, by Application 2020 & 2033
- Table 88: Canada GCC Home Textile Industry Volume (K Unit) Forecast, by Application 2020 & 2033
- Table 89: Mexico GCC Home Textile Industry Revenue (Million) Forecast, by Application 2020 & 2033
- Table 90: Mexico GCC Home Textile Industry Volume (K Unit) Forecast, by Application 2020 & 2033
- Table 91: Global GCC Home Textile Industry Revenue Million Forecast, by Country 2020 & 2033
- Table 92: Global GCC Home Textile Industry Volume K Unit Forecast, by Country 2020 & 2033
- Table 93: United Arab Emirates GCC Home Textile Industry Revenue (Million) Forecast, by Application 2020 & 2033
- Table 94: United Arab Emirates GCC Home Textile Industry Volume (K Unit) Forecast, by Application 2020 & 2033
- Table 95: Saudi Arabia GCC Home Textile Industry Revenue (Million) Forecast, by Application 2020 & 2033
- Table 96: Saudi Arabia GCC Home Textile Industry Volume (K Unit) Forecast, by Application 2020 & 2033
- Table 97: South Africa GCC Home Textile Industry Revenue (Million) Forecast, by Application 2020 & 2033
- Table 98: South Africa GCC Home Textile Industry Volume (K Unit) Forecast, by Application 2020 & 2033
- Table 99: Rest of Middle East and Africa GCC Home Textile Industry Revenue (Million) Forecast, by Application 2020 & 2033
- Table 100: Rest of Middle East and Africa GCC Home Textile Industry Volume (K Unit) Forecast, by Application 2020 & 2033
- Table 101: Global GCC Home Textile Industry Revenue Million Forecast, by Product Type 2020 & 2033
- Table 102: Global GCC Home Textile Industry Volume K Unit Forecast, by Product Type 2020 & 2033
- Table 103: Global GCC Home Textile Industry Revenue Million Forecast, by Distribution Channel 2020 & 2033
- Table 104: Global GCC Home Textile Industry Volume K Unit Forecast, by Distribution Channel 2020 & 2033
- Table 105: Global GCC Home Textile Industry Revenue Million Forecast, by Geography 2020 & 2033
- Table 106: Global GCC Home Textile Industry Volume K Unit Forecast, by Geography 2020 & 2033
- Table 107: Global GCC Home Textile Industry Revenue Million Forecast, by Country 2020 & 2033
- Table 108: Global GCC Home Textile Industry Volume K Unit Forecast, by Country 2020 & 2033
- Table 109: Global GCC Home Textile Industry Revenue Million Forecast, by Product Type 2020 & 2033
- Table 110: Global GCC Home Textile Industry Volume K Unit Forecast, by Product Type 2020 & 2033
- Table 111: Global GCC Home Textile Industry Revenue Million Forecast, by Distribution Channel 2020 & 2033
- Table 112: Global GCC Home Textile Industry Volume K Unit Forecast, by Distribution Channel 2020 & 2033
- Table 113: Global GCC Home Textile Industry Revenue Million Forecast, by Geography 2020 & 2033
- Table 114: Global GCC Home Textile Industry Volume K Unit Forecast, by Geography 2020 & 2033
- Table 115: Global GCC Home Textile Industry Revenue Million Forecast, by Country 2020 & 2033
- Table 116: Global GCC Home Textile Industry Volume K Unit Forecast, by Country 2020 & 2033
- Table 117: Global GCC Home Textile Industry Revenue Million Forecast, by Product Type 2020 & 2033
- Table 118: Global GCC Home Textile Industry Volume K Unit Forecast, by Product Type 2020 & 2033
- Table 119: Global GCC Home Textile Industry Revenue Million Forecast, by Distribution Channel 2020 & 2033
- Table 120: Global GCC Home Textile Industry Volume K Unit Forecast, by Distribution Channel 2020 & 2033
- Table 121: Global GCC Home Textile Industry Revenue Million Forecast, by Geography 2020 & 2033
- Table 122: Global GCC Home Textile Industry Volume K Unit Forecast, by Geography 2020 & 2033
- Table 123: Global GCC Home Textile Industry Revenue Million Forecast, by Country 2020 & 2033
- Table 124: Global GCC Home Textile Industry Volume K Unit Forecast, by Country 2020 & 2033
- Table 125: Global GCC Home Textile Industry Revenue Million Forecast, by Product Type 2020 & 2033
- Table 126: Global GCC Home Textile Industry Volume K Unit Forecast, by Product Type 2020 & 2033
- Table 127: Global GCC Home Textile Industry Revenue Million Forecast, by Distribution Channel 2020 & 2033
- Table 128: Global GCC Home Textile Industry Volume K Unit Forecast, by Distribution Channel 2020 & 2033
- Table 129: Global GCC Home Textile Industry Revenue Million Forecast, by Geography 2020 & 2033
- Table 130: Global GCC Home Textile Industry Volume K Unit Forecast, by Geography 2020 & 2033
- Table 131: Global GCC Home Textile Industry Revenue Million Forecast, by Country 2020 & 2033
- Table 132: Global GCC Home Textile Industry Volume K Unit Forecast, by Country 2020 & 2033
- Table 133: Global GCC Home Textile Industry Revenue Million Forecast, by Product Type 2020 & 2033
- Table 134: Global GCC Home Textile Industry Volume K Unit Forecast, by Product Type 2020 & 2033
- Table 135: Global GCC Home Textile Industry Revenue Million Forecast, by Distribution Channel 2020 & 2033
- Table 136: Global GCC Home Textile Industry Volume K Unit Forecast, by Distribution Channel 2020 & 2033
- Table 137: Global GCC Home Textile Industry Revenue Million Forecast, by Geography 2020 & 2033
- Table 138: Global GCC Home Textile Industry Volume K Unit Forecast, by Geography 2020 & 2033
- Table 139: Global GCC Home Textile Industry Revenue Million Forecast, by Country 2020 & 2033
- Table 140: Global GCC Home Textile Industry Volume K Unit Forecast, by Country 2020 & 2033
- Table 141: Global GCC Home Textile Industry Revenue Million Forecast, by Product Type 2020 & 2033
- Table 142: Global GCC Home Textile Industry Volume K Unit Forecast, by Product Type 2020 & 2033
- Table 143: Global GCC Home Textile Industry Revenue Million Forecast, by Distribution Channel 2020 & 2033
- Table 144: Global GCC Home Textile Industry Volume K Unit Forecast, by Distribution Channel 2020 & 2033
- Table 145: Global GCC Home Textile Industry Revenue Million Forecast, by Geography 2020 & 2033
- Table 146: Global GCC Home Textile Industry Volume K Unit Forecast, by Geography 2020 & 2033
- Table 147: Global GCC Home Textile Industry Revenue Million Forecast, by Country 2020 & 2033
- Table 148: Global GCC Home Textile Industry Volume K Unit Forecast, by Country 2020 & 2033
Frequently Asked Questions
1. What is the projected Compound Annual Growth Rate (CAGR) of the GCC Home Textile Industry?
The projected CAGR is approximately 3.69%.
2. Which companies are prominent players in the GCC Home Textile Industry?
Key companies in the market include AL Taqwa, Gulf Asian General Trading LLC, Deyarco, Satex, Housetex, Al Sorayai Group, Dicitex, Orient Textiles International LLC, CLF Como Luxury Fabrics LLC, B Tex International L L C.
3. What are the main segments of the GCC Home Textile Industry?
The market segments include Product Type, Distribution Channel, Geography.
4. Can you provide details about the market size?
The market size is estimated to be USD 1.68 Million as of 2022.
5. What are some drivers contributing to market growth?
Rise of Smart Kitchen is Driving the Market; Growing Urbanisation is Driving Need for Quick Meal Preparation.
6. What are the notable trends driving market growth?
Saudi Arabia is driving the growth of the market.
7. Are there any restraints impacting market growth?
Changing Needs and Taste of Customers; Limited Usage of the Product.
8. Can you provide examples of recent developments in the market?
February 2023: Frugado.com launched, offering a wide variety of curated items from international brands. Frugado.com provides shoppers with the perfect mix of stylish sophistication and affordability. Customers can find everything they need - from organic cotton beach towels to classic home textile items like throws, blankets, bedsheets, chic dresses, to kids’ fashion - in one place, making it super easy to stay up-to-date with their style preferences.
9. What pricing options are available for accessing the report?
Pricing options include single-user, multi-user, and enterprise licenses priced at USD 4750, USD 5250, and USD 8750 respectively.
10. Is the market size provided in terms of value or volume?
The market size is provided in terms of value, measured in Million and volume, measured in K Unit.
11. Are there any specific market keywords associated with the report?
Yes, the market keyword associated with the report is "GCC Home Textile Industry," which aids in identifying and referencing the specific market segment covered.
12. How do I determine which pricing option suits my needs best?
The pricing options vary based on user requirements and access needs. Individual users may opt for single-user licenses, while businesses requiring broader access may choose multi-user or enterprise licenses for cost-effective access to the report.
13. Are there any additional resources or data provided in the GCC Home Textile Industry report?
While the report offers comprehensive insights, it's advisable to review the specific contents or supplementary materials provided to ascertain if additional resources or data are available.
14. How can I stay updated on further developments or reports in the GCC Home Textile Industry?
To stay informed about further developments, trends, and reports in the GCC Home Textile Industry, consider subscribing to industry newsletters, following relevant companies and organizations, or regularly checking reputable industry news sources and publications.
Methodology
Step 1 - Identification of Relevant Samples Size from Population Database


Step 2 - Approaches for Defining Global Market Size (Value, Volume* & Price*)

Note*: In applicable scenarios
Step 3 - Data Sources
Primary Research
- Web Analytics
- Survey Reports
- Research Institute
- Latest Research Reports
- Opinion Leaders
Secondary Research
- Annual Reports
- White Paper
- Latest Press Release
- Industry Association
- Paid Database
- Investor Presentations

Step 4 - Data Triangulation
Involves using different sources of information in order to increase the validity of a study
These sources are likely to be stakeholders in a program - participants, other researchers, program staff, other community members, and so on.
Then we put all data in single framework & apply various statistical tools to find out the dynamic on the market.
During the analysis stage, feedback from the stakeholder groups would be compared to determine areas of agreement as well as areas of divergence
