
Key Insights
The GCC smart furniture market is experiencing robust growth, driven by increasing disposable incomes, a preference for technologically advanced home environments, and a rising adoption of smart home ecosystems. The market's Compound Annual Growth Rate (CAGR) exceeding 5% reflects a strong trajectory, projected to continue throughout the forecast period (2025-2033). Key segments fueling this expansion include smart tables and desks, highly sought after for their functionality and space-saving designs in smaller apartments prevalent in the region. The residential segment dominates, but commercial adoption is steadily increasing, particularly in offices and hospitality settings seeking to enhance productivity and create modern, appealing spaces. Distribution channels are diversifying, with online sales experiencing significant growth alongside established multi-brand and specialty stores. While the market faces challenges such as relatively high initial costs for smart furniture and concerns regarding data privacy and security, these are being mitigated by increasing affordability and improved technological safeguards. Leading players like Ikea and other regional brands are strategically positioning themselves to capture market share through product innovation, strategic partnerships, and targeted marketing campaigns focused on the unique needs and preferences of the GCC consumer.

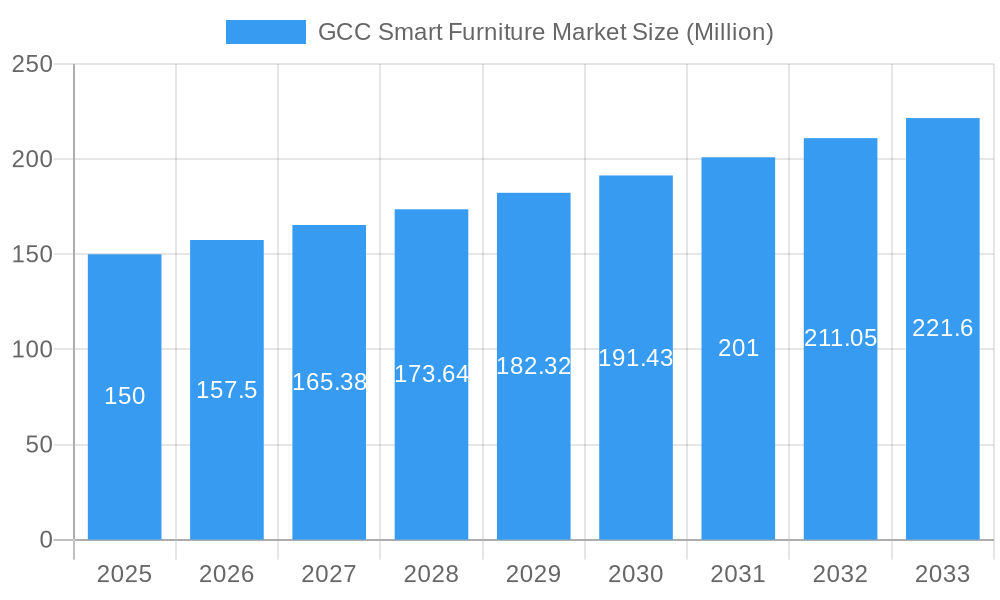
GCC Smart Furniture Market Market Size (In Million)
The competitive landscape is characterized by a mix of international and regional players. Established international brands benefit from brand recognition and global supply chains, while local players capitalize on understanding regional design preferences and cultural nuances. Future growth will hinge on continuous technological innovation, focusing on features like enhanced connectivity, energy efficiency, and personalized user experiences. The market will also see a rise in smart furniture incorporating health and wellness features, leveraging IoT capabilities to improve posture and encourage a healthy lifestyle. Expanding into the commercial sector through strategic partnerships with interior designers and architects will be crucial for sustained growth. Finally, addressing consumer concerns about data privacy through transparent data handling practices and robust security features will be essential for building trust and driving market expansion.
GCC Smart Furniture Market Company Market Share
GCC Smart Furniture Market: A Comprehensive Report (2019-2033)
This dynamic report provides a comprehensive analysis of the burgeoning GCC Smart Furniture Market, offering invaluable insights for industry stakeholders, investors, and strategic planners. Leveraging extensive research and data spanning from 2019 to 2033, this report unveils the market's structure, competitive landscape, growth drivers, and future outlook. With a focus on key segments – including Residential and Commercial end-users, Multi-brand Stores, Specialty Stores, Online, and Other Distribution Channels, and Product Types like Smart Tables, Smart Desks, Smart Chairs, and Other Smart Furniture – this report is essential for navigating the complexities of this rapidly evolving market. The report incorporates a detailed analysis of prominent players like Al Huzaifa, Bukannan Furniture, Mordern Gardens, Pan Emirates, Bakri Furniture, Schuco, Ikea, Sagtco, and Royal Furniture, providing a 360-degree view of the market's dynamics. The estimated market size in 2025 is projected to reach xx Million, with a significant Compound Annual Growth Rate (CAGR) expected during the forecast period (2025-2033).
GCC Smart Furniture Market Market Structure & Competitive Landscape
The GCC smart furniture market exhibits a moderately concentrated structure, with a few major players holding significant market share. However, the market is witnessing increasing competition from both established and emerging players. Innovation plays a crucial role, driven by advancements in IoT, AI, and materials science. Regulatory factors, particularly related to data privacy and safety standards for smart devices, are influencing market dynamics. Product substitution, primarily from traditional furniture, is a factor, but smart furniture's unique functionalities are proving increasingly compelling to consumers. End-user segmentation is predominantly driven by the residential sector, followed by commercial applications. M&A activity in the market has been moderate, with a few strategic acquisitions aimed at expanding product portfolios and market reach. The total M&A volume between 2019 and 2024 was approximately xx Million. This indicates a potential increase in consolidation as the market matures. Furthermore, concentration ratios indicate a xx% market share held by the top 5 players in 2024, signifying moderate concentration. The market is expected to become more fragmented in the coming years with more small to medium-sized players entering the market.
GCC Smart Furniture Market Market Trends & Opportunities
The GCC smart furniture market is experiencing robust growth, fueled by rising disposable incomes, increasing urbanization, and a growing preference for technologically advanced home and office environments. The market size expanded from xx Million in 2019 to xx Million in 2024, showcasing significant growth. Technological advancements, particularly in areas such as voice control, AI integration, and energy efficiency are driving the adoption of smart furniture. Consumers are increasingly seeking convenience, functionality, and aesthetics, which smart furniture effectively addresses. The market is characterized by intense competition, with companies focusing on product differentiation, innovative designs, and strategic partnerships to gain market share. The CAGR for the period 2019-2024 was approximately xx%, and the market penetration rate is estimated at xx% in 2024. The forecast period (2025-2033) anticipates continued strong growth, driven by evolving consumer preferences and technological advancements, with a projected CAGR of xx%.
Dominant Markets & Segments in GCC Smart Furniture Market
The residential segment currently dominates the GCC smart furniture market, accounting for the largest share of revenue due to increasing disposable income and a growing preference for smart home technologies. The UAE and Saudi Arabia are the leading national markets, driven by strong economic growth and high consumer spending.
Key Growth Drivers:
- Rising Disposable Incomes: Increased purchasing power fuels demand for premium and technologically advanced products.
- Urbanization: A shift towards urban living creates demand for space-saving and functional furniture.
- Technological Advancements: Continued innovation in smart technology enhances product features and appeal.
- Government Initiatives: Policies promoting technological innovation and smart city development.
The online distribution channel is showing rapid growth, reflecting the changing consumer behavior and the increasing penetration of e-commerce platforms in the region. Smart tables and smart desks are currently the most popular product types due to their functionality and integration with other smart home devices.
Market Dominance Analysis:
The dominance of the residential segment is attributable to the growing number of smart homes and an increase in consumers seeking to improve their lifestyles through technological integration. The UAE and Saudi Arabia's leading position is due to their higher disposable income and technological infrastructure. The increasing popularity of online shopping is driving the growth of the online distribution channel.
GCC Smart Furniture Market Product Analysis
Smart furniture innovation focuses on enhancing functionality, aesthetics, and user experience. Advancements include voice control, seamless integration with smart home ecosystems, and the use of sustainable and durable materials. Smart tables are popular for their versatile applications, while smart desks cater to the needs of remote workers and students. Smart chairs offer ergonomic features and health benefits. These products' competitive advantage lies in their ability to improve efficiency, convenience, and overall well-being, catering to evolving consumer lifestyles.
Key Drivers, Barriers & Challenges in GCC Smart Furniture Market
Key Drivers:
- Technological advancements such as AI, IoT, and voice control integration.
- Growing disposable incomes and rising demand for convenient home automation solutions.
- Government initiatives promoting smart city development.
Challenges & Restraints:
- High initial investment costs limiting mass adoption.
- Concerns regarding data security and privacy.
- Supply chain disruptions impacting product availability. The impact of supply chain issues on the market was estimated to cause a xx Million reduction in revenue in 2024.
- Competition from traditional furniture manufacturers.
Growth Drivers in the GCC Smart Furniture Market Market
The GCC smart furniture market's growth is primarily propelled by technological advancements, economic growth (particularly rising disposable incomes in the region), and supportive government policies encouraging technology adoption within smart cities. These factors have resulted in higher consumer spending and an increased appetite for technologically sophisticated home and office solutions.
Challenges Impacting GCC Smart Furniture Market Growth
The market faces challenges such as high initial costs for consumers, concerns surrounding data privacy and security, complex regulatory landscapes that impact the development and deployment of smart technology, and the vulnerability of supply chains to global disruptions. These factors pose hurdles to broader market adoption.
Key Players Shaping the GCC Smart Furniture Market Market
- Al Huzaifa
- Bukannan Furniture
- Mordern Gardens
- Pan Emirates
- Bakri Furniture
- Schuco
- Ikea
- Sagtco
- Royal Furniture
Significant GCC Smart Furniture Market Industry Milestones
- 2021-Q3: Launch of the first fully integrated smart home system by a major GCC furniture retailer.
- 2022-Q1: Introduction of AI-powered ergonomic smart chairs with advanced posture correction features.
- 2023-Q2: A significant investment in a new smart furniture manufacturing facility by a leading GCC player.
Future Outlook for GCC Smart Furniture Market Market
The GCC smart furniture market is poised for sustained growth, driven by ongoing technological innovation, evolving consumer preferences, and government support for smart city initiatives. This presents significant strategic opportunities for market participants, particularly those focusing on innovative product development, seamless integration with smart home ecosystems, and cost-effective manufacturing processes. The market is expected to continue its robust expansion throughout the forecast period, presenting substantial market potential for both established and emerging players.
GCC Smart Furniture Market Segmentation
-
1. Product Type
- 1.1. Smart Tables
- 1.2. Smart Desks
- 1.3. Smart Chairs
- 1.4. Other Products (smart beds, smart sofas, etc.)
-
2. End User
- 2.1. Residential
- 2.2. Commercial
-
3. DistributionChannel
- 3.1. Multi-brand Stores
- 3.2. Specialty Stores
- 3.3. Online
- 3.4. Other Distribution Channels
-
4. Geography
- 4.1. UAE
- 4.2. Saudi Arabia
- 4.3. Qatar
- 4.4. Kuwait
- 4.5. Rest of GCC Countries
GCC Smart Furniture Market Segmentation By Geography
- 1. UAE
- 2. Saudi Arabia
- 3. Qatar
- 4. Kuwait
- 5. Rest of GCC Countries

GCC Smart Furniture Market Regional Market Share
Geographic Coverage of GCC Smart Furniture Market
GCC Smart Furniture Market REPORT HIGHLIGHTS
| Aspects | Details |
|---|---|
| Study Period | 2020-2034 |
| Base Year | 2025 |
| Estimated Year | 2026 |
| Forecast Period | 2026-2034 |
| Historical Period | 2020-2025 |
| Growth Rate | CAGR of > 5.00% from 2020-2034 |
| Segmentation |
|
Table of Contents
- 1. Introduction
- 1.1. Research Scope
- 1.2. Market Segmentation
- 1.3. Research Methodology
- 1.4. Definitions and Assumptions
- 2. Executive Summary
- 2.1. Introduction
- 3. Market Dynamics
- 3.1. Introduction
- 3.2. Market Drivers
- 3.2.1. Increasing Online Sales is Driving the Market; Growing Urbanisation is Driving need for Small Appliances
- 3.3. Market Restrains
- 3.3.1. Changing Needs of Customers; Limited Usage of the Product
- 3.4. Market Trends
- 3.4.1. Rise in Consumer Expenditure on Home Improvement Fuels the Market
- 4. Market Factor Analysis
- 4.1. Porters Five Forces
- 4.2. Supply/Value Chain
- 4.3. PESTEL analysis
- 4.4. Market Entropy
- 4.5. Patent/Trademark Analysis
- 5. Global GCC Smart Furniture Market Analysis, Insights and Forecast, 2020-2032
- 5.1. Market Analysis, Insights and Forecast - by Product Type
- 5.1.1. Smart Tables
- 5.1.2. Smart Desks
- 5.1.3. Smart Chairs
- 5.1.4. Other Products (smart beds, smart sofas, etc.)
- 5.2. Market Analysis, Insights and Forecast - by End User
- 5.2.1. Residential
- 5.2.2. Commercial
- 5.3. Market Analysis, Insights and Forecast - by DistributionChannel
- 5.3.1. Multi-brand Stores
- 5.3.2. Specialty Stores
- 5.3.3. Online
- 5.3.4. Other Distribution Channels
- 5.4. Market Analysis, Insights and Forecast - by Geography
- 5.4.1. UAE
- 5.4.2. Saudi Arabia
- 5.4.3. Qatar
- 5.4.4. Kuwait
- 5.4.5. Rest of GCC Countries
- 5.5. Market Analysis, Insights and Forecast - by Region
- 5.5.1. UAE
- 5.5.2. Saudi Arabia
- 5.5.3. Qatar
- 5.5.4. Kuwait
- 5.5.5. Rest of GCC Countries
- 5.1. Market Analysis, Insights and Forecast - by Product Type
- 6. UAE GCC Smart Furniture Market Analysis, Insights and Forecast, 2020-2032
- 6.1. Market Analysis, Insights and Forecast - by Product Type
- 6.1.1. Smart Tables
- 6.1.2. Smart Desks
- 6.1.3. Smart Chairs
- 6.1.4. Other Products (smart beds, smart sofas, etc.)
- 6.2. Market Analysis, Insights and Forecast - by End User
- 6.2.1. Residential
- 6.2.2. Commercial
- 6.3. Market Analysis, Insights and Forecast - by DistributionChannel
- 6.3.1. Multi-brand Stores
- 6.3.2. Specialty Stores
- 6.3.3. Online
- 6.3.4. Other Distribution Channels
- 6.4. Market Analysis, Insights and Forecast - by Geography
- 6.4.1. UAE
- 6.4.2. Saudi Arabia
- 6.4.3. Qatar
- 6.4.4. Kuwait
- 6.4.5. Rest of GCC Countries
- 6.1. Market Analysis, Insights and Forecast - by Product Type
- 7. Saudi Arabia GCC Smart Furniture Market Analysis, Insights and Forecast, 2020-2032
- 7.1. Market Analysis, Insights and Forecast - by Product Type
- 7.1.1. Smart Tables
- 7.1.2. Smart Desks
- 7.1.3. Smart Chairs
- 7.1.4. Other Products (smart beds, smart sofas, etc.)
- 7.2. Market Analysis, Insights and Forecast - by End User
- 7.2.1. Residential
- 7.2.2. Commercial
- 7.3. Market Analysis, Insights and Forecast - by DistributionChannel
- 7.3.1. Multi-brand Stores
- 7.3.2. Specialty Stores
- 7.3.3. Online
- 7.3.4. Other Distribution Channels
- 7.4. Market Analysis, Insights and Forecast - by Geography
- 7.4.1. UAE
- 7.4.2. Saudi Arabia
- 7.4.3. Qatar
- 7.4.4. Kuwait
- 7.4.5. Rest of GCC Countries
- 7.1. Market Analysis, Insights and Forecast - by Product Type
- 8. Qatar GCC Smart Furniture Market Analysis, Insights and Forecast, 2020-2032
- 8.1. Market Analysis, Insights and Forecast - by Product Type
- 8.1.1. Smart Tables
- 8.1.2. Smart Desks
- 8.1.3. Smart Chairs
- 8.1.4. Other Products (smart beds, smart sofas, etc.)
- 8.2. Market Analysis, Insights and Forecast - by End User
- 8.2.1. Residential
- 8.2.2. Commercial
- 8.3. Market Analysis, Insights and Forecast - by DistributionChannel
- 8.3.1. Multi-brand Stores
- 8.3.2. Specialty Stores
- 8.3.3. Online
- 8.3.4. Other Distribution Channels
- 8.4. Market Analysis, Insights and Forecast - by Geography
- 8.4.1. UAE
- 8.4.2. Saudi Arabia
- 8.4.3. Qatar
- 8.4.4. Kuwait
- 8.4.5. Rest of GCC Countries
- 8.1. Market Analysis, Insights and Forecast - by Product Type
- 9. Kuwait GCC Smart Furniture Market Analysis, Insights and Forecast, 2020-2032
- 9.1. Market Analysis, Insights and Forecast - by Product Type
- 9.1.1. Smart Tables
- 9.1.2. Smart Desks
- 9.1.3. Smart Chairs
- 9.1.4. Other Products (smart beds, smart sofas, etc.)
- 9.2. Market Analysis, Insights and Forecast - by End User
- 9.2.1. Residential
- 9.2.2. Commercial
- 9.3. Market Analysis, Insights and Forecast - by DistributionChannel
- 9.3.1. Multi-brand Stores
- 9.3.2. Specialty Stores
- 9.3.3. Online
- 9.3.4. Other Distribution Channels
- 9.4. Market Analysis, Insights and Forecast - by Geography
- 9.4.1. UAE
- 9.4.2. Saudi Arabia
- 9.4.3. Qatar
- 9.4.4. Kuwait
- 9.4.5. Rest of GCC Countries
- 9.1. Market Analysis, Insights and Forecast - by Product Type
- 10. Rest of GCC Countries GCC Smart Furniture Market Analysis, Insights and Forecast, 2020-2032
- 10.1. Market Analysis, Insights and Forecast - by Product Type
- 10.1.1. Smart Tables
- 10.1.2. Smart Desks
- 10.1.3. Smart Chairs
- 10.1.4. Other Products (smart beds, smart sofas, etc.)
- 10.2. Market Analysis, Insights and Forecast - by End User
- 10.2.1. Residential
- 10.2.2. Commercial
- 10.3. Market Analysis, Insights and Forecast - by DistributionChannel
- 10.3.1. Multi-brand Stores
- 10.3.2. Specialty Stores
- 10.3.3. Online
- 10.3.4. Other Distribution Channels
- 10.4. Market Analysis, Insights and Forecast - by Geography
- 10.4.1. UAE
- 10.4.2. Saudi Arabia
- 10.4.3. Qatar
- 10.4.4. Kuwait
- 10.4.5. Rest of GCC Countries
- 10.1. Market Analysis, Insights and Forecast - by Product Type
- 11. North America GCC Smart Furniture Market Analysis, Insights and Forecast, 2020-2032
- 11.1. Market Analysis, Insights and Forecast - By Country/Sub-region
- 11.1.1 United States
- 11.1.2 Canada
- 11.1.3 Mexico
- 12. Europe GCC Smart Furniture Market Analysis, Insights and Forecast, 2020-2032
- 12.1. Market Analysis, Insights and Forecast - By Country/Sub-region
- 12.1.1 Germany
- 12.1.2 United Kingdom
- 12.1.3 France
- 12.1.4 Spain
- 12.1.5 Italy
- 12.1.6 Spain
- 12.1.7 Belgium
- 12.1.8 Netherland
- 12.1.9 Nordics
- 12.1.10 Rest of Europe
- 13. Asia Pacific GCC Smart Furniture Market Analysis, Insights and Forecast, 2020-2032
- 13.1. Market Analysis, Insights and Forecast - By Country/Sub-region
- 13.1.1 China
- 13.1.2 Japan
- 13.1.3 India
- 13.1.4 South Korea
- 13.1.5 Southeast Asia
- 13.1.6 Australia
- 13.1.7 Indonesia
- 13.1.8 Phillipes
- 13.1.9 Singapore
- 13.1.10 Thailandc
- 13.1.11 Rest of Asia Pacific
- 14. South America GCC Smart Furniture Market Analysis, Insights and Forecast, 2020-2032
- 14.1. Market Analysis, Insights and Forecast - By Country/Sub-region
- 14.1.1 Brazil
- 14.1.2 Argentina
- 14.1.3 Peru
- 14.1.4 Chile
- 14.1.5 Colombia
- 14.1.6 Ecuador
- 14.1.7 Venezuela
- 14.1.8 Rest of South America
- 15. North America GCC Smart Furniture Market Analysis, Insights and Forecast, 2020-2032
- 15.1. Market Analysis, Insights and Forecast - By Country/Sub-region
- 15.1.1 United States
- 15.1.2 Canada
- 15.1.3 Mexico
- 16. MEA GCC Smart Furniture Market Analysis, Insights and Forecast, 2020-2032
- 16.1. Market Analysis, Insights and Forecast - By Country/Sub-region
- 16.1.1 United Arab Emirates
- 16.1.2 Saudi Arabia
- 16.1.3 South Africa
- 16.1.4 Rest of Middle East and Africa
- 17. Competitive Analysis
- 17.1. Global Market Share Analysis 2025
- 17.2. Company Profiles
- 17.2.1 Al Huzaifa
- 17.2.1.1. Overview
- 17.2.1.2. Products
- 17.2.1.3. SWOT Analysis
- 17.2.1.4. Recent Developments
- 17.2.1.5. Financials (Based on Availability)
- 17.2.2 Bukannan Furniture
- 17.2.2.1. Overview
- 17.2.2.2. Products
- 17.2.2.3. SWOT Analysis
- 17.2.2.4. Recent Developments
- 17.2.2.5. Financials (Based on Availability)
- 17.2.3 Mordern Gardens
- 17.2.3.1. Overview
- 17.2.3.2. Products
- 17.2.3.3. SWOT Analysis
- 17.2.3.4. Recent Developments
- 17.2.3.5. Financials (Based on Availability)
- 17.2.4 Pan Emirates
- 17.2.4.1. Overview
- 17.2.4.2. Products
- 17.2.4.3. SWOT Analysis
- 17.2.4.4. Recent Developments
- 17.2.4.5. Financials (Based on Availability)
- 17.2.5 Bakri Furniture
- 17.2.5.1. Overview
- 17.2.5.2. Products
- 17.2.5.3. SWOT Analysis
- 17.2.5.4. Recent Developments
- 17.2.5.5. Financials (Based on Availability)
- 17.2.6 Schuco
- 17.2.6.1. Overview
- 17.2.6.2. Products
- 17.2.6.3. SWOT Analysis
- 17.2.6.4. Recent Developments
- 17.2.6.5. Financials (Based on Availability)
- 17.2.7 Ikea
- 17.2.7.1. Overview
- 17.2.7.2. Products
- 17.2.7.3. SWOT Analysis
- 17.2.7.4. Recent Developments
- 17.2.7.5. Financials (Based on Availability)
- 17.2.8 Sagtco
- 17.2.8.1. Overview
- 17.2.8.2. Products
- 17.2.8.3. SWOT Analysis
- 17.2.8.4. Recent Developments
- 17.2.8.5. Financials (Based on Availability)
- 17.2.9 Royal Furniture
- 17.2.9.1. Overview
- 17.2.9.2. Products
- 17.2.9.3. SWOT Analysis
- 17.2.9.4. Recent Developments
- 17.2.9.5. Financials (Based on Availability)
- 17.2.1 Al Huzaifa
List of Figures
- Figure 1: Global GCC Smart Furniture Market Revenue Breakdown (Million, %) by Region 2025 & 2033
- Figure 2: Global GCC Smart Furniture Market Volume Breakdown (K Unit, %) by Region 2025 & 2033
- Figure 3: North America GCC Smart Furniture Market Revenue (Million), by Country 2025 & 2033
- Figure 4: North America GCC Smart Furniture Market Volume (K Unit), by Country 2025 & 2033
- Figure 5: North America GCC Smart Furniture Market Revenue Share (%), by Country 2025 & 2033
- Figure 6: North America GCC Smart Furniture Market Volume Share (%), by Country 2025 & 2033
- Figure 7: Europe GCC Smart Furniture Market Revenue (Million), by Country 2025 & 2033
- Figure 8: Europe GCC Smart Furniture Market Volume (K Unit), by Country 2025 & 2033
- Figure 9: Europe GCC Smart Furniture Market Revenue Share (%), by Country 2025 & 2033
- Figure 10: Europe GCC Smart Furniture Market Volume Share (%), by Country 2025 & 2033
- Figure 11: Asia Pacific GCC Smart Furniture Market Revenue (Million), by Country 2025 & 2033
- Figure 12: Asia Pacific GCC Smart Furniture Market Volume (K Unit), by Country 2025 & 2033
- Figure 13: Asia Pacific GCC Smart Furniture Market Revenue Share (%), by Country 2025 & 2033
- Figure 14: Asia Pacific GCC Smart Furniture Market Volume Share (%), by Country 2025 & 2033
- Figure 15: South America GCC Smart Furniture Market Revenue (Million), by Country 2025 & 2033
- Figure 16: South America GCC Smart Furniture Market Volume (K Unit), by Country 2025 & 2033
- Figure 17: South America GCC Smart Furniture Market Revenue Share (%), by Country 2025 & 2033
- Figure 18: South America GCC Smart Furniture Market Volume Share (%), by Country 2025 & 2033
- Figure 19: North America GCC Smart Furniture Market Revenue (Million), by Country 2025 & 2033
- Figure 20: North America GCC Smart Furniture Market Volume (K Unit), by Country 2025 & 2033
- Figure 21: North America GCC Smart Furniture Market Revenue Share (%), by Country 2025 & 2033
- Figure 22: North America GCC Smart Furniture Market Volume Share (%), by Country 2025 & 2033
- Figure 23: MEA GCC Smart Furniture Market Revenue (Million), by Country 2025 & 2033
- Figure 24: MEA GCC Smart Furniture Market Volume (K Unit), by Country 2025 & 2033
- Figure 25: MEA GCC Smart Furniture Market Revenue Share (%), by Country 2025 & 2033
- Figure 26: MEA GCC Smart Furniture Market Volume Share (%), by Country 2025 & 2033
- Figure 27: UAE GCC Smart Furniture Market Revenue (Million), by Product Type 2025 & 2033
- Figure 28: UAE GCC Smart Furniture Market Volume (K Unit), by Product Type 2025 & 2033
- Figure 29: UAE GCC Smart Furniture Market Revenue Share (%), by Product Type 2025 & 2033
- Figure 30: UAE GCC Smart Furniture Market Volume Share (%), by Product Type 2025 & 2033
- Figure 31: UAE GCC Smart Furniture Market Revenue (Million), by End User 2025 & 2033
- Figure 32: UAE GCC Smart Furniture Market Volume (K Unit), by End User 2025 & 2033
- Figure 33: UAE GCC Smart Furniture Market Revenue Share (%), by End User 2025 & 2033
- Figure 34: UAE GCC Smart Furniture Market Volume Share (%), by End User 2025 & 2033
- Figure 35: UAE GCC Smart Furniture Market Revenue (Million), by DistributionChannel 2025 & 2033
- Figure 36: UAE GCC Smart Furniture Market Volume (K Unit), by DistributionChannel 2025 & 2033
- Figure 37: UAE GCC Smart Furniture Market Revenue Share (%), by DistributionChannel 2025 & 2033
- Figure 38: UAE GCC Smart Furniture Market Volume Share (%), by DistributionChannel 2025 & 2033
- Figure 39: UAE GCC Smart Furniture Market Revenue (Million), by Geography 2025 & 2033
- Figure 40: UAE GCC Smart Furniture Market Volume (K Unit), by Geography 2025 & 2033
- Figure 41: UAE GCC Smart Furniture Market Revenue Share (%), by Geography 2025 & 2033
- Figure 42: UAE GCC Smart Furniture Market Volume Share (%), by Geography 2025 & 2033
- Figure 43: UAE GCC Smart Furniture Market Revenue (Million), by Country 2025 & 2033
- Figure 44: UAE GCC Smart Furniture Market Volume (K Unit), by Country 2025 & 2033
- Figure 45: UAE GCC Smart Furniture Market Revenue Share (%), by Country 2025 & 2033
- Figure 46: UAE GCC Smart Furniture Market Volume Share (%), by Country 2025 & 2033
- Figure 47: Saudi Arabia GCC Smart Furniture Market Revenue (Million), by Product Type 2025 & 2033
- Figure 48: Saudi Arabia GCC Smart Furniture Market Volume (K Unit), by Product Type 2025 & 2033
- Figure 49: Saudi Arabia GCC Smart Furniture Market Revenue Share (%), by Product Type 2025 & 2033
- Figure 50: Saudi Arabia GCC Smart Furniture Market Volume Share (%), by Product Type 2025 & 2033
- Figure 51: Saudi Arabia GCC Smart Furniture Market Revenue (Million), by End User 2025 & 2033
- Figure 52: Saudi Arabia GCC Smart Furniture Market Volume (K Unit), by End User 2025 & 2033
- Figure 53: Saudi Arabia GCC Smart Furniture Market Revenue Share (%), by End User 2025 & 2033
- Figure 54: Saudi Arabia GCC Smart Furniture Market Volume Share (%), by End User 2025 & 2033
- Figure 55: Saudi Arabia GCC Smart Furniture Market Revenue (Million), by DistributionChannel 2025 & 2033
- Figure 56: Saudi Arabia GCC Smart Furniture Market Volume (K Unit), by DistributionChannel 2025 & 2033
- Figure 57: Saudi Arabia GCC Smart Furniture Market Revenue Share (%), by DistributionChannel 2025 & 2033
- Figure 58: Saudi Arabia GCC Smart Furniture Market Volume Share (%), by DistributionChannel 2025 & 2033
- Figure 59: Saudi Arabia GCC Smart Furniture Market Revenue (Million), by Geography 2025 & 2033
- Figure 60: Saudi Arabia GCC Smart Furniture Market Volume (K Unit), by Geography 2025 & 2033
- Figure 61: Saudi Arabia GCC Smart Furniture Market Revenue Share (%), by Geography 2025 & 2033
- Figure 62: Saudi Arabia GCC Smart Furniture Market Volume Share (%), by Geography 2025 & 2033
- Figure 63: Saudi Arabia GCC Smart Furniture Market Revenue (Million), by Country 2025 & 2033
- Figure 64: Saudi Arabia GCC Smart Furniture Market Volume (K Unit), by Country 2025 & 2033
- Figure 65: Saudi Arabia GCC Smart Furniture Market Revenue Share (%), by Country 2025 & 2033
- Figure 66: Saudi Arabia GCC Smart Furniture Market Volume Share (%), by Country 2025 & 2033
- Figure 67: Qatar GCC Smart Furniture Market Revenue (Million), by Product Type 2025 & 2033
- Figure 68: Qatar GCC Smart Furniture Market Volume (K Unit), by Product Type 2025 & 2033
- Figure 69: Qatar GCC Smart Furniture Market Revenue Share (%), by Product Type 2025 & 2033
- Figure 70: Qatar GCC Smart Furniture Market Volume Share (%), by Product Type 2025 & 2033
- Figure 71: Qatar GCC Smart Furniture Market Revenue (Million), by End User 2025 & 2033
- Figure 72: Qatar GCC Smart Furniture Market Volume (K Unit), by End User 2025 & 2033
- Figure 73: Qatar GCC Smart Furniture Market Revenue Share (%), by End User 2025 & 2033
- Figure 74: Qatar GCC Smart Furniture Market Volume Share (%), by End User 2025 & 2033
- Figure 75: Qatar GCC Smart Furniture Market Revenue (Million), by DistributionChannel 2025 & 2033
- Figure 76: Qatar GCC Smart Furniture Market Volume (K Unit), by DistributionChannel 2025 & 2033
- Figure 77: Qatar GCC Smart Furniture Market Revenue Share (%), by DistributionChannel 2025 & 2033
- Figure 78: Qatar GCC Smart Furniture Market Volume Share (%), by DistributionChannel 2025 & 2033
- Figure 79: Qatar GCC Smart Furniture Market Revenue (Million), by Geography 2025 & 2033
- Figure 80: Qatar GCC Smart Furniture Market Volume (K Unit), by Geography 2025 & 2033
- Figure 81: Qatar GCC Smart Furniture Market Revenue Share (%), by Geography 2025 & 2033
- Figure 82: Qatar GCC Smart Furniture Market Volume Share (%), by Geography 2025 & 2033
- Figure 83: Qatar GCC Smart Furniture Market Revenue (Million), by Country 2025 & 2033
- Figure 84: Qatar GCC Smart Furniture Market Volume (K Unit), by Country 2025 & 2033
- Figure 85: Qatar GCC Smart Furniture Market Revenue Share (%), by Country 2025 & 2033
- Figure 86: Qatar GCC Smart Furniture Market Volume Share (%), by Country 2025 & 2033
- Figure 87: Kuwait GCC Smart Furniture Market Revenue (Million), by Product Type 2025 & 2033
- Figure 88: Kuwait GCC Smart Furniture Market Volume (K Unit), by Product Type 2025 & 2033
- Figure 89: Kuwait GCC Smart Furniture Market Revenue Share (%), by Product Type 2025 & 2033
- Figure 90: Kuwait GCC Smart Furniture Market Volume Share (%), by Product Type 2025 & 2033
- Figure 91: Kuwait GCC Smart Furniture Market Revenue (Million), by End User 2025 & 2033
- Figure 92: Kuwait GCC Smart Furniture Market Volume (K Unit), by End User 2025 & 2033
- Figure 93: Kuwait GCC Smart Furniture Market Revenue Share (%), by End User 2025 & 2033
- Figure 94: Kuwait GCC Smart Furniture Market Volume Share (%), by End User 2025 & 2033
- Figure 95: Kuwait GCC Smart Furniture Market Revenue (Million), by DistributionChannel 2025 & 2033
- Figure 96: Kuwait GCC Smart Furniture Market Volume (K Unit), by DistributionChannel 2025 & 2033
- Figure 97: Kuwait GCC Smart Furniture Market Revenue Share (%), by DistributionChannel 2025 & 2033
- Figure 98: Kuwait GCC Smart Furniture Market Volume Share (%), by DistributionChannel 2025 & 2033
- Figure 99: Kuwait GCC Smart Furniture Market Revenue (Million), by Geography 2025 & 2033
- Figure 100: Kuwait GCC Smart Furniture Market Volume (K Unit), by Geography 2025 & 2033
- Figure 101: Kuwait GCC Smart Furniture Market Revenue Share (%), by Geography 2025 & 2033
- Figure 102: Kuwait GCC Smart Furniture Market Volume Share (%), by Geography 2025 & 2033
- Figure 103: Kuwait GCC Smart Furniture Market Revenue (Million), by Country 2025 & 2033
- Figure 104: Kuwait GCC Smart Furniture Market Volume (K Unit), by Country 2025 & 2033
- Figure 105: Kuwait GCC Smart Furniture Market Revenue Share (%), by Country 2025 & 2033
- Figure 106: Kuwait GCC Smart Furniture Market Volume Share (%), by Country 2025 & 2033
- Figure 107: Rest of GCC Countries GCC Smart Furniture Market Revenue (Million), by Product Type 2025 & 2033
- Figure 108: Rest of GCC Countries GCC Smart Furniture Market Volume (K Unit), by Product Type 2025 & 2033
- Figure 109: Rest of GCC Countries GCC Smart Furniture Market Revenue Share (%), by Product Type 2025 & 2033
- Figure 110: Rest of GCC Countries GCC Smart Furniture Market Volume Share (%), by Product Type 2025 & 2033
- Figure 111: Rest of GCC Countries GCC Smart Furniture Market Revenue (Million), by End User 2025 & 2033
- Figure 112: Rest of GCC Countries GCC Smart Furniture Market Volume (K Unit), by End User 2025 & 2033
- Figure 113: Rest of GCC Countries GCC Smart Furniture Market Revenue Share (%), by End User 2025 & 2033
- Figure 114: Rest of GCC Countries GCC Smart Furniture Market Volume Share (%), by End User 2025 & 2033
- Figure 115: Rest of GCC Countries GCC Smart Furniture Market Revenue (Million), by DistributionChannel 2025 & 2033
- Figure 116: Rest of GCC Countries GCC Smart Furniture Market Volume (K Unit), by DistributionChannel 2025 & 2033
- Figure 117: Rest of GCC Countries GCC Smart Furniture Market Revenue Share (%), by DistributionChannel 2025 & 2033
- Figure 118: Rest of GCC Countries GCC Smart Furniture Market Volume Share (%), by DistributionChannel 2025 & 2033
- Figure 119: Rest of GCC Countries GCC Smart Furniture Market Revenue (Million), by Geography 2025 & 2033
- Figure 120: Rest of GCC Countries GCC Smart Furniture Market Volume (K Unit), by Geography 2025 & 2033
- Figure 121: Rest of GCC Countries GCC Smart Furniture Market Revenue Share (%), by Geography 2025 & 2033
- Figure 122: Rest of GCC Countries GCC Smart Furniture Market Volume Share (%), by Geography 2025 & 2033
- Figure 123: Rest of GCC Countries GCC Smart Furniture Market Revenue (Million), by Country 2025 & 2033
- Figure 124: Rest of GCC Countries GCC Smart Furniture Market Volume (K Unit), by Country 2025 & 2033
- Figure 125: Rest of GCC Countries GCC Smart Furniture Market Revenue Share (%), by Country 2025 & 2033
- Figure 126: Rest of GCC Countries GCC Smart Furniture Market Volume Share (%), by Country 2025 & 2033
List of Tables
- Table 1: Global GCC Smart Furniture Market Revenue Million Forecast, by Region 2020 & 2033
- Table 2: Global GCC Smart Furniture Market Volume K Unit Forecast, by Region 2020 & 2033
- Table 3: Global GCC Smart Furniture Market Revenue Million Forecast, by Product Type 2020 & 2033
- Table 4: Global GCC Smart Furniture Market Volume K Unit Forecast, by Product Type 2020 & 2033
- Table 5: Global GCC Smart Furniture Market Revenue Million Forecast, by End User 2020 & 2033
- Table 6: Global GCC Smart Furniture Market Volume K Unit Forecast, by End User 2020 & 2033
- Table 7: Global GCC Smart Furniture Market Revenue Million Forecast, by DistributionChannel 2020 & 2033
- Table 8: Global GCC Smart Furniture Market Volume K Unit Forecast, by DistributionChannel 2020 & 2033
- Table 9: Global GCC Smart Furniture Market Revenue Million Forecast, by Geography 2020 & 2033
- Table 10: Global GCC Smart Furniture Market Volume K Unit Forecast, by Geography 2020 & 2033
- Table 11: Global GCC Smart Furniture Market Revenue Million Forecast, by Region 2020 & 2033
- Table 12: Global GCC Smart Furniture Market Volume K Unit Forecast, by Region 2020 & 2033
- Table 13: Global GCC Smart Furniture Market Revenue Million Forecast, by Country 2020 & 2033
- Table 14: Global GCC Smart Furniture Market Volume K Unit Forecast, by Country 2020 & 2033
- Table 15: United States GCC Smart Furniture Market Revenue (Million) Forecast, by Application 2020 & 2033
- Table 16: United States GCC Smart Furniture Market Volume (K Unit) Forecast, by Application 2020 & 2033
- Table 17: Canada GCC Smart Furniture Market Revenue (Million) Forecast, by Application 2020 & 2033
- Table 18: Canada GCC Smart Furniture Market Volume (K Unit) Forecast, by Application 2020 & 2033
- Table 19: Mexico GCC Smart Furniture Market Revenue (Million) Forecast, by Application 2020 & 2033
- Table 20: Mexico GCC Smart Furniture Market Volume (K Unit) Forecast, by Application 2020 & 2033
- Table 21: Global GCC Smart Furniture Market Revenue Million Forecast, by Country 2020 & 2033
- Table 22: Global GCC Smart Furniture Market Volume K Unit Forecast, by Country 2020 & 2033
- Table 23: Germany GCC Smart Furniture Market Revenue (Million) Forecast, by Application 2020 & 2033
- Table 24: Germany GCC Smart Furniture Market Volume (K Unit) Forecast, by Application 2020 & 2033
- Table 25: United Kingdom GCC Smart Furniture Market Revenue (Million) Forecast, by Application 2020 & 2033
- Table 26: United Kingdom GCC Smart Furniture Market Volume (K Unit) Forecast, by Application 2020 & 2033
- Table 27: France GCC Smart Furniture Market Revenue (Million) Forecast, by Application 2020 & 2033
- Table 28: France GCC Smart Furniture Market Volume (K Unit) Forecast, by Application 2020 & 2033
- Table 29: Spain GCC Smart Furniture Market Revenue (Million) Forecast, by Application 2020 & 2033
- Table 30: Spain GCC Smart Furniture Market Volume (K Unit) Forecast, by Application 2020 & 2033
- Table 31: Italy GCC Smart Furniture Market Revenue (Million) Forecast, by Application 2020 & 2033
- Table 32: Italy GCC Smart Furniture Market Volume (K Unit) Forecast, by Application 2020 & 2033
- Table 33: Spain GCC Smart Furniture Market Revenue (Million) Forecast, by Application 2020 & 2033
- Table 34: Spain GCC Smart Furniture Market Volume (K Unit) Forecast, by Application 2020 & 2033
- Table 35: Belgium GCC Smart Furniture Market Revenue (Million) Forecast, by Application 2020 & 2033
- Table 36: Belgium GCC Smart Furniture Market Volume (K Unit) Forecast, by Application 2020 & 2033
- Table 37: Netherland GCC Smart Furniture Market Revenue (Million) Forecast, by Application 2020 & 2033
- Table 38: Netherland GCC Smart Furniture Market Volume (K Unit) Forecast, by Application 2020 & 2033
- Table 39: Nordics GCC Smart Furniture Market Revenue (Million) Forecast, by Application 2020 & 2033
- Table 40: Nordics GCC Smart Furniture Market Volume (K Unit) Forecast, by Application 2020 & 2033
- Table 41: Rest of Europe GCC Smart Furniture Market Revenue (Million) Forecast, by Application 2020 & 2033
- Table 42: Rest of Europe GCC Smart Furniture Market Volume (K Unit) Forecast, by Application 2020 & 2033
- Table 43: Global GCC Smart Furniture Market Revenue Million Forecast, by Country 2020 & 2033
- Table 44: Global GCC Smart Furniture Market Volume K Unit Forecast, by Country 2020 & 2033
- Table 45: China GCC Smart Furniture Market Revenue (Million) Forecast, by Application 2020 & 2033
- Table 46: China GCC Smart Furniture Market Volume (K Unit) Forecast, by Application 2020 & 2033
- Table 47: Japan GCC Smart Furniture Market Revenue (Million) Forecast, by Application 2020 & 2033
- Table 48: Japan GCC Smart Furniture Market Volume (K Unit) Forecast, by Application 2020 & 2033
- Table 49: India GCC Smart Furniture Market Revenue (Million) Forecast, by Application 2020 & 2033
- Table 50: India GCC Smart Furniture Market Volume (K Unit) Forecast, by Application 2020 & 2033
- Table 51: South Korea GCC Smart Furniture Market Revenue (Million) Forecast, by Application 2020 & 2033
- Table 52: South Korea GCC Smart Furniture Market Volume (K Unit) Forecast, by Application 2020 & 2033
- Table 53: Southeast Asia GCC Smart Furniture Market Revenue (Million) Forecast, by Application 2020 & 2033
- Table 54: Southeast Asia GCC Smart Furniture Market Volume (K Unit) Forecast, by Application 2020 & 2033
- Table 55: Australia GCC Smart Furniture Market Revenue (Million) Forecast, by Application 2020 & 2033
- Table 56: Australia GCC Smart Furniture Market Volume (K Unit) Forecast, by Application 2020 & 2033
- Table 57: Indonesia GCC Smart Furniture Market Revenue (Million) Forecast, by Application 2020 & 2033
- Table 58: Indonesia GCC Smart Furniture Market Volume (K Unit) Forecast, by Application 2020 & 2033
- Table 59: Phillipes GCC Smart Furniture Market Revenue (Million) Forecast, by Application 2020 & 2033
- Table 60: Phillipes GCC Smart Furniture Market Volume (K Unit) Forecast, by Application 2020 & 2033
- Table 61: Singapore GCC Smart Furniture Market Revenue (Million) Forecast, by Application 2020 & 2033
- Table 62: Singapore GCC Smart Furniture Market Volume (K Unit) Forecast, by Application 2020 & 2033
- Table 63: Thailandc GCC Smart Furniture Market Revenue (Million) Forecast, by Application 2020 & 2033
- Table 64: Thailandc GCC Smart Furniture Market Volume (K Unit) Forecast, by Application 2020 & 2033
- Table 65: Rest of Asia Pacific GCC Smart Furniture Market Revenue (Million) Forecast, by Application 2020 & 2033
- Table 66: Rest of Asia Pacific GCC Smart Furniture Market Volume (K Unit) Forecast, by Application 2020 & 2033
- Table 67: Global GCC Smart Furniture Market Revenue Million Forecast, by Country 2020 & 2033
- Table 68: Global GCC Smart Furniture Market Volume K Unit Forecast, by Country 2020 & 2033
- Table 69: Brazil GCC Smart Furniture Market Revenue (Million) Forecast, by Application 2020 & 2033
- Table 70: Brazil GCC Smart Furniture Market Volume (K Unit) Forecast, by Application 2020 & 2033
- Table 71: Argentina GCC Smart Furniture Market Revenue (Million) Forecast, by Application 2020 & 2033
- Table 72: Argentina GCC Smart Furniture Market Volume (K Unit) Forecast, by Application 2020 & 2033
- Table 73: Peru GCC Smart Furniture Market Revenue (Million) Forecast, by Application 2020 & 2033
- Table 74: Peru GCC Smart Furniture Market Volume (K Unit) Forecast, by Application 2020 & 2033
- Table 75: Chile GCC Smart Furniture Market Revenue (Million) Forecast, by Application 2020 & 2033
- Table 76: Chile GCC Smart Furniture Market Volume (K Unit) Forecast, by Application 2020 & 2033
- Table 77: Colombia GCC Smart Furniture Market Revenue (Million) Forecast, by Application 2020 & 2033
- Table 78: Colombia GCC Smart Furniture Market Volume (K Unit) Forecast, by Application 2020 & 2033
- Table 79: Ecuador GCC Smart Furniture Market Revenue (Million) Forecast, by Application 2020 & 2033
- Table 80: Ecuador GCC Smart Furniture Market Volume (K Unit) Forecast, by Application 2020 & 2033
- Table 81: Venezuela GCC Smart Furniture Market Revenue (Million) Forecast, by Application 2020 & 2033
- Table 82: Venezuela GCC Smart Furniture Market Volume (K Unit) Forecast, by Application 2020 & 2033
- Table 83: Rest of South America GCC Smart Furniture Market Revenue (Million) Forecast, by Application 2020 & 2033
- Table 84: Rest of South America GCC Smart Furniture Market Volume (K Unit) Forecast, by Application 2020 & 2033
- Table 85: Global GCC Smart Furniture Market Revenue Million Forecast, by Country 2020 & 2033
- Table 86: Global GCC Smart Furniture Market Volume K Unit Forecast, by Country 2020 & 2033
- Table 87: United States GCC Smart Furniture Market Revenue (Million) Forecast, by Application 2020 & 2033
- Table 88: United States GCC Smart Furniture Market Volume (K Unit) Forecast, by Application 2020 & 2033
- Table 89: Canada GCC Smart Furniture Market Revenue (Million) Forecast, by Application 2020 & 2033
- Table 90: Canada GCC Smart Furniture Market Volume (K Unit) Forecast, by Application 2020 & 2033
- Table 91: Mexico GCC Smart Furniture Market Revenue (Million) Forecast, by Application 2020 & 2033
- Table 92: Mexico GCC Smart Furniture Market Volume (K Unit) Forecast, by Application 2020 & 2033
- Table 93: Global GCC Smart Furniture Market Revenue Million Forecast, by Country 2020 & 2033
- Table 94: Global GCC Smart Furniture Market Volume K Unit Forecast, by Country 2020 & 2033
- Table 95: United Arab Emirates GCC Smart Furniture Market Revenue (Million) Forecast, by Application 2020 & 2033
- Table 96: United Arab Emirates GCC Smart Furniture Market Volume (K Unit) Forecast, by Application 2020 & 2033
- Table 97: Saudi Arabia GCC Smart Furniture Market Revenue (Million) Forecast, by Application 2020 & 2033
- Table 98: Saudi Arabia GCC Smart Furniture Market Volume (K Unit) Forecast, by Application 2020 & 2033
- Table 99: South Africa GCC Smart Furniture Market Revenue (Million) Forecast, by Application 2020 & 2033
- Table 100: South Africa GCC Smart Furniture Market Volume (K Unit) Forecast, by Application 2020 & 2033
- Table 101: Rest of Middle East and Africa GCC Smart Furniture Market Revenue (Million) Forecast, by Application 2020 & 2033
- Table 102: Rest of Middle East and Africa GCC Smart Furniture Market Volume (K Unit) Forecast, by Application 2020 & 2033
- Table 103: Global GCC Smart Furniture Market Revenue Million Forecast, by Product Type 2020 & 2033
- Table 104: Global GCC Smart Furniture Market Volume K Unit Forecast, by Product Type 2020 & 2033
- Table 105: Global GCC Smart Furniture Market Revenue Million Forecast, by End User 2020 & 2033
- Table 106: Global GCC Smart Furniture Market Volume K Unit Forecast, by End User 2020 & 2033
- Table 107: Global GCC Smart Furniture Market Revenue Million Forecast, by DistributionChannel 2020 & 2033
- Table 108: Global GCC Smart Furniture Market Volume K Unit Forecast, by DistributionChannel 2020 & 2033
- Table 109: Global GCC Smart Furniture Market Revenue Million Forecast, by Geography 2020 & 2033
- Table 110: Global GCC Smart Furniture Market Volume K Unit Forecast, by Geography 2020 & 2033
- Table 111: Global GCC Smart Furniture Market Revenue Million Forecast, by Country 2020 & 2033
- Table 112: Global GCC Smart Furniture Market Volume K Unit Forecast, by Country 2020 & 2033
- Table 113: Global GCC Smart Furniture Market Revenue Million Forecast, by Product Type 2020 & 2033
- Table 114: Global GCC Smart Furniture Market Volume K Unit Forecast, by Product Type 2020 & 2033
- Table 115: Global GCC Smart Furniture Market Revenue Million Forecast, by End User 2020 & 2033
- Table 116: Global GCC Smart Furniture Market Volume K Unit Forecast, by End User 2020 & 2033
- Table 117: Global GCC Smart Furniture Market Revenue Million Forecast, by DistributionChannel 2020 & 2033
- Table 118: Global GCC Smart Furniture Market Volume K Unit Forecast, by DistributionChannel 2020 & 2033
- Table 119: Global GCC Smart Furniture Market Revenue Million Forecast, by Geography 2020 & 2033
- Table 120: Global GCC Smart Furniture Market Volume K Unit Forecast, by Geography 2020 & 2033
- Table 121: Global GCC Smart Furniture Market Revenue Million Forecast, by Country 2020 & 2033
- Table 122: Global GCC Smart Furniture Market Volume K Unit Forecast, by Country 2020 & 2033
- Table 123: Global GCC Smart Furniture Market Revenue Million Forecast, by Product Type 2020 & 2033
- Table 124: Global GCC Smart Furniture Market Volume K Unit Forecast, by Product Type 2020 & 2033
- Table 125: Global GCC Smart Furniture Market Revenue Million Forecast, by End User 2020 & 2033
- Table 126: Global GCC Smart Furniture Market Volume K Unit Forecast, by End User 2020 & 2033
- Table 127: Global GCC Smart Furniture Market Revenue Million Forecast, by DistributionChannel 2020 & 2033
- Table 128: Global GCC Smart Furniture Market Volume K Unit Forecast, by DistributionChannel 2020 & 2033
- Table 129: Global GCC Smart Furniture Market Revenue Million Forecast, by Geography 2020 & 2033
- Table 130: Global GCC Smart Furniture Market Volume K Unit Forecast, by Geography 2020 & 2033
- Table 131: Global GCC Smart Furniture Market Revenue Million Forecast, by Country 2020 & 2033
- Table 132: Global GCC Smart Furniture Market Volume K Unit Forecast, by Country 2020 & 2033
- Table 133: Global GCC Smart Furniture Market Revenue Million Forecast, by Product Type 2020 & 2033
- Table 134: Global GCC Smart Furniture Market Volume K Unit Forecast, by Product Type 2020 & 2033
- Table 135: Global GCC Smart Furniture Market Revenue Million Forecast, by End User 2020 & 2033
- Table 136: Global GCC Smart Furniture Market Volume K Unit Forecast, by End User 2020 & 2033
- Table 137: Global GCC Smart Furniture Market Revenue Million Forecast, by DistributionChannel 2020 & 2033
- Table 138: Global GCC Smart Furniture Market Volume K Unit Forecast, by DistributionChannel 2020 & 2033
- Table 139: Global GCC Smart Furniture Market Revenue Million Forecast, by Geography 2020 & 2033
- Table 140: Global GCC Smart Furniture Market Volume K Unit Forecast, by Geography 2020 & 2033
- Table 141: Global GCC Smart Furniture Market Revenue Million Forecast, by Country 2020 & 2033
- Table 142: Global GCC Smart Furniture Market Volume K Unit Forecast, by Country 2020 & 2033
- Table 143: Global GCC Smart Furniture Market Revenue Million Forecast, by Product Type 2020 & 2033
- Table 144: Global GCC Smart Furniture Market Volume K Unit Forecast, by Product Type 2020 & 2033
- Table 145: Global GCC Smart Furniture Market Revenue Million Forecast, by End User 2020 & 2033
- Table 146: Global GCC Smart Furniture Market Volume K Unit Forecast, by End User 2020 & 2033
- Table 147: Global GCC Smart Furniture Market Revenue Million Forecast, by DistributionChannel 2020 & 2033
- Table 148: Global GCC Smart Furniture Market Volume K Unit Forecast, by DistributionChannel 2020 & 2033
- Table 149: Global GCC Smart Furniture Market Revenue Million Forecast, by Geography 2020 & 2033
- Table 150: Global GCC Smart Furniture Market Volume K Unit Forecast, by Geography 2020 & 2033
- Table 151: Global GCC Smart Furniture Market Revenue Million Forecast, by Country 2020 & 2033
- Table 152: Global GCC Smart Furniture Market Volume K Unit Forecast, by Country 2020 & 2033
Frequently Asked Questions
1. What is the projected Compound Annual Growth Rate (CAGR) of the GCC Smart Furniture Market?
The projected CAGR is approximately > 5.00%.
2. Which companies are prominent players in the GCC Smart Furniture Market?
Key companies in the market include Al Huzaifa, Bukannan Furniture, Mordern Gardens, Pan Emirates, Bakri Furniture, Schuco, Ikea, Sagtco, Royal Furniture.
3. What are the main segments of the GCC Smart Furniture Market?
The market segments include Product Type, End User, DistributionChannel, Geography.
4. Can you provide details about the market size?
The market size is estimated to be USD XX Million as of 2022.
5. What are some drivers contributing to market growth?
Increasing Online Sales is Driving the Market; Growing Urbanisation is Driving need for Small Appliances.
6. What are the notable trends driving market growth?
Rise in Consumer Expenditure on Home Improvement Fuels the Market.
7. Are there any restraints impacting market growth?
Changing Needs of Customers; Limited Usage of the Product.
8. Can you provide examples of recent developments in the market?
N/A
9. What pricing options are available for accessing the report?
Pricing options include single-user, multi-user, and enterprise licenses priced at USD 4750, USD 5250, and USD 8750 respectively.
10. Is the market size provided in terms of value or volume?
The market size is provided in terms of value, measured in Million and volume, measured in K Unit.
11. Are there any specific market keywords associated with the report?
Yes, the market keyword associated with the report is "GCC Smart Furniture Market," which aids in identifying and referencing the specific market segment covered.
12. How do I determine which pricing option suits my needs best?
The pricing options vary based on user requirements and access needs. Individual users may opt for single-user licenses, while businesses requiring broader access may choose multi-user or enterprise licenses for cost-effective access to the report.
13. Are there any additional resources or data provided in the GCC Smart Furniture Market report?
While the report offers comprehensive insights, it's advisable to review the specific contents or supplementary materials provided to ascertain if additional resources or data are available.
14. How can I stay updated on further developments or reports in the GCC Smart Furniture Market?
To stay informed about further developments, trends, and reports in the GCC Smart Furniture Market, consider subscribing to industry newsletters, following relevant companies and organizations, or regularly checking reputable industry news sources and publications.
Methodology
Step 1 - Identification of Relevant Samples Size from Population Database


Step 2 - Approaches for Defining Global Market Size (Value, Volume* & Price*)

Note*: In applicable scenarios
Step 3 - Data Sources
Primary Research
- Web Analytics
- Survey Reports
- Research Institute
- Latest Research Reports
- Opinion Leaders
Secondary Research
- Annual Reports
- White Paper
- Latest Press Release
- Industry Association
- Paid Database
- Investor Presentations

Step 4 - Data Triangulation
Involves using different sources of information in order to increase the validity of a study
These sources are likely to be stakeholders in a program - participants, other researchers, program staff, other community members, and so on.
Then we put all data in single framework & apply various statistical tools to find out the dynamic on the market.
During the analysis stage, feedback from the stakeholder groups would be compared to determine areas of agreement as well as areas of divergence
