
Key Insights
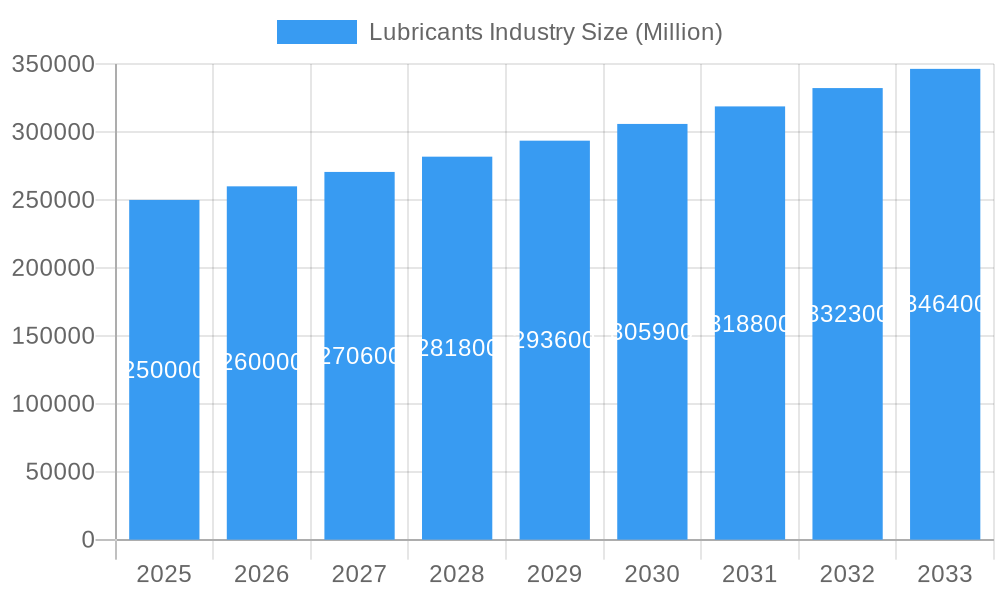
The global lubricants market is a substantial and dynamic sector, exhibiting consistent growth driven by the burgeoning automotive industry, expanding industrial machinery usage, and the increasing demand for high-performance lubricants in specialized applications. The market's Compound Annual Growth Rate (CAGR) is estimated at 4% based on industry trends and recent market reports, indicating a steady expansion. Key growth drivers include the rise of emerging economies with expanding vehicle fleets and industrialization, the increasing adoption of advanced lubricant technologies for enhanced fuel efficiency and engine life, and stringent environmental regulations promoting the use of eco-friendly lubricants. The market is segmented by product type (engine oils, gear oils, greases, etc.), application (automotive, industrial, marine, etc.), and geography. Competition is intense, with major players like ExxonMobil, Shell, BP, and others vying for market share through innovation, brand building, and strategic partnerships. Price fluctuations in crude oil, a key raw material, represent a significant challenge, impacting profitability and market stability.

Lubricants Industry Market Size (In Billion)
The future of the lubricants market looks promising, driven by sustained economic growth in developing nations, the ongoing transition to electric vehicles (although requiring specialized lubricants for their unique needs), and increasing demand for specialized high-performance lubricants for aerospace and other advanced technologies. However, challenges remain. Fluctuations in crude oil prices and the intensifying competition from both established players and new entrants necessitate continuous innovation and strategic adjustments. Furthermore, stricter environmental regulations require manufacturers to adapt by developing and marketing sustainable, biodegradable lubricants. The overall outlook suggests a continued, although potentially moderated, growth trajectory for the foreseeable future, with opportunities for players that prioritize innovation, sustainability, and effective market penetration strategies.
Lubricants Industry Company Market Share
Lubricants Industry Market Report: 2019-2033
This comprehensive report provides a detailed analysis of the global lubricants industry, offering invaluable insights for stakeholders seeking to understand market dynamics, competitive landscapes, and future growth potential. The study covers the period from 2019 to 2033, with a focus on the base year 2025 and a forecast period of 2025-2033. The report utilizes a combination of quantitative data and qualitative analysis to deliver a robust understanding of this dynamic market. Expect detailed analysis on market segmentation, key players, growth drivers and challenges and industry milestones, all backed by extensive research and data. The total market size is estimated at $xx Million in 2025, projecting robust growth throughout the forecast period.
Lubricants Industry Market Structure & Competitive Landscape
The global lubricants market exhibits a moderately concentrated structure, with a handful of multinational corporations holding significant market share. The Herfindahl-Hirschman Index (HHI) is estimated at xx, indicating a moderately concentrated market. Innovation is a key driver, with companies continuously investing in research and development to improve lubricant performance, efficiency, and sustainability. Stringent environmental regulations are increasingly impacting the industry, prompting the adoption of eco-friendly formulations and sustainable manufacturing practices. Product substitution, particularly with the rise of bio-lubricants, presents both opportunities and challenges. The market is segmented by various end-users, including automotive, industrial, and agricultural sectors. Mergers and acquisitions (M&A) activity has been relatively high in recent years, with several major players consolidating their positions through strategic acquisitions, totaling approximately $xx Million in value during the historical period (2019-2024).
- High Market Concentration: Top 5 players account for approximately xx% of global market share.
- Innovation Focus: R&D investments are directed towards biodegradable lubricants, energy-efficient formulations, and advanced additive technologies.
- Regulatory Scrutiny: Compliance with environmental regulations (e.g., emission standards) is driving product reformulation and process optimization.
- Product Substitution: Bio-lubricants and other alternative products are gaining traction, posing a challenge to traditional lubricant manufacturers.
- End-User Segmentation: Automotive, industrial, and agricultural segments drive most of the demand, with varying growth rates and trends.
- M&A Activity: Strategic acquisitions and mergers are reshaping the industry landscape, leading to increased market consolidation.
Lubricants Industry Market Trends & Opportunities
The global lubricants market is poised for significant growth in the forecast period (2025-2033), driven by several key factors. The market size is projected to reach $xx Million by 2033, exhibiting a Compound Annual Growth Rate (CAGR) of xx%. This growth is fueled by increasing vehicle ownership, especially in developing economies, and the expansion of industrial and manufacturing activities worldwide. Technological advancements are contributing to the development of higher-performance lubricants, extending equipment life, and improving fuel efficiency. Consumer preferences are shifting towards environmentally friendly and sustainable options, creating opportunities for bio-lubricants and other eco-conscious products. Market penetration rates for high-performance lubricants are rising across various segments. The competitive landscape is characterized by intense rivalry among major players, leading to product innovation, strategic partnerships, and price competition.
Dominant Markets & Segments in Lubricants Industry
The Asia-Pacific region is currently the dominant market for lubricants, driven by rapid economic growth, expanding automotive and industrial sectors, and rising infrastructure development. China and India are key contributors to this regional dominance.
- Key Growth Drivers in Asia-Pacific:
- Rapid industrialization and infrastructure development.
- Growing automotive sector and increased vehicle ownership.
- Expanding manufacturing and processing industries.
- Favorable government policies and investments in infrastructure.
- Increasing demand for high-performance lubricants in various industrial applications.
The automotive segment holds the largest market share within the overall lubricants industry, primarily driven by the rising global vehicle population and the increasing demand for passenger and commercial vehicles.
Lubricants Industry Product Analysis
The lubricants industry showcases continuous product innovation, focusing on enhanced performance, efficiency, and environmental sustainability. Technological advancements have led to the development of synthetic lubricants, bio-lubricants, and specialized formulations designed to meet the demands of specific applications. These innovations cater to various end-users, offering improved fuel economy, extended equipment life, and reduced environmental impact. The competitive landscape necessitates companies to constantly differentiate their offerings through superior performance characteristics and value-added features, focusing on features like extended drain intervals and enhanced viscosity stability.
Key Drivers, Barriers & Challenges in Lubricants Industry
Key Drivers:
- Growing automotive sector: The rising number of vehicles globally, particularly in emerging markets, fuels demand for automotive lubricants.
- Industrial expansion: Growth in manufacturing and industrial activities creates substantial demand for industrial lubricants.
- Technological advancements: Innovations in lubricant formulations improve performance and extend equipment lifespan.
- Government regulations: Stringent emission standards drive the adoption of environmentally friendly lubricants.
Key Challenges:
- Fluctuating crude oil prices: Oil price volatility directly impacts lubricant production costs and profitability.
- Intense competition: The presence of numerous players creates a fiercely competitive market.
- Environmental concerns: Regulations targeting environmentally damaging products are creating pressure on companies to innovate and adopt sustainable practices.
- Supply chain disruptions: Global supply chain issues can affect the availability of raw materials and impact production.
Growth Drivers in the Lubricants Industry Market
The lubricants market's growth is primarily driven by the burgeoning automotive and industrial sectors, especially in emerging economies. Technological progress, resulting in higher-performing and environmentally friendly lubricants, also plays a significant role. Stringent environmental regulations are forcing manufacturers to develop more sustainable products, opening new market segments. Government policies supporting infrastructure development further boost demand for lubricants across various sectors.
Challenges Impacting Lubricants Industry Growth
Significant challenges include fluctuating crude oil prices impacting production costs, intensifying competition among numerous players, and the increasing need for sustainable and environmentally compliant products. Supply chain disruptions and geopolitical uncertainties also pose risks to market stability and growth. Furthermore, stringent environmental regulations may require substantial investments in research and development to meet compliance standards.
Key Players Shaping the Lubricants Industry Market
- Behran Oil Company
- BP PLC (Castrol)
- Carl Bechem GmbH
- Chevron Corporation
- China National Petroleum Corporation
- China Petroleum & Chemical Corporation
- Cooperative Soceite des petroleum
- ENEOS Corporation
- Eni SpA
- ExxonMobil Corporation
- FUCHS
- Gazprom
- GS Caltex
- Gulf Oil International
- Hindustan Petroleum Corporation Limited
- Idemitsu Kosan Co Ltd
- Indian Oil Corporation Limited
- Lukoil
- Motul
- Petromin Corporation
- Petronas Lubricants International
- Phillips 66 Lubricants
- PT Pertamina
- PTT Lubricants
- Rosneft
- Royal Dutch Shell PLC
- Terpel
- TotalEnergies
- Valvoline Inc
- YP
Significant Lubricants Industry Industry Milestones
- April 2022: FUCHS company introduced AGRI FARM lubricants, specifically designed for high-end agricultural machinery.
- April 2022: FUCHS Lubricants South Africa launched new food-grade Renolin SJL Heavy and Renolin SJL Winter lubricants for the sugar processing industry, emphasizing equipment longevity and food safety.
- May 2022: TotalEnergies and NEXUS Automotive extended their strategic partnership for five years, expanding TotalEnergies Lubricants' presence in the N! community, which experienced significant sales growth from EUR 7.2 billion in 2015 to nearly EUR 35 billion by the end of 2021.
Future Outlook for Lubricants Industry Market
The lubricants market is projected to experience sustained growth, driven by ongoing industrialization, increasing vehicle ownership, and the adoption of more efficient and environmentally conscious lubricant technologies. Strategic partnerships and technological advancements will continue to shape the competitive landscape, creating opportunities for market expansion and innovation. The demand for sustainable and high-performance lubricants is expected to drive further market growth and specialization in the coming years.
Lubricants Industry Segmentation
-
1. End User
- 1.1. Automotive
- 1.2. Heavy Equipment
- 1.3. Metallurgy & Metalworking
- 1.4. Power Generation
- 1.5. Other End-user Industries
-
2. Product Type
- 2.1. Engine Oils
- 2.2. Greases
- 2.3. Hydraulic Fluids
- 2.4. Metalworking Fluids
- 2.5. Transmission & Gear Oils
- 2.6. Other Product Types
Lubricants Industry Segmentation By Geography
-
1. North America
- 1.1. United States
- 1.2. Canada
- 1.3. Mexico
-
2. South America
- 2.1. Brazil
- 2.2. Argentina
- 2.3. Rest of South America
-
3. Europe
- 3.1. United Kingdom
- 3.2. Germany
- 3.3. France
- 3.4. Italy
- 3.5. Spain
- 3.6. Russia
- 3.7. Benelux
- 3.8. Nordics
- 3.9. Rest of Europe
-
4. Middle East & Africa
- 4.1. Turkey
- 4.2. Israel
- 4.3. GCC
- 4.4. North Africa
- 4.5. South Africa
- 4.6. Rest of Middle East & Africa
-
5. Asia Pacific
- 5.1. China
- 5.2. India
- 5.3. Japan
- 5.4. South Korea
- 5.5. ASEAN
- 5.6. Oceania
- 5.7. Rest of Asia Pacific

Lubricants Industry Regional Market Share
Geographic Coverage of Lubricants Industry
Lubricants Industry REPORT HIGHLIGHTS
| Aspects | Details |
|---|---|
| Study Period | 2020-2034 |
| Base Year | 2025 |
| Estimated Year | 2026 |
| Forecast Period | 2026-2034 |
| Historical Period | 2020-2025 |
| Growth Rate | CAGR of % from 2020-2034 |
| Segmentation |
|
Table of Contents
- 1. Introduction
- 1.1. Research Scope
- 1.2. Market Segmentation
- 1.3. Research Methodology
- 1.4. Definitions and Assumptions
- 2. Executive Summary
- 2.1. Introduction
- 3. Market Dynamics
- 3.1. Introduction
- 3.2. Market Drivers
- 3.3. Market Restrains
- 3.4. Market Trends
- 3.4.1. Largest Segment By End User
- 4. Market Factor Analysis
- 4.1. Porters Five Forces
- 4.2. Supply/Value Chain
- 4.3. PESTEL analysis
- 4.4. Market Entropy
- 4.5. Patent/Trademark Analysis
- 5. Global Lubricants Industry Analysis, Insights and Forecast, 2020-2032
- 5.1. Market Analysis, Insights and Forecast - by End User
- 5.1.1. Automotive
- 5.1.2. Heavy Equipment
- 5.1.3. Metallurgy & Metalworking
- 5.1.4. Power Generation
- 5.1.5. Other End-user Industries
- 5.2. Market Analysis, Insights and Forecast - by Product Type
- 5.2.1. Engine Oils
- 5.2.2. Greases
- 5.2.3. Hydraulic Fluids
- 5.2.4. Metalworking Fluids
- 5.2.5. Transmission & Gear Oils
- 5.2.6. Other Product Types
- 5.3. Market Analysis, Insights and Forecast - by Region
- 5.3.1. North America
- 5.3.2. South America
- 5.3.3. Europe
- 5.3.4. Middle East & Africa
- 5.3.5. Asia Pacific
- 5.1. Market Analysis, Insights and Forecast - by End User
- 6. North America Lubricants Industry Analysis, Insights and Forecast, 2020-2032
- 6.1. Market Analysis, Insights and Forecast - by End User
- 6.1.1. Automotive
- 6.1.2. Heavy Equipment
- 6.1.3. Metallurgy & Metalworking
- 6.1.4. Power Generation
- 6.1.5. Other End-user Industries
- 6.2. Market Analysis, Insights and Forecast - by Product Type
- 6.2.1. Engine Oils
- 6.2.2. Greases
- 6.2.3. Hydraulic Fluids
- 6.2.4. Metalworking Fluids
- 6.2.5. Transmission & Gear Oils
- 6.2.6. Other Product Types
- 6.1. Market Analysis, Insights and Forecast - by End User
- 7. South America Lubricants Industry Analysis, Insights and Forecast, 2020-2032
- 7.1. Market Analysis, Insights and Forecast - by End User
- 7.1.1. Automotive
- 7.1.2. Heavy Equipment
- 7.1.3. Metallurgy & Metalworking
- 7.1.4. Power Generation
- 7.1.5. Other End-user Industries
- 7.2. Market Analysis, Insights and Forecast - by Product Type
- 7.2.1. Engine Oils
- 7.2.2. Greases
- 7.2.3. Hydraulic Fluids
- 7.2.4. Metalworking Fluids
- 7.2.5. Transmission & Gear Oils
- 7.2.6. Other Product Types
- 7.1. Market Analysis, Insights and Forecast - by End User
- 8. Europe Lubricants Industry Analysis, Insights and Forecast, 2020-2032
- 8.1. Market Analysis, Insights and Forecast - by End User
- 8.1.1. Automotive
- 8.1.2. Heavy Equipment
- 8.1.3. Metallurgy & Metalworking
- 8.1.4. Power Generation
- 8.1.5. Other End-user Industries
- 8.2. Market Analysis, Insights and Forecast - by Product Type
- 8.2.1. Engine Oils
- 8.2.2. Greases
- 8.2.3. Hydraulic Fluids
- 8.2.4. Metalworking Fluids
- 8.2.5. Transmission & Gear Oils
- 8.2.6. Other Product Types
- 8.1. Market Analysis, Insights and Forecast - by End User
- 9. Middle East & Africa Lubricants Industry Analysis, Insights and Forecast, 2020-2032
- 9.1. Market Analysis, Insights and Forecast - by End User
- 9.1.1. Automotive
- 9.1.2. Heavy Equipment
- 9.1.3. Metallurgy & Metalworking
- 9.1.4. Power Generation
- 9.1.5. Other End-user Industries
- 9.2. Market Analysis, Insights and Forecast - by Product Type
- 9.2.1. Engine Oils
- 9.2.2. Greases
- 9.2.3. Hydraulic Fluids
- 9.2.4. Metalworking Fluids
- 9.2.5. Transmission & Gear Oils
- 9.2.6. Other Product Types
- 9.1. Market Analysis, Insights and Forecast - by End User
- 10. Asia Pacific Lubricants Industry Analysis, Insights and Forecast, 2020-2032
- 10.1. Market Analysis, Insights and Forecast - by End User
- 10.1.1. Automotive
- 10.1.2. Heavy Equipment
- 10.1.3. Metallurgy & Metalworking
- 10.1.4. Power Generation
- 10.1.5. Other End-user Industries
- 10.2. Market Analysis, Insights and Forecast - by Product Type
- 10.2.1. Engine Oils
- 10.2.2. Greases
- 10.2.3. Hydraulic Fluids
- 10.2.4. Metalworking Fluids
- 10.2.5. Transmission & Gear Oils
- 10.2.6. Other Product Types
- 10.1. Market Analysis, Insights and Forecast - by End User
- 11. Competitive Analysis
- 11.1. Global Market Share Analysis 2025
- 11.2. Company Profiles
- 11.2.1 Behran Oil Company
- 11.2.1.1. Overview
- 11.2.1.2. Products
- 11.2.1.3. SWOT Analysis
- 11.2.1.4. Recent Developments
- 11.2.1.5. Financials (Based on Availability)
- 11.2.2 BP PLC (Castrol)
- 11.2.2.1. Overview
- 11.2.2.2. Products
- 11.2.2.3. SWOT Analysis
- 11.2.2.4. Recent Developments
- 11.2.2.5. Financials (Based on Availability)
- 11.2.3 Carl Bechem GmbH
- 11.2.3.1. Overview
- 11.2.3.2. Products
- 11.2.3.3. SWOT Analysis
- 11.2.3.4. Recent Developments
- 11.2.3.5. Financials (Based on Availability)
- 11.2.4 Chevron Corporation
- 11.2.4.1. Overview
- 11.2.4.2. Products
- 11.2.4.3. SWOT Analysis
- 11.2.4.4. Recent Developments
- 11.2.4.5. Financials (Based on Availability)
- 11.2.5 China National Petroleum Corporation
- 11.2.5.1. Overview
- 11.2.5.2. Products
- 11.2.5.3. SWOT Analysis
- 11.2.5.4. Recent Developments
- 11.2.5.5. Financials (Based on Availability)
- 11.2.6 China Petroleum & Chemical Corporation
- 11.2.6.1. Overview
- 11.2.6.2. Products
- 11.2.6.3. SWOT Analysis
- 11.2.6.4. Recent Developments
- 11.2.6.5. Financials (Based on Availability)
- 11.2.7 Coperative Soceite des petroleum
- 11.2.7.1. Overview
- 11.2.7.2. Products
- 11.2.7.3. SWOT Analysis
- 11.2.7.4. Recent Developments
- 11.2.7.5. Financials (Based on Availability)
- 11.2.8 ENEOS Corporation
- 11.2.8.1. Overview
- 11.2.8.2. Products
- 11.2.8.3. SWOT Analysis
- 11.2.8.4. Recent Developments
- 11.2.8.5. Financials (Based on Availability)
- 11.2.9 Eni SpA
- 11.2.9.1. Overview
- 11.2.9.2. Products
- 11.2.9.3. SWOT Analysis
- 11.2.9.4. Recent Developments
- 11.2.9.5. Financials (Based on Availability)
- 11.2.10 ExxonMobil Corporation
- 11.2.10.1. Overview
- 11.2.10.2. Products
- 11.2.10.3. SWOT Analysis
- 11.2.10.4. Recent Developments
- 11.2.10.5. Financials (Based on Availability)
- 11.2.11 FUCHS
- 11.2.11.1. Overview
- 11.2.11.2. Products
- 11.2.11.3. SWOT Analysis
- 11.2.11.4. Recent Developments
- 11.2.11.5. Financials (Based on Availability)
- 11.2.12 Gazprom
- 11.2.12.1. Overview
- 11.2.12.2. Products
- 11.2.12.3. SWOT Analysis
- 11.2.12.4. Recent Developments
- 11.2.12.5. Financials (Based on Availability)
- 11.2.13 GS Caltex
- 11.2.13.1. Overview
- 11.2.13.2. Products
- 11.2.13.3. SWOT Analysis
- 11.2.13.4. Recent Developments
- 11.2.13.5. Financials (Based on Availability)
- 11.2.14 Gulf Oil International
- 11.2.14.1. Overview
- 11.2.14.2. Products
- 11.2.14.3. SWOT Analysis
- 11.2.14.4. Recent Developments
- 11.2.14.5. Financials (Based on Availability)
- 11.2.15 Hindustan Petroleum Corporation Limited
- 11.2.15.1. Overview
- 11.2.15.2. Products
- 11.2.15.3. SWOT Analysis
- 11.2.15.4. Recent Developments
- 11.2.15.5. Financials (Based on Availability)
- 11.2.16 Idemitsu Kosan Co Ltd
- 11.2.16.1. Overview
- 11.2.16.2. Products
- 11.2.16.3. SWOT Analysis
- 11.2.16.4. Recent Developments
- 11.2.16.5. Financials (Based on Availability)
- 11.2.17 Indian Oil Corporation Limited
- 11.2.17.1. Overview
- 11.2.17.2. Products
- 11.2.17.3. SWOT Analysis
- 11.2.17.4. Recent Developments
- 11.2.17.5. Financials (Based on Availability)
- 11.2.18 Lukoil
- 11.2.18.1. Overview
- 11.2.18.2. Products
- 11.2.18.3. SWOT Analysis
- 11.2.18.4. Recent Developments
- 11.2.18.5. Financials (Based on Availability)
- 11.2.19 Motul
- 11.2.19.1. Overview
- 11.2.19.2. Products
- 11.2.19.3. SWOT Analysis
- 11.2.19.4. Recent Developments
- 11.2.19.5. Financials (Based on Availability)
- 11.2.20 Petromin Corporation
- 11.2.20.1. Overview
- 11.2.20.2. Products
- 11.2.20.3. SWOT Analysis
- 11.2.20.4. Recent Developments
- 11.2.20.5. Financials (Based on Availability)
- 11.2.21 Petronas Lubricants International
- 11.2.21.1. Overview
- 11.2.21.2. Products
- 11.2.21.3. SWOT Analysis
- 11.2.21.4. Recent Developments
- 11.2.21.5. Financials (Based on Availability)
- 11.2.22 Phillips 66 Lubricants
- 11.2.22.1. Overview
- 11.2.22.2. Products
- 11.2.22.3. SWOT Analysis
- 11.2.22.4. Recent Developments
- 11.2.22.5. Financials (Based on Availability)
- 11.2.23 PT Pertamina
- 11.2.23.1. Overview
- 11.2.23.2. Products
- 11.2.23.3. SWOT Analysis
- 11.2.23.4. Recent Developments
- 11.2.23.5. Financials (Based on Availability)
- 11.2.24 PTT Lubricants
- 11.2.24.1. Overview
- 11.2.24.2. Products
- 11.2.24.3. SWOT Analysis
- 11.2.24.4. Recent Developments
- 11.2.24.5. Financials (Based on Availability)
- 11.2.25 Rosneft
- 11.2.25.1. Overview
- 11.2.25.2. Products
- 11.2.25.3. SWOT Analysis
- 11.2.25.4. Recent Developments
- 11.2.25.5. Financials (Based on Availability)
- 11.2.26 Royal Dutch Shell PLC
- 11.2.26.1. Overview
- 11.2.26.2. Products
- 11.2.26.3. SWOT Analysis
- 11.2.26.4. Recent Developments
- 11.2.26.5. Financials (Based on Availability)
- 11.2.27 Terpel
- 11.2.27.1. Overview
- 11.2.27.2. Products
- 11.2.27.3. SWOT Analysis
- 11.2.27.4. Recent Developments
- 11.2.27.5. Financials (Based on Availability)
- 11.2.28 TotalEnergies
- 11.2.28.1. Overview
- 11.2.28.2. Products
- 11.2.28.3. SWOT Analysis
- 11.2.28.4. Recent Developments
- 11.2.28.5. Financials (Based on Availability)
- 11.2.29 Valvoline Inc
- 11.2.29.1. Overview
- 11.2.29.2. Products
- 11.2.29.3. SWOT Analysis
- 11.2.29.4. Recent Developments
- 11.2.29.5. Financials (Based on Availability)
- 11.2.30 YP
- 11.2.30.1. Overview
- 11.2.30.2. Products
- 11.2.30.3. SWOT Analysis
- 11.2.30.4. Recent Developments
- 11.2.30.5. Financials (Based on Availability)
- 11.2.1 Behran Oil Company
List of Figures
- Figure 1: Global Lubricants Industry Revenue Breakdown (Million, %) by Region 2025 & 2033
- Figure 2: North America Lubricants Industry Revenue (Million), by End User 2025 & 2033
- Figure 3: North America Lubricants Industry Revenue Share (%), by End User 2025 & 2033
- Figure 4: North America Lubricants Industry Revenue (Million), by Product Type 2025 & 2033
- Figure 5: North America Lubricants Industry Revenue Share (%), by Product Type 2025 & 2033
- Figure 6: North America Lubricants Industry Revenue (Million), by Country 2025 & 2033
- Figure 7: North America Lubricants Industry Revenue Share (%), by Country 2025 & 2033
- Figure 8: South America Lubricants Industry Revenue (Million), by End User 2025 & 2033
- Figure 9: South America Lubricants Industry Revenue Share (%), by End User 2025 & 2033
- Figure 10: South America Lubricants Industry Revenue (Million), by Product Type 2025 & 2033
- Figure 11: South America Lubricants Industry Revenue Share (%), by Product Type 2025 & 2033
- Figure 12: South America Lubricants Industry Revenue (Million), by Country 2025 & 2033
- Figure 13: South America Lubricants Industry Revenue Share (%), by Country 2025 & 2033
- Figure 14: Europe Lubricants Industry Revenue (Million), by End User 2025 & 2033
- Figure 15: Europe Lubricants Industry Revenue Share (%), by End User 2025 & 2033
- Figure 16: Europe Lubricants Industry Revenue (Million), by Product Type 2025 & 2033
- Figure 17: Europe Lubricants Industry Revenue Share (%), by Product Type 2025 & 2033
- Figure 18: Europe Lubricants Industry Revenue (Million), by Country 2025 & 2033
- Figure 19: Europe Lubricants Industry Revenue Share (%), by Country 2025 & 2033
- Figure 20: Middle East & Africa Lubricants Industry Revenue (Million), by End User 2025 & 2033
- Figure 21: Middle East & Africa Lubricants Industry Revenue Share (%), by End User 2025 & 2033
- Figure 22: Middle East & Africa Lubricants Industry Revenue (Million), by Product Type 2025 & 2033
- Figure 23: Middle East & Africa Lubricants Industry Revenue Share (%), by Product Type 2025 & 2033
- Figure 24: Middle East & Africa Lubricants Industry Revenue (Million), by Country 2025 & 2033
- Figure 25: Middle East & Africa Lubricants Industry Revenue Share (%), by Country 2025 & 2033
- Figure 26: Asia Pacific Lubricants Industry Revenue (Million), by End User 2025 & 2033
- Figure 27: Asia Pacific Lubricants Industry Revenue Share (%), by End User 2025 & 2033
- Figure 28: Asia Pacific Lubricants Industry Revenue (Million), by Product Type 2025 & 2033
- Figure 29: Asia Pacific Lubricants Industry Revenue Share (%), by Product Type 2025 & 2033
- Figure 30: Asia Pacific Lubricants Industry Revenue (Million), by Country 2025 & 2033
- Figure 31: Asia Pacific Lubricants Industry Revenue Share (%), by Country 2025 & 2033
List of Tables
- Table 1: Global Lubricants Industry Revenue Million Forecast, by Region 2020 & 2033
- Table 2: Global Lubricants Industry Revenue Million Forecast, by End User 2020 & 2033
- Table 3: Global Lubricants Industry Revenue Million Forecast, by Product Type 2020 & 2033
- Table 4: Global Lubricants Industry Revenue Million Forecast, by Region 2020 & 2033
- Table 5: Global Lubricants Industry Revenue Million Forecast, by End User 2020 & 2033
- Table 6: Global Lubricants Industry Revenue Million Forecast, by Product Type 2020 & 2033
- Table 7: Global Lubricants Industry Revenue Million Forecast, by Country 2020 & 2033
- Table 8: United States Lubricants Industry Revenue (Million) Forecast, by Application 2020 & 2033
- Table 9: Canada Lubricants Industry Revenue (Million) Forecast, by Application 2020 & 2033
- Table 10: Mexico Lubricants Industry Revenue (Million) Forecast, by Application 2020 & 2033
- Table 11: Global Lubricants Industry Revenue Million Forecast, by End User 2020 & 2033
- Table 12: Global Lubricants Industry Revenue Million Forecast, by Product Type 2020 & 2033
- Table 13: Global Lubricants Industry Revenue Million Forecast, by Country 2020 & 2033
- Table 14: Brazil Lubricants Industry Revenue (Million) Forecast, by Application 2020 & 2033
- Table 15: Argentina Lubricants Industry Revenue (Million) Forecast, by Application 2020 & 2033
- Table 16: Rest of South America Lubricants Industry Revenue (Million) Forecast, by Application 2020 & 2033
- Table 17: Global Lubricants Industry Revenue Million Forecast, by End User 2020 & 2033
- Table 18: Global Lubricants Industry Revenue Million Forecast, by Product Type 2020 & 2033
- Table 19: Global Lubricants Industry Revenue Million Forecast, by Country 2020 & 2033
- Table 20: United Kingdom Lubricants Industry Revenue (Million) Forecast, by Application 2020 & 2033
- Table 21: Germany Lubricants Industry Revenue (Million) Forecast, by Application 2020 & 2033
- Table 22: France Lubricants Industry Revenue (Million) Forecast, by Application 2020 & 2033
- Table 23: Italy Lubricants Industry Revenue (Million) Forecast, by Application 2020 & 2033
- Table 24: Spain Lubricants Industry Revenue (Million) Forecast, by Application 2020 & 2033
- Table 25: Russia Lubricants Industry Revenue (Million) Forecast, by Application 2020 & 2033
- Table 26: Benelux Lubricants Industry Revenue (Million) Forecast, by Application 2020 & 2033
- Table 27: Nordics Lubricants Industry Revenue (Million) Forecast, by Application 2020 & 2033
- Table 28: Rest of Europe Lubricants Industry Revenue (Million) Forecast, by Application 2020 & 2033
- Table 29: Global Lubricants Industry Revenue Million Forecast, by End User 2020 & 2033
- Table 30: Global Lubricants Industry Revenue Million Forecast, by Product Type 2020 & 2033
- Table 31: Global Lubricants Industry Revenue Million Forecast, by Country 2020 & 2033
- Table 32: Turkey Lubricants Industry Revenue (Million) Forecast, by Application 2020 & 2033
- Table 33: Israel Lubricants Industry Revenue (Million) Forecast, by Application 2020 & 2033
- Table 34: GCC Lubricants Industry Revenue (Million) Forecast, by Application 2020 & 2033
- Table 35: North Africa Lubricants Industry Revenue (Million) Forecast, by Application 2020 & 2033
- Table 36: South Africa Lubricants Industry Revenue (Million) Forecast, by Application 2020 & 2033
- Table 37: Rest of Middle East & Africa Lubricants Industry Revenue (Million) Forecast, by Application 2020 & 2033
- Table 38: Global Lubricants Industry Revenue Million Forecast, by End User 2020 & 2033
- Table 39: Global Lubricants Industry Revenue Million Forecast, by Product Type 2020 & 2033
- Table 40: Global Lubricants Industry Revenue Million Forecast, by Country 2020 & 2033
- Table 41: China Lubricants Industry Revenue (Million) Forecast, by Application 2020 & 2033
- Table 42: India Lubricants Industry Revenue (Million) Forecast, by Application 2020 & 2033
- Table 43: Japan Lubricants Industry Revenue (Million) Forecast, by Application 2020 & 2033
- Table 44: South Korea Lubricants Industry Revenue (Million) Forecast, by Application 2020 & 2033
- Table 45: ASEAN Lubricants Industry Revenue (Million) Forecast, by Application 2020 & 2033
- Table 46: Oceania Lubricants Industry Revenue (Million) Forecast, by Application 2020 & 2033
- Table 47: Rest of Asia Pacific Lubricants Industry Revenue (Million) Forecast, by Application 2020 & 2033
Frequently Asked Questions
1. What is the projected Compound Annual Growth Rate (CAGR) of the Lubricants Industry?
The projected CAGR is approximately N/A%.
2. Which companies are prominent players in the Lubricants Industry?
Key companies in the market include Behran Oil Company, BP PLC (Castrol), Carl Bechem GmbH, Chevron Corporation, China National Petroleum Corporation, China Petroleum & Chemical Corporation, Coperative Soceite des petroleum, ENEOS Corporation, Eni SpA, ExxonMobil Corporation, FUCHS, Gazprom, GS Caltex, Gulf Oil International, Hindustan Petroleum Corporation Limited, Idemitsu Kosan Co Ltd, Indian Oil Corporation Limited, Lukoil, Motul, Petromin Corporation, Petronas Lubricants International, Phillips 66 Lubricants, PT Pertamina, PTT Lubricants, Rosneft, Royal Dutch Shell PLC, Terpel, TotalEnergies, Valvoline Inc, YP.
3. What are the main segments of the Lubricants Industry?
The market segments include End User, Product Type.
4. Can you provide details about the market size?
The market size is estimated to be USD XX Million as of 2022.
5. What are some drivers contributing to market growth?
N/A
6. What are the notable trends driving market growth?
Largest Segment By End User : Automotive.
7. Are there any restraints impacting market growth?
N/A
8. Can you provide examples of recent developments in the market?
May 2022: TotalEnergies, NEXUS Automotive Extend Strategic Partnership for a period of five years. As part of this partnership, TotalEnergies Lubricants will be expanding its presence in the burgeoning N! community, which has seen rapid growth in sales from EUR 7.2 billion in 2015 to nearly EUR 35 billion by the end of 2021.April 2022: FUCHS company introduced AGRI FARM lubricants which are especially suited for high-end agricultural machines.April 2022: FUCHS Lubricants South Africa has introduced new food-grade Renolin SJL Heavy and Renolin SJL Winter lubricants for the sugar processing industry.The new lubricant offers benefits such as equipment longevity and food safety.
9. What pricing options are available for accessing the report?
Pricing options include single-user, multi-user, and enterprise licenses priced at USD 3800, USD 4500, and USD 5800 respectively.
10. Is the market size provided in terms of value or volume?
The market size is provided in terms of value, measured in Million.
11. Are there any specific market keywords associated with the report?
Yes, the market keyword associated with the report is "Lubricants Industry," which aids in identifying and referencing the specific market segment covered.
12. How do I determine which pricing option suits my needs best?
The pricing options vary based on user requirements and access needs. Individual users may opt for single-user licenses, while businesses requiring broader access may choose multi-user or enterprise licenses for cost-effective access to the report.
13. Are there any additional resources or data provided in the Lubricants Industry report?
While the report offers comprehensive insights, it's advisable to review the specific contents or supplementary materials provided to ascertain if additional resources or data are available.
14. How can I stay updated on further developments or reports in the Lubricants Industry?
To stay informed about further developments, trends, and reports in the Lubricants Industry, consider subscribing to industry newsletters, following relevant companies and organizations, or regularly checking reputable industry news sources and publications.
Methodology
Step 1 - Identification of Relevant Samples Size from Population Database


Step 2 - Approaches for Defining Global Market Size (Value, Volume* & Price*)

Note*: In applicable scenarios
Step 3 - Data Sources
Primary Research
- Web Analytics
- Survey Reports
- Research Institute
- Latest Research Reports
- Opinion Leaders
Secondary Research
- Annual Reports
- White Paper
- Latest Press Release
- Industry Association
- Paid Database
- Investor Presentations

Step 4 - Data Triangulation
Involves using different sources of information in order to increase the validity of a study
These sources are likely to be stakeholders in a program - participants, other researchers, program staff, other community members, and so on.
Then we put all data in single framework & apply various statistical tools to find out the dynamic on the market.
During the analysis stage, feedback from the stakeholder groups would be compared to determine areas of agreement as well as areas of divergence
