

Key Insights
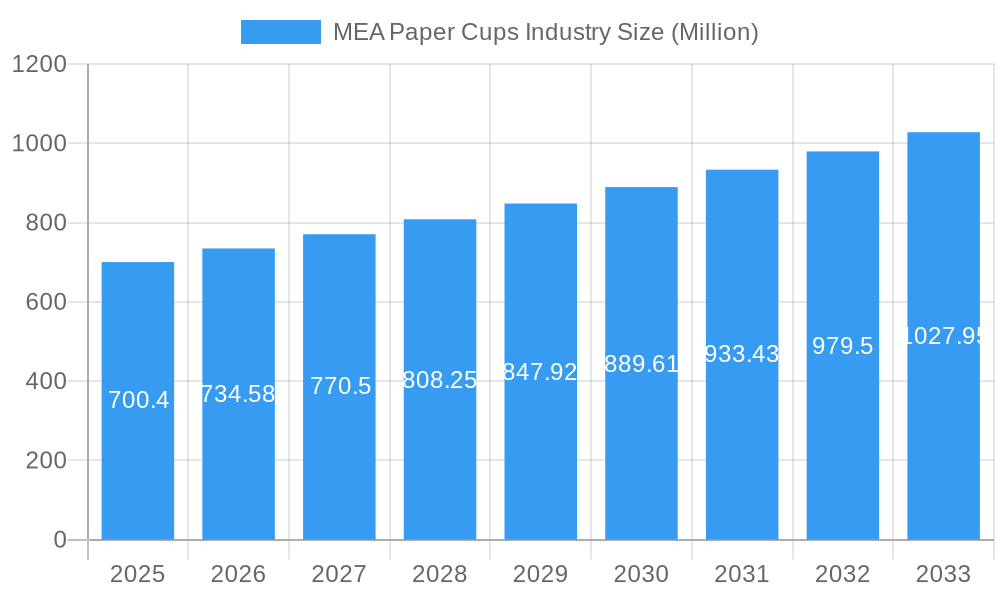
The Middle East and Africa (MEA) paper cups market, valued at $700.40 million in 2025, is projected to experience robust growth, driven by a compound annual growth rate (CAGR) of 4.81% from 2025 to 2033. This expansion is fueled by several key factors. The burgeoning quick-service restaurant (QSR) sector across the MEA region, characterized by increasing urbanization and changing consumer lifestyles, significantly contributes to heightened demand for disposable paper cups. Furthermore, the rising popularity of takeaway and delivery services further accelerates consumption. Increased disposable incomes and a growing preference for convenience are also boosting market growth. The segment is further diversified by cup type (hot and cold paper cups) and application (QSR, institutional settings, and other applications), with QSR currently dominating the market share. Countries like the United Arab Emirates, Saudi Arabia, and South Africa represent key growth markets within the region, driven by factors like substantial populations and a robust tourism sector. While environmental concerns surrounding disposable products present a potential restraint, the industry is likely to see innovation in sustainable and biodegradable alternatives mitigating this factor's impact in the coming years.
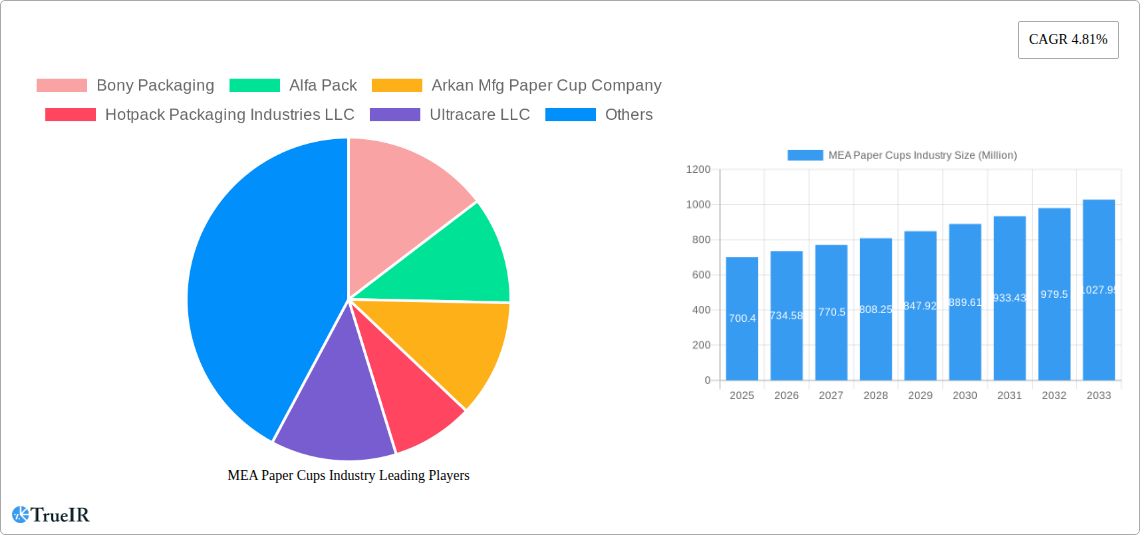
MEA Paper Cups Industry Market Size (In Million)
However, several challenges exist. Fluctuations in raw material prices, particularly pulp and paper, can impact production costs and profitability. Intense competition among established players and new entrants necessitates continuous product innovation and strategic pricing to maintain market share. Furthermore, regulatory changes related to packaging waste management and sustainability could influence operational strategies and necessitate investments in eco-friendly solutions. Despite these challenges, the MEA paper cups market is poised for continued growth, driven by the region's demographic trends, economic expansion, and the evolving consumer preferences for convenience and single-use packaging. Strategic partnerships and investments in advanced manufacturing technologies will play a pivotal role in shaping the future of this dynamic market.
MEA Paper Cups Industry Company Market Share
MEA Paper Cups Industry: Market Report 2019-2033
This comprehensive report provides a detailed analysis of the Middle East and Africa (MEA) paper cups industry, offering invaluable insights for businesses, investors, and stakeholders. Covering the period 2019-2033, with a focus on 2025, this report examines market size, growth drivers, competitive landscape, and future outlook. We delve into key segments, including cup type (hot and cold), application (quick service restaurants, institutional, and others), and geographic regions (UAE, Saudi Arabia, South Africa, Nigeria, and the rest of MEA). The report features detailed analysis of leading players, including Bony Packaging, Alfa Pack, Arkan Mfg Paper Cup Company, Hotpack Packaging Industries LLC, Ultracare LLC, Golden Paper Cups Manufacturing LLC, Falcon Pack, Detpak South Africa (Pty) Ltd, Huhtamaki Group, Pack-Zone, MAIMOON Papers Industry LLC, Saqr Pack, Enpi Group, Gulf East Paper & Plastic Group, Graphic Packaging International, and Saham Group, among others. The report forecasts robust growth, driven by factors like increasing disposable income, rapid urbanization, and the burgeoning food service industry.
MEA Paper Cups Industry Market Structure & Competitive Landscape
The MEA paper cups market exhibits a moderately concentrated structure, with a few large players and numerous smaller regional manufacturers. The industry's Herfindahl-Hirschman Index (HHI) is estimated at xx in 2025, indicating a moderately competitive environment. Key innovation drivers include the development of eco-friendly and sustainable paper cups, along with advancements in printing and design capabilities to enhance branding opportunities. Regulatory impacts, such as those related to food safety and environmental sustainability, significantly influence industry practices. Major product substitutes include plastic cups and reusable alternatives, posing a challenge to market growth. The end-user segmentation is dominated by the quick-service restaurant (QSR) sector, followed by institutional applications (schools, offices, hospitals) and other applications (catering, events). M&A activity has been relatively low in recent years with an estimated xx Million USD in deals during the historical period, driven mainly by strategic expansion and portfolio diversification.
- Market Concentration: Moderate, with a few dominant players.
- Innovation Drivers: Sustainable materials, advanced printing techniques.
- Regulatory Impacts: Food safety and environmental standards.
- Product Substitutes: Plastic cups, reusable alternatives.
- End-User Segmentation: QSR > Institutional > Other Applications
- M&A Activity: Relatively low, xx Million USD during 2019-2024.
MEA Paper Cups Industry Market Trends & Opportunities
The MEA paper cups market is projected to experience significant growth, with a Compound Annual Growth Rate (CAGR) of xx% during the forecast period (2025-2033). The market size in 2025 is estimated at xx Million USD, anticipated to reach xx Million USD by 2033. This growth is fueled by several factors, including rising disposable incomes, increasing urbanization leading to higher demand from the QSR sector and expanding institutional settings, and a shift in consumer preferences towards convenience and single-use packaging. Technological shifts, such as the adoption of biodegradable and compostable materials, are creating new opportunities for manufacturers. The market penetration rate for paper cups within the QSR segment is currently estimated at xx%, with significant room for expansion, particularly in less developed regions. Intense competition and fluctuating raw material prices present challenges, necessitating strategic pricing and efficient supply chain management. The emergence of innovative packaging solutions and environmentally conscious consumers will further shape the industry's trajectory.
Dominant Markets & Segments in MEA Paper Cups Industry
The UAE and Saudi Arabia represent the dominant markets within the MEA region, driven by robust economic growth, a large population, and a thriving QSR industry. South Africa also showcases significant growth potential.
Leading Region/Country: UAE and Saudi Arabia
Leading Segment (By Cup Type): Hot paper cups maintain a larger market share compared to cold paper cups due to higher demand from the beverage industry.
Leading Segment (By Application): The QSR segment is the most dominant, followed by institutional applications.
Growth Drivers:
- UAE & Saudi Arabia: Strong economic growth, high population density, large QSR sector.
- South Africa: Expanding middle class, growth in food service industry.
- Nigeria and Rest of MEA: Increasing urbanization, rising disposable incomes (albeit at a slower pace than the top three)
- Quick Service Restaurants: High volume consumption, reliance on disposable packaging.
- Institutional: Growth in schools, hospitals, offices, and other institutions.
MEA Paper Cups Industry Product Analysis
The MEA paper cups market offers a wide variety of products, ranging from standard hot and cold paper cups to those with specialized features such as double-walled insulation, lids, and customized printing. Innovation is primarily focused on enhancing sustainability through the use of biodegradable and recyclable materials. Manufacturers are also focusing on improving printing capabilities to provide high-quality branding solutions for customers. Competitive advantage hinges on product quality, cost-effectiveness, efficient supply chain management, and sustainable practices.
Key Drivers, Barriers & Challenges in MEA Paper Cups Industry
Key Drivers:
The MEA paper cups market is propelled by several factors, including the expanding QSR sector and increased consumer preference for convenience. Rising disposable incomes, especially in urban areas, further fuel demand. Government initiatives promoting food safety and hygiene also support growth.
Challenges:
Fluctuating raw material prices (especially pulp) significantly impact profitability. Competition from plastic cup manufacturers and the emergence of reusable alternatives pose a threat. Stringent environmental regulations necessitate investments in sustainable practices. Supply chain disruptions, particularly during global events like the COVID-19 pandemic, can cause production delays and increased costs. These disruptions can lead to approximately xx% decrease in overall production capacity during peak times.
Growth Drivers in the MEA Paper Cups Industry Market
The major drivers include urbanization, increasing disposable income, and the booming food service sector across MEA. Government regulations promoting food safety and hygiene are also creating positive momentum. Technological advancements in sustainable materials and manufacturing processes add to the growth trajectory.
Challenges Impacting MEA Paper Cups Industry Growth
The challenges include volatile raw material costs, intense competition from substitutes (plastic cups and reusables), and environmental regulations. Supply chain disruptions and fluctuations in oil prices ( impacting transportation) also impact growth.
Key Players Shaping the MEA Paper Cups Industry Market
- Bony Packaging
- Alfa Pack
- Arkan Mfg Paper Cup Company
- Hotpack Packaging Industries LLC
- Ultracare LLC
- Golden Paper Cups Manufacturing LLC
- Falcon Pack
- Detpak South Africa (Pty) Ltd
- Huhtamaki Group
- Pack-Zone
- MAIMOON Papers Industry LLC
- Saqr Pack
- Enpi Group
- Gulf East Paper & Plastic Group
- Graphic Packaging International
- Saham Group
Significant MEA Paper Cups Industry Industry Milestones
November 2022: HotpackGlobal launched a new manufacturing plant in Qatar, expanding its global footprint and production capacity. This signifies a commitment to market expansion and enhanced production capabilities for the MEA region.
September 2022: Huhtamaki and StoraEnso launched the Cup Collective program, focusing on industrial-scale paper cup recycling, highlighting growing sustainability concerns and opportunities within the industry. This initiative promotes the circular economy and could potentially impact the raw material supply chain in the future.
Future Outlook for MEA Paper Cups Industry Market
The MEA paper cups market is poised for continued growth, driven by sustained economic development, rising urbanization, and the expanding food service sector. Opportunities exist in developing sustainable and innovative products, leveraging advancements in biodegradable materials and efficient manufacturing processes. Strategic collaborations and investments in research and development will be crucial for businesses to maintain a competitive edge in this dynamic market.
MEA Paper Cups Industry Segmentation
-
1. Cup Type
- 1.1. Hot Paper Cup
- 1.2. Cold Paper Cup
-
2. Application
- 2.1. Quick Service Restaurants
- 2.2. Institutional
- 2.3. Other Applications
MEA Paper Cups Industry Segmentation By Geography
-
1. North America
- 1.1. United States
- 1.2. Canada
- 1.3. Mexico
-
2. South America
- 2.1. Brazil
- 2.2. Argentina
- 2.3. Rest of South America
-
3. Europe
- 3.1. United Kingdom
- 3.2. Germany
- 3.3. France
- 3.4. Italy
- 3.5. Spain
- 3.6. Russia
- 3.7. Benelux
- 3.8. Nordics
- 3.9. Rest of Europe
-
4. Middle East & Africa
- 4.1. Turkey
- 4.2. Israel
- 4.3. GCC
- 4.4. North Africa
- 4.5. South Africa
- 4.6. Rest of Middle East & Africa
-
5. Asia Pacific
- 5.1. China
- 5.2. India
- 5.3. Japan
- 5.4. South Korea
- 5.5. ASEAN
- 5.6. Oceania
- 5.7. Rest of Asia Pacific
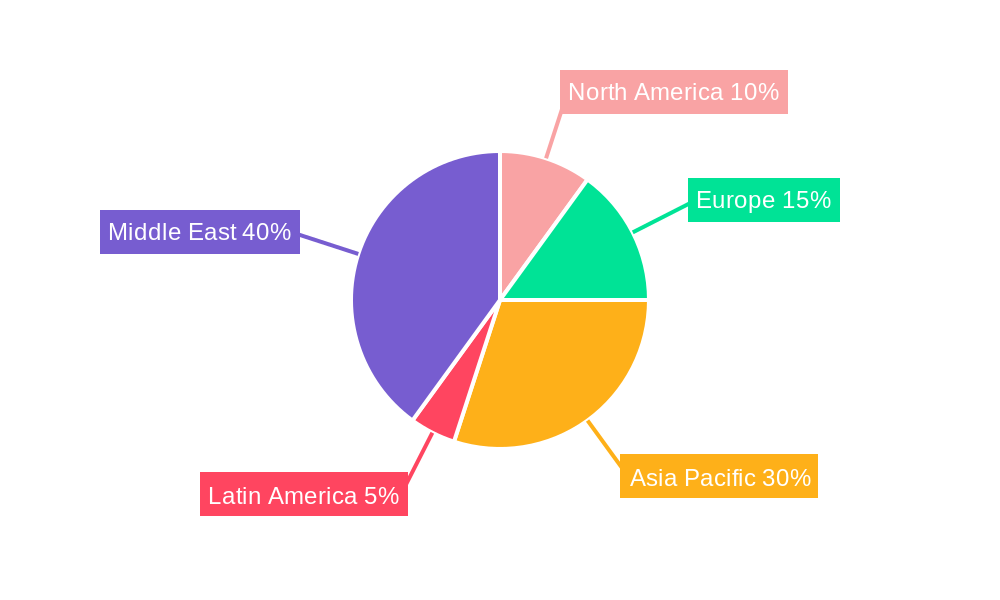
MEA Paper Cups Industry Regional Market Share
Geographic Coverage of MEA Paper Cups Industry
MEA Paper Cups Industry REPORT HIGHLIGHTS
| Aspects | Details |
|---|---|
| Study Period | 2020-2034 |
| Base Year | 2025 |
| Estimated Year | 2026 |
| Forecast Period | 2026-2034 |
| Historical Period | 2020-2025 |
| Growth Rate | CAGR of 4.81% from 2020-2034 |
| Segmentation |
|
Table of Contents
- 1. Introduction
- 1.1. Research Scope
- 1.2. Market Segmentation
- 1.3. Research Objective
- 1.4. Definitions and Assumptions
- 2. Executive Summary
- 2.1. Market Snapshot
- 3. Market Dynamics
- 3.1. Market Drivers
- 3.2. Market Restrains
- 3.3. Market Trends
- 3.4. Market Opportunities
- 4. Market Factor Analysis
- 4.1. Porters Five Forces
- 4.1.1. Bargaining Power of Suppliers
- 4.1.2. Bargaining Power of Buyers
- 4.1.3. Threat of New Entrants
- 4.1.4. Threat of Substitutes
- 4.1.5. Competitive Rivalry
- 4.2. PESTEL analysis
- 4.3. BCG Analysis
- 4.3.1. Stars (High Growth, High Market Share)
- 4.3.2. Cash Cows (Low Growth, High Market Share)
- 4.3.3. Question Mark (High Growth, Low Market Share)
- 4.3.4. Dogs (Low Growth, Low Market Share)
- 4.4. Ansoff Matrix Analysis
- 4.5. Supply Chain Analysis
- 4.6. Regulatory Landscape
- 4.7. Current Market Potential and Opportunity Assessment (TAM–SAM–SOM Framework)
- 4.8. TIR Analyst Note
- 4.1. Porters Five Forces
- 5. Market Analysis, Insights and Forecast 2021-2033
- 5.1. Market Analysis, Insights and Forecast - by Cup Type
- 5.1.1. Hot Paper Cup
- 5.1.2. Cold Paper Cup
- 5.2. Market Analysis, Insights and Forecast - by Application
- 5.2.1. Quick Service Restaurants
- 5.2.2. Institutional
- 5.2.3. Other Applications
- 5.3. Market Analysis, Insights and Forecast - by Region
- 5.3.1. North America
- 5.3.2. South America
- 5.3.3. Europe
- 5.3.4. Middle East & Africa
- 5.3.5. Asia Pacific
- 5.1. Market Analysis, Insights and Forecast - by Cup Type
- 6. Global MEA Paper Cups Industry Analysis, Insights and Forecast, 2021-2033
- 6.1. Market Analysis, Insights and Forecast - by Cup Type
- 6.1.1. Hot Paper Cup
- 6.1.2. Cold Paper Cup
- 6.2. Market Analysis, Insights and Forecast - by Application
- 6.2.1. Quick Service Restaurants
- 6.2.2. Institutional
- 6.2.3. Other Applications
- 6.1. Market Analysis, Insights and Forecast - by Cup Type
- 7. North America MEA Paper Cups Industry Analysis, Insights and Forecast, 2020-2032
- 7.1. Market Analysis, Insights and Forecast - by Cup Type
- 7.1.1. Hot Paper Cup
- 7.1.2. Cold Paper Cup
- 7.2. Market Analysis, Insights and Forecast - by Application
- 7.2.1. Quick Service Restaurants
- 7.2.2. Institutional
- 7.2.3. Other Applications
- 7.1. Market Analysis, Insights and Forecast - by Cup Type
- 8. South America MEA Paper Cups Industry Analysis, Insights and Forecast, 2020-2032
- 8.1. Market Analysis, Insights and Forecast - by Cup Type
- 8.1.1. Hot Paper Cup
- 8.1.2. Cold Paper Cup
- 8.2. Market Analysis, Insights and Forecast - by Application
- 8.2.1. Quick Service Restaurants
- 8.2.2. Institutional
- 8.2.3. Other Applications
- 8.1. Market Analysis, Insights and Forecast - by Cup Type
- 9. Europe MEA Paper Cups Industry Analysis, Insights and Forecast, 2020-2032
- 9.1. Market Analysis, Insights and Forecast - by Cup Type
- 9.1.1. Hot Paper Cup
- 9.1.2. Cold Paper Cup
- 9.2. Market Analysis, Insights and Forecast - by Application
- 9.2.1. Quick Service Restaurants
- 9.2.2. Institutional
- 9.2.3. Other Applications
- 9.1. Market Analysis, Insights and Forecast - by Cup Type
- 10. Middle East & Africa MEA Paper Cups Industry Analysis, Insights and Forecast, 2020-2032
- 10.1. Market Analysis, Insights and Forecast - by Cup Type
- 10.1.1. Hot Paper Cup
- 10.1.2. Cold Paper Cup
- 10.2. Market Analysis, Insights and Forecast - by Application
- 10.2.1. Quick Service Restaurants
- 10.2.2. Institutional
- 10.2.3. Other Applications
- 10.1. Market Analysis, Insights and Forecast - by Cup Type
- 11. Asia Pacific MEA Paper Cups Industry Analysis, Insights and Forecast, 2020-2032
- 11.1. Market Analysis, Insights and Forecast - by Cup Type
- 11.1.1. Hot Paper Cup
- 11.1.2. Cold Paper Cup
- 11.2. Market Analysis, Insights and Forecast - by Application
- 11.2.1. Quick Service Restaurants
- 11.2.2. Institutional
- 11.2.3. Other Applications
- 11.1. Market Analysis, Insights and Forecast - by Cup Type
- 12. Competitive Analysis
- 12.1. Company Profiles
- 12.1.1 Bony Packaging
- 12.1.1.1. Company Overview
- 12.1.1.2. Products
- 12.1.1.3. Company Financials
- 12.1.1.4. SWOT Analysis
- 12.1.2 Alfa Pack
- 12.1.2.1. Company Overview
- 12.1.2.2. Products
- 12.1.2.3. Company Financials
- 12.1.2.4. SWOT Analysis
- 12.1.3 Arkan Mfg Paper Cup Company
- 12.1.3.1. Company Overview
- 12.1.3.2. Products
- 12.1.3.3. Company Financials
- 12.1.3.4. SWOT Analysis
- 12.1.4 Hotpack Packaging Industries LLC
- 12.1.4.1. Company Overview
- 12.1.4.2. Products
- 12.1.4.3. Company Financials
- 12.1.4.4. SWOT Analysis
- 12.1.5 Ultracare LLC
- 12.1.5.1. Company Overview
- 12.1.5.2. Products
- 12.1.5.3. Company Financials
- 12.1.5.4. SWOT Analysis
- 12.1.6 Golden Paper Cups Manufacturing LLC
- 12.1.6.1. Company Overview
- 12.1.6.2. Products
- 12.1.6.3. Company Financials
- 12.1.6.4. SWOT Analysis
- 12.1.7 Falcon Pack*List Not Exhaustive
- 12.1.7.1. Company Overview
- 12.1.7.2. Products
- 12.1.7.3. Company Financials
- 12.1.7.4. SWOT Analysis
- 12.1.8 Detpak South Africa (Pty) Ltd
- 12.1.8.1. Company Overview
- 12.1.8.2. Products
- 12.1.8.3. Company Financials
- 12.1.8.4. SWOT Analysis
- 12.1.9 Huhtamaki Group
- 12.1.9.1. Company Overview
- 12.1.9.2. Products
- 12.1.9.3. Company Financials
- 12.1.9.4. SWOT Analysis
- 12.1.10 Pack- Zone
- 12.1.10.1. Company Overview
- 12.1.10.2. Products
- 12.1.10.3. Company Financials
- 12.1.10.4. SWOT Analysis
- 12.1.11 MAIMOON Papers Industry LLC
- 12.1.11.1. Company Overview
- 12.1.11.2. Products
- 12.1.11.3. Company Financials
- 12.1.11.4. SWOT Analysis
- 12.1.12 Saqr Pack
- 12.1.12.1. Company Overview
- 12.1.12.2. Products
- 12.1.12.3. Company Financials
- 12.1.12.4. SWOT Analysis
- 12.1.13 Enpi Group
- 12.1.13.1. Company Overview
- 12.1.13.2. Products
- 12.1.13.3. Company Financials
- 12.1.13.4. SWOT Analysis
- 12.1.14 Gulf East Paper & Plastic Group
- 12.1.14.1. Company Overview
- 12.1.14.2. Products
- 12.1.14.3. Company Financials
- 12.1.14.4. SWOT Analysis
- 12.1.15 Graphic Packaging International
- 12.1.15.1. Company Overview
- 12.1.15.2. Products
- 12.1.15.3. Company Financials
- 12.1.15.4. SWOT Analysis
- 12.1.16 Saham Group
- 12.1.16.1. Company Overview
- 12.1.16.2. Products
- 12.1.16.3. Company Financials
- 12.1.16.4. SWOT Analysis
- 12.1.1 Bony Packaging
- 12.2. Market Entropy
- 12.2.1 Company's Key Areas Served
- 12.2.2 Recent Developments
- 12.3. Company Market Share Analysis 2025
- 12.3.1 Top 5 Companies Market Share Analysis
- 12.3.2 Top 3 Companies Market Share Analysis
- 12.4. List of Potential Customers
- 13. Research Methodology
List of Figures
- Figure 1: Global MEA Paper Cups Industry Revenue Breakdown (Million, %) by Region 2025 & 2033
- Figure 2: North America MEA Paper Cups Industry Revenue (Million), by Cup Type 2025 & 2033
- Figure 3: North America MEA Paper Cups Industry Revenue Share (%), by Cup Type 2025 & 2033
- Figure 4: North America MEA Paper Cups Industry Revenue (Million), by Application 2025 & 2033
- Figure 5: North America MEA Paper Cups Industry Revenue Share (%), by Application 2025 & 2033
- Figure 6: North America MEA Paper Cups Industry Revenue (Million), by Country 2025 & 2033
- Figure 7: North America MEA Paper Cups Industry Revenue Share (%), by Country 2025 & 2033
- Figure 8: South America MEA Paper Cups Industry Revenue (Million), by Cup Type 2025 & 2033
- Figure 9: South America MEA Paper Cups Industry Revenue Share (%), by Cup Type 2025 & 2033
- Figure 10: South America MEA Paper Cups Industry Revenue (Million), by Application 2025 & 2033
- Figure 11: South America MEA Paper Cups Industry Revenue Share (%), by Application 2025 & 2033
- Figure 12: South America MEA Paper Cups Industry Revenue (Million), by Country 2025 & 2033
- Figure 13: South America MEA Paper Cups Industry Revenue Share (%), by Country 2025 & 2033
- Figure 14: Europe MEA Paper Cups Industry Revenue (Million), by Cup Type 2025 & 2033
- Figure 15: Europe MEA Paper Cups Industry Revenue Share (%), by Cup Type 2025 & 2033
- Figure 16: Europe MEA Paper Cups Industry Revenue (Million), by Application 2025 & 2033
- Figure 17: Europe MEA Paper Cups Industry Revenue Share (%), by Application 2025 & 2033
- Figure 18: Europe MEA Paper Cups Industry Revenue (Million), by Country 2025 & 2033
- Figure 19: Europe MEA Paper Cups Industry Revenue Share (%), by Country 2025 & 2033
- Figure 20: Middle East & Africa MEA Paper Cups Industry Revenue (Million), by Cup Type 2025 & 2033
- Figure 21: Middle East & Africa MEA Paper Cups Industry Revenue Share (%), by Cup Type 2025 & 2033
- Figure 22: Middle East & Africa MEA Paper Cups Industry Revenue (Million), by Application 2025 & 2033
- Figure 23: Middle East & Africa MEA Paper Cups Industry Revenue Share (%), by Application 2025 & 2033
- Figure 24: Middle East & Africa MEA Paper Cups Industry Revenue (Million), by Country 2025 & 2033
- Figure 25: Middle East & Africa MEA Paper Cups Industry Revenue Share (%), by Country 2025 & 2033
- Figure 26: Asia Pacific MEA Paper Cups Industry Revenue (Million), by Cup Type 2025 & 2033
- Figure 27: Asia Pacific MEA Paper Cups Industry Revenue Share (%), by Cup Type 2025 & 2033
- Figure 28: Asia Pacific MEA Paper Cups Industry Revenue (Million), by Application 2025 & 2033
- Figure 29: Asia Pacific MEA Paper Cups Industry Revenue Share (%), by Application 2025 & 2033
- Figure 30: Asia Pacific MEA Paper Cups Industry Revenue (Million), by Country 2025 & 2033
- Figure 31: Asia Pacific MEA Paper Cups Industry Revenue Share (%), by Country 2025 & 2033
List of Tables
- Table 1: Global MEA Paper Cups Industry Revenue Million Forecast, by Cup Type 2020 & 2033
- Table 2: Global MEA Paper Cups Industry Revenue Million Forecast, by Application 2020 & 2033
- Table 3: Global MEA Paper Cups Industry Revenue Million Forecast, by Region 2020 & 2033
- Table 4: Global MEA Paper Cups Industry Revenue Million Forecast, by Cup Type 2020 & 2033
- Table 5: Global MEA Paper Cups Industry Revenue Million Forecast, by Application 2020 & 2033
- Table 6: Global MEA Paper Cups Industry Revenue Million Forecast, by Country 2020 & 2033
- Table 7: United States MEA Paper Cups Industry Revenue (Million) Forecast, by Application 2020 & 2033
- Table 8: Canada MEA Paper Cups Industry Revenue (Million) Forecast, by Application 2020 & 2033
- Table 9: Mexico MEA Paper Cups Industry Revenue (Million) Forecast, by Application 2020 & 2033
- Table 10: Global MEA Paper Cups Industry Revenue Million Forecast, by Cup Type 2020 & 2033
- Table 11: Global MEA Paper Cups Industry Revenue Million Forecast, by Application 2020 & 2033
- Table 12: Global MEA Paper Cups Industry Revenue Million Forecast, by Country 2020 & 2033
- Table 13: Brazil MEA Paper Cups Industry Revenue (Million) Forecast, by Application 2020 & 2033
- Table 14: Argentina MEA Paper Cups Industry Revenue (Million) Forecast, by Application 2020 & 2033
- Table 15: Rest of South America MEA Paper Cups Industry Revenue (Million) Forecast, by Application 2020 & 2033
- Table 16: Global MEA Paper Cups Industry Revenue Million Forecast, by Cup Type 2020 & 2033
- Table 17: Global MEA Paper Cups Industry Revenue Million Forecast, by Application 2020 & 2033
- Table 18: Global MEA Paper Cups Industry Revenue Million Forecast, by Country 2020 & 2033
- Table 19: United Kingdom MEA Paper Cups Industry Revenue (Million) Forecast, by Application 2020 & 2033
- Table 20: Germany MEA Paper Cups Industry Revenue (Million) Forecast, by Application 2020 & 2033
- Table 21: France MEA Paper Cups Industry Revenue (Million) Forecast, by Application 2020 & 2033
- Table 22: Italy MEA Paper Cups Industry Revenue (Million) Forecast, by Application 2020 & 2033
- Table 23: Spain MEA Paper Cups Industry Revenue (Million) Forecast, by Application 2020 & 2033
- Table 24: Russia MEA Paper Cups Industry Revenue (Million) Forecast, by Application 2020 & 2033
- Table 25: Benelux MEA Paper Cups Industry Revenue (Million) Forecast, by Application 2020 & 2033
- Table 26: Nordics MEA Paper Cups Industry Revenue (Million) Forecast, by Application 2020 & 2033
- Table 27: Rest of Europe MEA Paper Cups Industry Revenue (Million) Forecast, by Application 2020 & 2033
- Table 28: Global MEA Paper Cups Industry Revenue Million Forecast, by Cup Type 2020 & 2033
- Table 29: Global MEA Paper Cups Industry Revenue Million Forecast, by Application 2020 & 2033
- Table 30: Global MEA Paper Cups Industry Revenue Million Forecast, by Country 2020 & 2033
- Table 31: Turkey MEA Paper Cups Industry Revenue (Million) Forecast, by Application 2020 & 2033
- Table 32: Israel MEA Paper Cups Industry Revenue (Million) Forecast, by Application 2020 & 2033
- Table 33: GCC MEA Paper Cups Industry Revenue (Million) Forecast, by Application 2020 & 2033
- Table 34: North Africa MEA Paper Cups Industry Revenue (Million) Forecast, by Application 2020 & 2033
- Table 35: South Africa MEA Paper Cups Industry Revenue (Million) Forecast, by Application 2020 & 2033
- Table 36: Rest of Middle East & Africa MEA Paper Cups Industry Revenue (Million) Forecast, by Application 2020 & 2033
- Table 37: Global MEA Paper Cups Industry Revenue Million Forecast, by Cup Type 2020 & 2033
- Table 38: Global MEA Paper Cups Industry Revenue Million Forecast, by Application 2020 & 2033
- Table 39: Global MEA Paper Cups Industry Revenue Million Forecast, by Country 2020 & 2033
- Table 40: China MEA Paper Cups Industry Revenue (Million) Forecast, by Application 2020 & 2033
- Table 41: India MEA Paper Cups Industry Revenue (Million) Forecast, by Application 2020 & 2033
- Table 42: Japan MEA Paper Cups Industry Revenue (Million) Forecast, by Application 2020 & 2033
- Table 43: South Korea MEA Paper Cups Industry Revenue (Million) Forecast, by Application 2020 & 2033
- Table 44: ASEAN MEA Paper Cups Industry Revenue (Million) Forecast, by Application 2020 & 2033
- Table 45: Oceania MEA Paper Cups Industry Revenue (Million) Forecast, by Application 2020 & 2033
- Table 46: Rest of Asia Pacific MEA Paper Cups Industry Revenue (Million) Forecast, by Application 2020 & 2033
Frequently Asked Questions
1. What is the projected Compound Annual Growth Rate (CAGR) of the MEA Paper Cups Industry?
The projected CAGR is approximately 4.81%.
2. Which companies are prominent players in the MEA Paper Cups Industry?
Key companies in the market include Bony Packaging, Alfa Pack, Arkan Mfg Paper Cup Company, Hotpack Packaging Industries LLC, Ultracare LLC, Golden Paper Cups Manufacturing LLC, Falcon Pack*List Not Exhaustive, Detpak South Africa (Pty) Ltd, Huhtamaki Group, Pack- Zone, MAIMOON Papers Industry LLC, Saqr Pack, Enpi Group, Gulf East Paper & Plastic Group, Graphic Packaging International, Saham Group.
3. What are the main segments of the MEA Paper Cups Industry?
The market segments include Cup Type, Application.
4. Can you provide details about the market size?
The market size is estimated to be USD 700.40 Million as of 2022.
5. What are some drivers contributing to market growth?
Rising Demand For on-the-go Consumption of Beverages; Sustainability Measures Coupled with Recent Innovations have Played a Role in Shelf Life of Products.
6. What are the notable trends driving market growth?
Quick Service Restaurants to Witness the Growth.
7. Are there any restraints impacting market growth?
Ongoing Market Fragmentation and the Dependence on Materials Expected to Affect Margins.
8. Can you provide examples of recent developments in the market?
November 2022: HotpackGlobal, the UAE-based global leader in disposable food packaging products, launched its manufacturing plant in Qatar. The plant is the 15th Hotpack-owned and operated factory worldwide, reflecting the company's global vision to become a global food packaging brand leader by 2030. The manufacturing plant is located in Doha's new industrial area, specializing in various Hotpackpaper products ranging from folding and corrugated cartons to paper bags and cups.
9. What pricing options are available for accessing the report?
Pricing options include single-user, multi-user, and enterprise licenses priced at USD 4750, USD 5250, and USD 8750 respectively.
10. Is the market size provided in terms of value or volume?
The market size is provided in terms of value, measured in Million.
11. Are there any specific market keywords associated with the report?
Yes, the market keyword associated with the report is "MEA Paper Cups Industry," which aids in identifying and referencing the specific market segment covered.
12. How do I determine which pricing option suits my needs best?
The pricing options vary based on user requirements and access needs. Individual users may opt for single-user licenses, while businesses requiring broader access may choose multi-user or enterprise licenses for cost-effective access to the report.
13. Are there any additional resources or data provided in the MEA Paper Cups Industry report?
While the report offers comprehensive insights, it's advisable to review the specific contents or supplementary materials provided to ascertain if additional resources or data are available.
14. How can I stay updated on further developments or reports in the MEA Paper Cups Industry?
To stay informed about further developments, trends, and reports in the MEA Paper Cups Industry, consider subscribing to industry newsletters, following relevant companies and organizations, or regularly checking reputable industry news sources and publications.
Methodology
Step 1 - Identification of Relevant Samples Size from Population Database


Step 2 - Approaches for Defining Global Market Size (Value, Volume* & Price*)

Note*: In applicable scenarios
Step 3 - Data Sources
Primary Research
- Web Analytics
- Survey Reports
- Research Institute
- Latest Research Reports
- Opinion Leaders
Secondary Research
- Annual Reports
- White Paper
- Latest Press Release
- Industry Association
- Paid Database
- Investor Presentations

Step 4 - Data Triangulation
Involves using different sources of information in order to increase the validity of a study
These sources are likely to be stakeholders in a program - participants, other researchers, program staff, other community members, and so on.
Then we put all data in single framework & apply various statistical tools to find out the dynamic on the market.
During the analysis stage, feedback from the stakeholder groups would be compared to determine areas of agreement as well as areas of divergence