

Key Insights
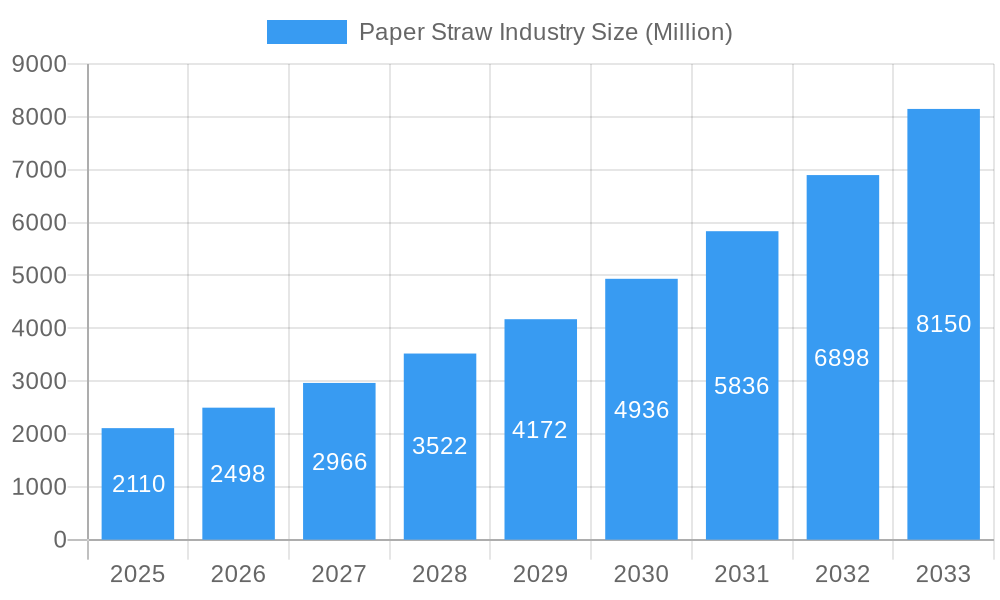
The global paper straw industry, valued at $2.11 billion in 2025, is experiencing robust growth, projected to expand at a compound annual growth rate (CAGR) of 18.73% from 2025 to 2033. This surge is primarily driven by the escalating demand for eco-friendly and biodegradable alternatives to plastic straws, fueled by growing environmental concerns and stringent regulations against single-use plastics worldwide. Key application segments include foodservice, households, and institutions, with foodservice currently dominating the market due to high consumption in restaurants, cafes, and quick-service establishments. The industry is segmented by material type, encompassing virgin paper and recycled paper straws. Recycled paper straws are gaining traction, appealing to environmentally conscious consumers and businesses seeking sustainable options. However, challenges remain, including fluctuations in raw material prices (paper pulp) and the need for continuous innovation to improve the durability and water resistance of paper straws. Major players like Canada Brown Eco Products Ltd, IPI SR, and Huhtamaki Oyj are investing heavily in research and development to address these limitations and expand their product offerings, particularly in specialized applications such as those requiring increased longevity. Geographic distribution shows strong growth potential across regions, particularly in Asia-Pacific and North America, driven by increasing consumer awareness and government initiatives promoting sustainable practices. The forecast period predicts continued expansion, driven by the sustained popularity of eco-conscious alternatives and the ongoing shift towards sustainable packaging solutions.
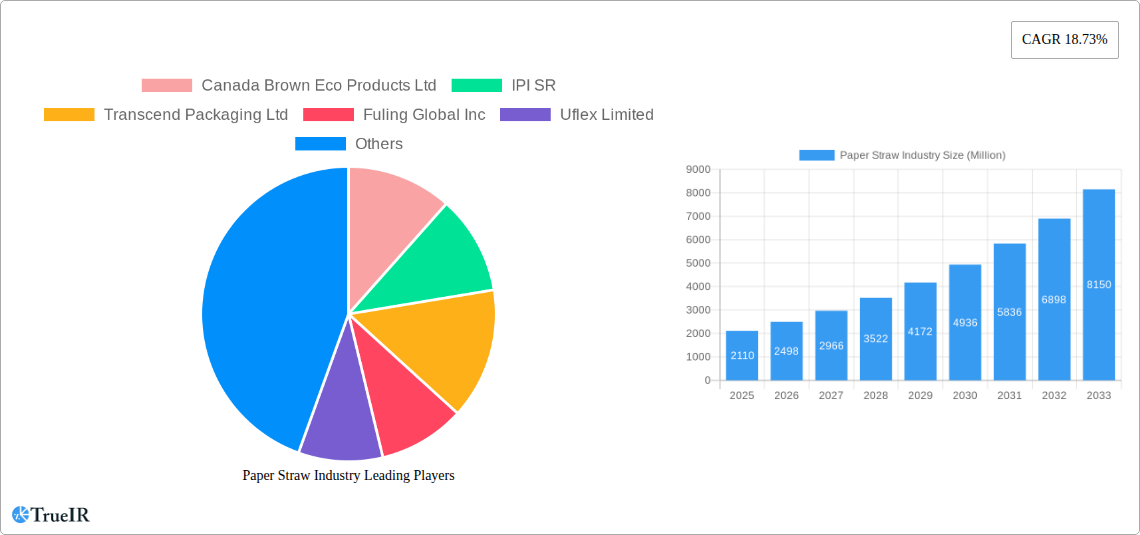
Paper Straw Industry Market Size (In Billion)
The competitive landscape is characterized by a blend of established players and emerging companies. Larger companies leverage their established distribution networks and brand recognition to maintain market share. Smaller, niche players often focus on innovative product designs or specialized materials to differentiate themselves. Future growth will depend on factors such as the effectiveness of governmental regulations, consumer adoption rates of sustainable products, and technological advancements in paper straw manufacturing which may lead to enhanced product characteristics and potentially lower production costs. The continued rise of sustainable initiatives and consumer preference for environmentally friendly products will remain a key driving force in the growth and expansion of the paper straw market in the coming years.
Paper Straw Industry Company Market Share
Dynamic Paper Straw Industry Market Report: 2019-2033
This comprehensive report provides an in-depth analysis of the global paper straw industry, offering valuable insights into market trends, competitive dynamics, and future growth prospects. Covering the period from 2019 to 2033, with a base year of 2025 and a forecast period of 2025-2033, this report is an essential resource for industry stakeholders, investors, and strategic decision-makers. The market is projected to reach xx Million by 2033, exhibiting a CAGR of xx% during the forecast period.
Paper Straw Industry Market Structure & Competitive Landscape
The paper straw industry exhibits a moderately consolidated market structure, with several key players holding significant market share. The Herfindahl-Hirschman Index (HHI) is estimated at xx, indicating a moderately concentrated market. Innovation is a crucial driver, with companies focusing on sustainable materials, improved durability, and functional enhancements. Regulatory pressures, particularly concerning sustainability and environmental compliance, significantly impact the industry. Paper straws are facing increasing competition from biodegradable plastic and alternative materials; however, their renewability and recyclability continue to offer a key advantage. The end-user segmentation is diverse, encompassing foodservice, households, institutions, and other sectors. The industry has witnessed a moderate level of mergers and acquisitions (M&A) activity in recent years, with xx Million in M&A value recorded during the historical period (2019-2024), driven primarily by strategic expansions and consolidation efforts.
- Market Concentration: Moderately concentrated, with HHI estimated at xx.
- Innovation Drivers: Sustainable materials, improved durability, functional enhancements.
- Regulatory Impacts: Growing emphasis on sustainability and environmental compliance.
- Product Substitutes: Biodegradable plastics and other alternative materials.
- End-User Segmentation: Foodservice, households, institutions, and other sectors.
- M&A Trends: Moderate activity, with xx Million in M&A value (2019-2024).
Paper Straw Industry Market Trends & Opportunities
The global paper straw market is experiencing robust growth, driven by increasing consumer preference for eco-friendly alternatives to plastic straws. The market size, valued at xx Million in 2025, is projected to reach xx Million by 2033, exhibiting significant expansion across various segments. Technological advancements in paper straw manufacturing, focusing on improved durability and functionality, are contributing to market expansion. Growing environmental awareness and stringent regulations against plastic are further bolstering market growth. The increasing penetration of paper straws in the foodservice sector is a major driver. Competitive dynamics are shaped by factors like pricing, product innovation, and sustainability credentials.
Dominant Markets & Segments in Paper Straw Industry
The North American region currently holds a dominant position in the global paper straw market, accounting for approximately xx% of the total market share in 2025. Within this region, the United States is the largest national market, owing to high consumer demand for eco-friendly products and stringent regulations on plastic straw usage. The foodservice segment represents the largest application area, driven by the widespread adoption of paper straws by restaurants, cafes, and other food establishments.
- Dominant Region: North America (xx% market share in 2025)
- Dominant Country: United States
- Dominant Segment (Application): Foodservice
- Dominant Segment (Material Type): Recycled Paper (growing faster than Virgin Paper)
Key Growth Drivers:
- Increasing consumer preference for sustainable products.
- Stringent regulations against plastic straws.
- Growing demand from the foodservice sector.
- Technological advancements in paper straw production.
- Government initiatives promoting sustainable packaging.
Paper Straw Industry Product Analysis
Paper straw innovations focus on enhanced durability, water resistance, and biodegradability. The use of advanced coating technologies and material blends improves functionality while maintaining eco-friendly attributes. These innovations cater to increasing consumer expectations and the need for sustainable alternatives to plastic straws. Competitive advantages are derived from superior material quality, efficient production processes, and strong brand recognition, leading to premium pricing.
Key Drivers, Barriers & Challenges in Paper Straw Industry
Key Drivers:
- Rising consumer awareness of environmental issues and preference for sustainable products.
- Stringent government regulations on single-use plastics, promoting paper straw adoption.
- Growing demand from the foodservice industry and other sectors.
Challenges and Restraints:
- Fluctuations in raw material prices (pulp and paper) impacting profitability.
- Concerns about the biodegradability and compostability of certain paper straw types.
- Competition from other sustainable alternatives like biodegradable plastics.
- Supply chain disruptions affecting availability and cost.
Growth Drivers in the Paper Straw Industry Market
The paper straw market is significantly boosted by increasing consumer demand for eco-friendly alternatives to plastic, coupled with stricter regulations against plastic usage in many regions. Technological advancements lead to improved durability and functionality. Government initiatives promoting sustainable packaging further accelerate market growth.
Challenges Impacting Paper Straw Industry Growth
Major challenges include the volatility of raw material prices, competition from alternative materials, and ensuring consistent quality and biodegradability of paper straws. Supply chain disruptions can also significantly affect production and pricing.
Key Players Shaping the Paper Straw Industry Market
- Canada Brown Eco Products Ltd
- IPI SR
- Transcend Packaging Ltd
- Fuling Global Inc
- Uflex Limited
- Tembo Paper BV
- Karat Packaging Inc (Lollicup USA Inc)
- Tetra Pak International SA
- Huhtamaki Oyj
- Hoffmaster Group Inc
Significant Paper Straw Industry Industry Milestones
- February 2023: Tetra Pak International SA initiated research to enhance fiber-based sustainable food packaging using advanced synchrotron radiation technology, aiming to optimize paper straw composition.
- April 2023: Transcend Packaging Ltd formed a strategic partnership with ITOCHU Corporation, expanding its reach in Asia and North America.
Future Outlook for Paper Straw Industry Market
The paper straw market is poised for continued growth, driven by sustained demand for eco-friendly alternatives, technological innovation, and supportive regulatory frameworks. Strategic partnerships, product diversification, and expansion into new markets will be key to success for industry players. The market presents significant opportunities for companies focused on sustainability and innovation.
Paper Straw Industry Segmentation
-
1. Material Type
- 1.1. Virgin Paper
- 1.2. Recycled Paper
-
2. Application
- 2.1. Foodservice
- 2.2. Households
- 2.3. Institutions
Paper Straw Industry Segmentation By Geography
- 1. North America
- 2. Europe
- 3. Asia Pacific
- 4. Latin America
- 5. Middle East and Africa
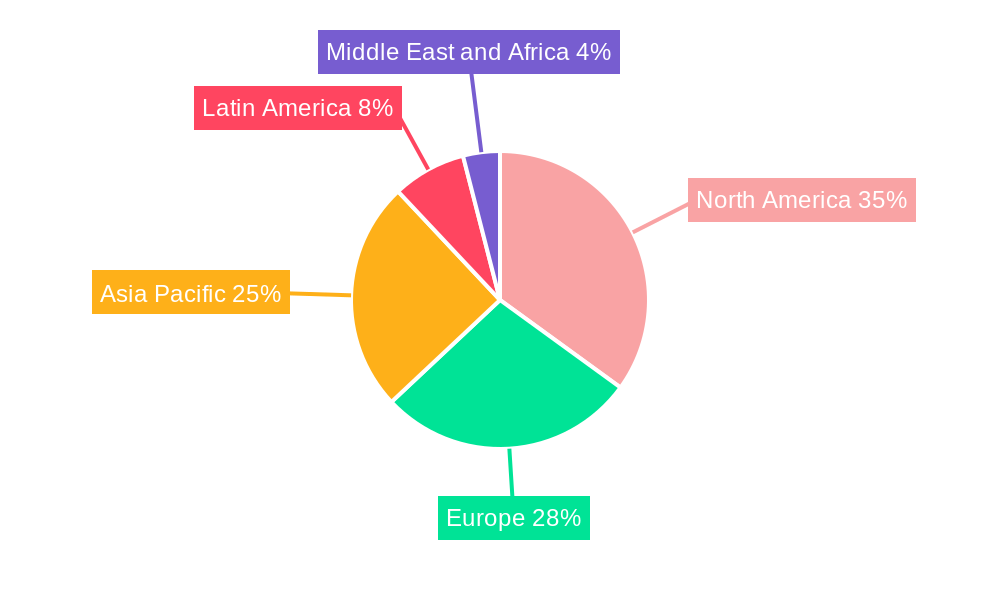
Paper Straw Industry Regional Market Share
Geographic Coverage of Paper Straw Industry
Paper Straw Industry REPORT HIGHLIGHTS
| Aspects | Details |
|---|---|
| Study Period | 2020-2034 |
| Base Year | 2025 |
| Estimated Year | 2026 |
| Forecast Period | 2026-2034 |
| Historical Period | 2020-2025 |
| Growth Rate | CAGR of 18.73% from 2020-2034 |
| Segmentation |
|
Table of Contents
- 1. Introduction
- 1.1. Research Scope
- 1.2. Market Segmentation
- 1.3. Research Objective
- 1.4. Definitions and Assumptions
- 2. Executive Summary
- 2.1. Market Snapshot
- 3. Market Dynamics
- 3.1. Market Drivers
- 3.2. Market Restrains
- 3.3. Market Trends
- 3.4. Market Opportunities
- 4. Market Factor Analysis
- 4.1. Porters Five Forces
- 4.1.1. Bargaining Power of Suppliers
- 4.1.2. Bargaining Power of Buyers
- 4.1.3. Threat of New Entrants
- 4.1.4. Threat of Substitutes
- 4.1.5. Competitive Rivalry
- 4.2. PESTEL analysis
- 4.3. BCG Analysis
- 4.3.1. Stars (High Growth, High Market Share)
- 4.3.2. Cash Cows (Low Growth, High Market Share)
- 4.3.3. Question Mark (High Growth, Low Market Share)
- 4.3.4. Dogs (Low Growth, Low Market Share)
- 4.4. Ansoff Matrix Analysis
- 4.5. Supply Chain Analysis
- 4.6. Regulatory Landscape
- 4.7. Current Market Potential and Opportunity Assessment (TAM–SAM–SOM Framework)
- 4.8. TIR Analyst Note
- 4.1. Porters Five Forces
- 5. Market Analysis, Insights and Forecast 2021-2033
- 5.1. Market Analysis, Insights and Forecast - by Material Type
- 5.1.1. Virgin Paper
- 5.1.2. Recycled Paper
- 5.2. Market Analysis, Insights and Forecast - by Application
- 5.2.1. Foodservice
- 5.2.2. Households
- 5.2.3. Institutions
- 5.3. Market Analysis, Insights and Forecast - by Region
- 5.3.1. North America
- 5.3.2. Europe
- 5.3.3. Asia Pacific
- 5.3.4. Latin America
- 5.3.5. Middle East and Africa
- 5.1. Market Analysis, Insights and Forecast - by Material Type
- 6. Global Paper Straw Industry Analysis, Insights and Forecast, 2021-2033
- 6.1. Market Analysis, Insights and Forecast - by Material Type
- 6.1.1. Virgin Paper
- 6.1.2. Recycled Paper
- 6.2. Market Analysis, Insights and Forecast - by Application
- 6.2.1. Foodservice
- 6.2.2. Households
- 6.2.3. Institutions
- 6.1. Market Analysis, Insights and Forecast - by Material Type
- 7. North America Paper Straw Industry Analysis, Insights and Forecast, 2020-2032
- 7.1. Market Analysis, Insights and Forecast - by Material Type
- 7.1.1. Virgin Paper
- 7.1.2. Recycled Paper
- 7.2. Market Analysis, Insights and Forecast - by Application
- 7.2.1. Foodservice
- 7.2.2. Households
- 7.2.3. Institutions
- 7.1. Market Analysis, Insights and Forecast - by Material Type
- 8. Europe Paper Straw Industry Analysis, Insights and Forecast, 2020-2032
- 8.1. Market Analysis, Insights and Forecast - by Material Type
- 8.1.1. Virgin Paper
- 8.1.2. Recycled Paper
- 8.2. Market Analysis, Insights and Forecast - by Application
- 8.2.1. Foodservice
- 8.2.2. Households
- 8.2.3. Institutions
- 8.1. Market Analysis, Insights and Forecast - by Material Type
- 9. Asia Pacific Paper Straw Industry Analysis, Insights and Forecast, 2020-2032
- 9.1. Market Analysis, Insights and Forecast - by Material Type
- 9.1.1. Virgin Paper
- 9.1.2. Recycled Paper
- 9.2. Market Analysis, Insights and Forecast - by Application
- 9.2.1. Foodservice
- 9.2.2. Households
- 9.2.3. Institutions
- 9.1. Market Analysis, Insights and Forecast - by Material Type
- 10. Latin America Paper Straw Industry Analysis, Insights and Forecast, 2020-2032
- 10.1. Market Analysis, Insights and Forecast - by Material Type
- 10.1.1. Virgin Paper
- 10.1.2. Recycled Paper
- 10.2. Market Analysis, Insights and Forecast - by Application
- 10.2.1. Foodservice
- 10.2.2. Households
- 10.2.3. Institutions
- 10.1. Market Analysis, Insights and Forecast - by Material Type
- 11. Middle East and Africa Paper Straw Industry Analysis, Insights and Forecast, 2020-2032
- 11.1. Market Analysis, Insights and Forecast - by Material Type
- 11.1.1. Virgin Paper
- 11.1.2. Recycled Paper
- 11.2. Market Analysis, Insights and Forecast - by Application
- 11.2.1. Foodservice
- 11.2.2. Households
- 11.2.3. Institutions
- 11.1. Market Analysis, Insights and Forecast - by Material Type
- 12. Competitive Analysis
- 12.1. Company Profiles
- 12.1.1 Canada Brown Eco Products Ltd
- 12.1.1.1. Company Overview
- 12.1.1.2. Products
- 12.1.1.3. Company Financials
- 12.1.1.4. SWOT Analysis
- 12.1.2 IPI SR
- 12.1.2.1. Company Overview
- 12.1.2.2. Products
- 12.1.2.3. Company Financials
- 12.1.2.4. SWOT Analysis
- 12.1.3 Transcend Packaging Ltd
- 12.1.3.1. Company Overview
- 12.1.3.2. Products
- 12.1.3.3. Company Financials
- 12.1.3.4. SWOT Analysis
- 12.1.4 Fuling Global Inc
- 12.1.4.1. Company Overview
- 12.1.4.2. Products
- 12.1.4.3. Company Financials
- 12.1.4.4. SWOT Analysis
- 12.1.5 Uflex Limited
- 12.1.5.1. Company Overview
- 12.1.5.2. Products
- 12.1.5.3. Company Financials
- 12.1.5.4. SWOT Analysis
- 12.1.6 Tembo Paper BV
- 12.1.6.1. Company Overview
- 12.1.6.2. Products
- 12.1.6.3. Company Financials
- 12.1.6.4. SWOT Analysis
- 12.1.7 Karat Packaging Inc (Lollicup USA Inc )
- 12.1.7.1. Company Overview
- 12.1.7.2. Products
- 12.1.7.3. Company Financials
- 12.1.7.4. SWOT Analysis
- 12.1.8 Tetra Pak International SA
- 12.1.8.1. Company Overview
- 12.1.8.2. Products
- 12.1.8.3. Company Financials
- 12.1.8.4. SWOT Analysis
- 12.1.9 Huhtamaki Oyj
- 12.1.9.1. Company Overview
- 12.1.9.2. Products
- 12.1.9.3. Company Financials
- 12.1.9.4. SWOT Analysis
- 12.1.10 Hoffmaster Group Inc
- 12.1.10.1. Company Overview
- 12.1.10.2. Products
- 12.1.10.3. Company Financials
- 12.1.10.4. SWOT Analysis
- 12.1.1 Canada Brown Eco Products Ltd
- 12.2. Market Entropy
- 12.2.1 Company's Key Areas Served
- 12.2.2 Recent Developments
- 12.3. Company Market Share Analysis 2025
- 12.3.1 Top 5 Companies Market Share Analysis
- 12.3.2 Top 3 Companies Market Share Analysis
- 12.4. List of Potential Customers
- 13. Research Methodology
List of Figures
- Figure 1: Global Paper Straw Industry Revenue Breakdown (Million, %) by Region 2025 & 2033
- Figure 2: North America Paper Straw Industry Revenue (Million), by Material Type 2025 & 2033
- Figure 3: North America Paper Straw Industry Revenue Share (%), by Material Type 2025 & 2033
- Figure 4: North America Paper Straw Industry Revenue (Million), by Application 2025 & 2033
- Figure 5: North America Paper Straw Industry Revenue Share (%), by Application 2025 & 2033
- Figure 6: North America Paper Straw Industry Revenue (Million), by Country 2025 & 2033
- Figure 7: North America Paper Straw Industry Revenue Share (%), by Country 2025 & 2033
- Figure 8: Europe Paper Straw Industry Revenue (Million), by Material Type 2025 & 2033
- Figure 9: Europe Paper Straw Industry Revenue Share (%), by Material Type 2025 & 2033
- Figure 10: Europe Paper Straw Industry Revenue (Million), by Application 2025 & 2033
- Figure 11: Europe Paper Straw Industry Revenue Share (%), by Application 2025 & 2033
- Figure 12: Europe Paper Straw Industry Revenue (Million), by Country 2025 & 2033
- Figure 13: Europe Paper Straw Industry Revenue Share (%), by Country 2025 & 2033
- Figure 14: Asia Pacific Paper Straw Industry Revenue (Million), by Material Type 2025 & 2033
- Figure 15: Asia Pacific Paper Straw Industry Revenue Share (%), by Material Type 2025 & 2033
- Figure 16: Asia Pacific Paper Straw Industry Revenue (Million), by Application 2025 & 2033
- Figure 17: Asia Pacific Paper Straw Industry Revenue Share (%), by Application 2025 & 2033
- Figure 18: Asia Pacific Paper Straw Industry Revenue (Million), by Country 2025 & 2033
- Figure 19: Asia Pacific Paper Straw Industry Revenue Share (%), by Country 2025 & 2033
- Figure 20: Latin America Paper Straw Industry Revenue (Million), by Material Type 2025 & 2033
- Figure 21: Latin America Paper Straw Industry Revenue Share (%), by Material Type 2025 & 2033
- Figure 22: Latin America Paper Straw Industry Revenue (Million), by Application 2025 & 2033
- Figure 23: Latin America Paper Straw Industry Revenue Share (%), by Application 2025 & 2033
- Figure 24: Latin America Paper Straw Industry Revenue (Million), by Country 2025 & 2033
- Figure 25: Latin America Paper Straw Industry Revenue Share (%), by Country 2025 & 2033
- Figure 26: Middle East and Africa Paper Straw Industry Revenue (Million), by Material Type 2025 & 2033
- Figure 27: Middle East and Africa Paper Straw Industry Revenue Share (%), by Material Type 2025 & 2033
- Figure 28: Middle East and Africa Paper Straw Industry Revenue (Million), by Application 2025 & 2033
- Figure 29: Middle East and Africa Paper Straw Industry Revenue Share (%), by Application 2025 & 2033
- Figure 30: Middle East and Africa Paper Straw Industry Revenue (Million), by Country 2025 & 2033
- Figure 31: Middle East and Africa Paper Straw Industry Revenue Share (%), by Country 2025 & 2033
List of Tables
- Table 1: Global Paper Straw Industry Revenue Million Forecast, by Material Type 2020 & 2033
- Table 2: Global Paper Straw Industry Revenue Million Forecast, by Application 2020 & 2033
- Table 3: Global Paper Straw Industry Revenue Million Forecast, by Region 2020 & 2033
- Table 4: Global Paper Straw Industry Revenue Million Forecast, by Material Type 2020 & 2033
- Table 5: Global Paper Straw Industry Revenue Million Forecast, by Application 2020 & 2033
- Table 6: Global Paper Straw Industry Revenue Million Forecast, by Country 2020 & 2033
- Table 7: Global Paper Straw Industry Revenue Million Forecast, by Material Type 2020 & 2033
- Table 8: Global Paper Straw Industry Revenue Million Forecast, by Application 2020 & 2033
- Table 9: Global Paper Straw Industry Revenue Million Forecast, by Country 2020 & 2033
- Table 10: Global Paper Straw Industry Revenue Million Forecast, by Material Type 2020 & 2033
- Table 11: Global Paper Straw Industry Revenue Million Forecast, by Application 2020 & 2033
- Table 12: Global Paper Straw Industry Revenue Million Forecast, by Country 2020 & 2033
- Table 13: Global Paper Straw Industry Revenue Million Forecast, by Material Type 2020 & 2033
- Table 14: Global Paper Straw Industry Revenue Million Forecast, by Application 2020 & 2033
- Table 15: Global Paper Straw Industry Revenue Million Forecast, by Country 2020 & 2033
- Table 16: Global Paper Straw Industry Revenue Million Forecast, by Material Type 2020 & 2033
- Table 17: Global Paper Straw Industry Revenue Million Forecast, by Application 2020 & 2033
- Table 18: Global Paper Straw Industry Revenue Million Forecast, by Country 2020 & 2033
Frequently Asked Questions
1. What is the projected Compound Annual Growth Rate (CAGR) of the Paper Straw Industry?
The projected CAGR is approximately 18.73%.
2. Which companies are prominent players in the Paper Straw Industry?
Key companies in the market include Canada Brown Eco Products Ltd, IPI SR, Transcend Packaging Ltd, Fuling Global Inc, Uflex Limited, Tembo Paper BV, Karat Packaging Inc (Lollicup USA Inc ), Tetra Pak International SA, Huhtamaki Oyj, Hoffmaster Group Inc.
3. What are the main segments of the Paper Straw Industry?
The market segments include Material Type, Application.
4. Can you provide details about the market size?
The market size is estimated to be USD 2.11 Million as of 2022.
5. What are some drivers contributing to market growth?
Increasing Consumer Demand for Eco-Friendly Straws; Ban on Single-use Plastic Products Aids the Market Growth.
6. What are the notable trends driving market growth?
The Rise of Environmentally Friendly Straws in Response to Stringent Regulations.
7. Are there any restraints impacting market growth?
Competition from In-house packaging.
8. Can you provide examples of recent developments in the market?
April 2023: Transcend Packaging Ltd announced its strategic partnership with ITOCHU Corporation, a global provider of pulp and paper products. The partnership will help the company expand its footprint in Asia and North America with a variety of products.
9. What pricing options are available for accessing the report?
Pricing options include single-user, multi-user, and enterprise licenses priced at USD 4750, USD 5250, and USD 8750 respectively.
10. Is the market size provided in terms of value or volume?
The market size is provided in terms of value, measured in Million.
11. Are there any specific market keywords associated with the report?
Yes, the market keyword associated with the report is "Paper Straw Industry," which aids in identifying and referencing the specific market segment covered.
12. How do I determine which pricing option suits my needs best?
The pricing options vary based on user requirements and access needs. Individual users may opt for single-user licenses, while businesses requiring broader access may choose multi-user or enterprise licenses for cost-effective access to the report.
13. Are there any additional resources or data provided in the Paper Straw Industry report?
While the report offers comprehensive insights, it's advisable to review the specific contents or supplementary materials provided to ascertain if additional resources or data are available.
14. How can I stay updated on further developments or reports in the Paper Straw Industry?
To stay informed about further developments, trends, and reports in the Paper Straw Industry, consider subscribing to industry newsletters, following relevant companies and organizations, or regularly checking reputable industry news sources and publications.
Methodology
Step 1 - Identification of Relevant Samples Size from Population Database


Step 2 - Approaches for Defining Global Market Size (Value, Volume* & Price*)

Note*: In applicable scenarios
Step 3 - Data Sources
Primary Research
- Web Analytics
- Survey Reports
- Research Institute
- Latest Research Reports
- Opinion Leaders
Secondary Research
- Annual Reports
- White Paper
- Latest Press Release
- Industry Association
- Paid Database
- Investor Presentations

Step 4 - Data Triangulation
Involves using different sources of information in order to increase the validity of a study
These sources are likely to be stakeholders in a program - participants, other researchers, program staff, other community members, and so on.
Then we put all data in single framework & apply various statistical tools to find out the dynamic on the market.
During the analysis stage, feedback from the stakeholder groups would be compared to determine areas of agreement as well as areas of divergence