

Key Insights
The Returnable Transit Packaging (RTP) market, valued at approximately $257.7 billion in 2025, is projected to experience robust growth. It is expected to exhibit a Compound Annual Growth Rate (CAGR) of 7.19% from 2025 to 2033. This expansion is primarily driven by the increasing adoption of sustainable packaging solutions across key industries such as automotive, food & beverages, and consumer goods. The surge in e-commerce and the critical need for efficient supply chain management further amplify demand for RTP. Companies are actively prioritizing reusable packaging to minimize waste, reduce transportation expenses, and bolster their environmental stewardship. Moreover, advancements in material science are yielding more durable and versatile RTP options, stimulating market expansion. Currently, plastic containers, drums, and barrels dominate market share owing to their cost-effectiveness and ease of maintenance. However, growing environmental concerns regarding plastic pollution are prompting exploration of sustainable alternatives, including biodegradable plastics and wood-based solutions. Regionally, North America and Europe are anticipated to retain significant market shares, propelled by strong consumer demand and stringent environmental regulations. The Asia-Pacific region presents substantial growth potential, driven by expanding industrialization and escalating e-commerce activities.
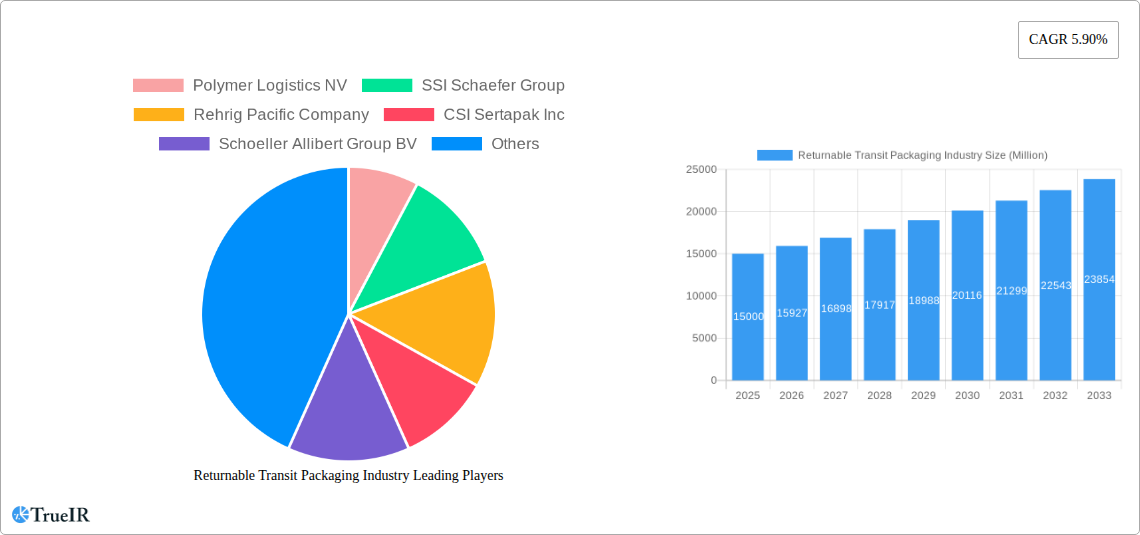
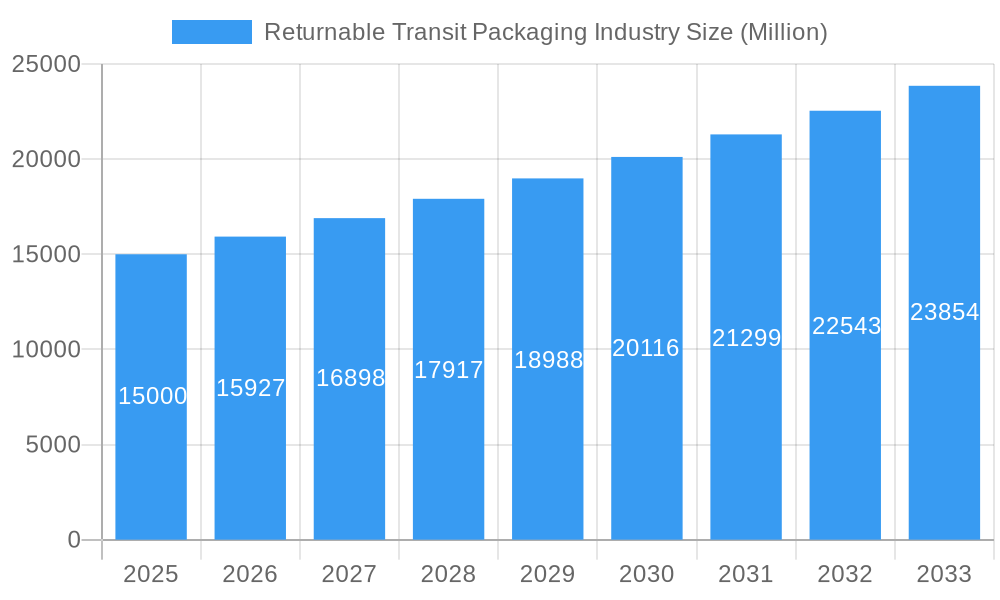
Returnable Transit Packaging Industry Market Size (In Billion)
While the RTP market demonstrates promising growth trajectories, certain constraints warrant attention. Fluctuations in raw material prices, particularly for plastics and metals, can affect production costs and profitability. Furthermore, the substantial initial investment required for implementing RTP systems may present a hurdle for smaller enterprises. Intensifying competition among established players and new entrants necessitates continuous innovation and product enhancement. Despite these challenges, the long-term outlook for the RTP market remains optimistic, underpinned by the escalating global emphasis on sustainability and supply chain optimization. The ongoing transition towards circular economy models further reinforces the demand for reusable packaging, ensuring sustained market growth.
Returnable Transit Packaging Industry Company Market Share
Returnable Transit Packaging Industry: A Comprehensive Market Report (2019-2033)
This comprehensive report provides an in-depth analysis of the Returnable Transit Packaging (RTP) industry, encompassing market size, growth drivers, competitive landscape, and future outlook. The study period covers 2019-2033, with 2025 as the base and estimated year. The report leverages extensive data analysis to forecast market trends from 2025 to 2033, offering invaluable insights for stakeholders across the RTP value chain. The market is segmented by material (plastic, metal, wood), product type (containers, pallets, crates, IBCs, etc.), and application (automotive, food & beverage, consumer goods, etc.). Leading companies like Polymer Logistics NV, SSI Schaefer Group, and Brambles Limited (CHEP & Orbis) are profiled, revealing their strategies and market positions. This report is essential for businesses seeking to understand and capitalize on the growth opportunities within this dynamic industry. The global market size in 2025 is estimated to be $XX Million.
Returnable Transit Packaging Industry Market Structure & Competitive Landscape
The Returnable Transit Packaging (RTP) industry exhibits a moderately concentrated market structure. Leading players like Polymer Logistics NV, SSI Schaefer Group, Rehrig Pacific Company, CSI Sertapak Inc, Schoeller Allibert Group BV, Nefab AB, IFCO Systems, Mugele Group, Lamar Packaging Systems, and Brambles Limited (CHEP & Orbis Corporation) hold significant market share. The industry's concentration ratio (CR4) is estimated at xx%, indicating moderate competition.
Innovation is a key driver, with companies continuously developing sustainable and efficient RTP solutions. Regulatory pressures, particularly concerning environmental sustainability and material sourcing, are shaping industry practices. Product substitution, mainly from alternative packaging materials and reusable systems, presents a challenge. End-user segmentation across various industries—automotive, food and beverage, consumer goods, and industrial—influences market demand. Mergers and acquisitions (M&A) activity within the RTP sector has been moderate in recent years, with approximately xx M&A deals recorded between 2019 and 2024, primarily focused on expanding geographic reach and product portfolios.
Returnable Transit Packaging Industry Market Trends & Opportunities
The global returnable transit packaging market is experiencing significant growth, driven by the increasing demand for efficient and sustainable supply chain solutions across diverse industries. The market size is projected to reach $XX Million by 2033, exhibiting a Compound Annual Growth Rate (CAGR) of xx% during the forecast period (2025-2033). This growth is fueled by several key trends:
- Technological advancements: The adoption of smart packaging technologies, incorporating RFID and sensors, enables real-time tracking and improved inventory management. Automation in manufacturing and handling of RTP further enhances efficiency.
- Sustainability concerns: The growing emphasis on reducing waste and environmental impact is driving demand for reusable and recyclable RTP solutions. Companies are increasingly adopting circular economy models.
- E-commerce boom: The rapid growth of e-commerce has led to an increased need for efficient and reliable packaging for delivering goods directly to consumers.
- Supply chain optimization: Businesses are seeking to optimize their supply chains by improving logistics and reducing transportation costs. RTP contributes significantly to these goals.
- Shifting consumer preferences: Consumers are increasingly conscious of sustainable practices, influencing their purchasing decisions and pushing companies to adopt eco-friendly packaging.
- Intense Competition: The market faces increasing competition, driving innovation and price pressures.
Dominant Markets & Segments in Returnable Transit Packaging Industry
The dominant segments and markets within the RTP industry are dynamic and influenced by regional economic development, industrial growth, and consumer preferences. The largest market is currently estimated to be in [Region/Country Name], representing xx% of the global market in 2025.
Key Growth Drivers by Segment:
- Material: Plastic continues to dominate due to its cost-effectiveness and versatility. However, growth in sustainable materials like recycled plastics and bioplastics is gaining momentum.
- Product Type: Pallets and containers constitute the largest product segments, owing to their widespread use across multiple industries. IBCs are showing significant growth potential driven by the chemical and food & beverage industries.
- Application: The food and beverage, automotive, and consumer goods industries represent the largest application segments due to their high volume of goods transportation and their emphasis on supply chain optimization.
Detailed Market Dominance Analysis:
The dominance of certain segments is attributed to several factors: well-established supply chains, high consumer demand, government support, and favorable economic conditions. The growth potential of other segments is driven by technological advancements and increasing adoption of sustainable packaging practices.
Returnable Transit Packaging Industry Product Analysis
Product innovation in the RTP industry focuses on enhanced durability, recyclability, and integration with smart technologies. New materials and designs improve stackability, reducing transportation costs and maximizing space utilization. Features such as integrated RFID tags facilitate real-time tracking and improved inventory management. The competitive advantage lies in offering customized solutions tailored to specific industry needs, coupled with robust after-sales support and efficient repair/replacement services. The growing focus on lightweight and strong materials, such as advanced polymers and composites, is optimizing the performance and environmental footprint of RTP solutions.
Key Drivers, Barriers & Challenges in Returnable Transit Packaging Industry
Key Drivers:
- Growing demand for efficient supply chain solutions across various sectors.
- Increasing focus on sustainable and eco-friendly packaging.
- Technological advancements leading to improved tracking and management systems.
- Stringent regulatory standards promoting reusable packaging.
Key Challenges:
- Supply chain disruptions: Fluctuations in raw material prices and geopolitical uncertainties can impact production costs and lead times.
- Regulatory complexities: Compliance with environmental regulations and safety standards can add to operational costs.
- Competitive pressures: Intense competition from both established and new entrants drives the need for constant innovation and cost optimization.
Growth Drivers in the Returnable Transit Packaging Industry Market
The growth of the returnable transit packaging market is fueled by a confluence of factors. Increased emphasis on supply chain efficiency and sustainability is driving the adoption of reusable packaging solutions. Technological advancements in materials science and tracking technologies enhance the performance and value proposition of RTP. Government regulations promoting sustainable packaging and reducing waste are also creating favorable market conditions. Lastly, rising e-commerce activities fuel the demand for reliable and efficient packaging for direct-to-consumer deliveries.
Challenges Impacting Returnable Transit Packaging Industry Growth
Several factors hinder the growth of the RTP market. Supply chain volatility and raw material price fluctuations impact production costs. Stringent regulations and compliance requirements add to operational complexities and costs. Furthermore, intense competition and pressure to reduce prices challenge profitability. Finally, achieving a balance between cost-effectiveness and environmental sustainability remains a crucial challenge for businesses.
Key Players Shaping the Returnable Transit Packaging Industry Market
Significant Returnable Transit Packaging Industry Milestones
- 2020: Increased adoption of recycled plastics in RTP manufacturing.
- 2021: Several key players invested heavily in automation and robotics to improve efficiency.
- 2022: Launch of new smart packaging technologies, incorporating RFID tracking.
- 2023: Significant growth in the e-commerce sector driving demand for efficient RTP solutions.
- 2024: Several key mergers and acquisitions among leading RTP manufacturers.
Future Outlook for Returnable Transit Packaging Industry Market
The future of the returnable transit packaging industry looks promising. Continued growth is expected, driven by the sustained focus on sustainable supply chain solutions and technological advancements. Opportunities lie in developing innovative, lightweight, and recyclable materials. Integration of IoT and AI-powered systems for real-time tracking and optimization will also significantly impact the industry. The market potential remains substantial, particularly in emerging economies and across sectors emphasizing sustainability.
Returnable Transit Packaging Industry Segmentation
-
1. Material
- 1.1. Plastic
- 1.2. Metal
- 1.3. Wood
-
2. Product
- 2.1. Containers
- 2.2. Drums & Barrels
- 2.3. Pallets
- 2.4. Crates, Totes, Trays & Bins
- 2.5. Intermediate Bulk Containers (IBC's)
- 2.6. Other Product Types
-
3. Application
- 3.1. Automotive
- 3.2. Food and Beverages
- 3.3. Consumer Goods
- 3.4. Industrial
- 3.5. Others
Returnable Transit Packaging Industry Segmentation By Geography
- 1. North America
- 2. Europe
- 3. Asia Pacific
- 4. Latin America
- 5. Middle East and Africa
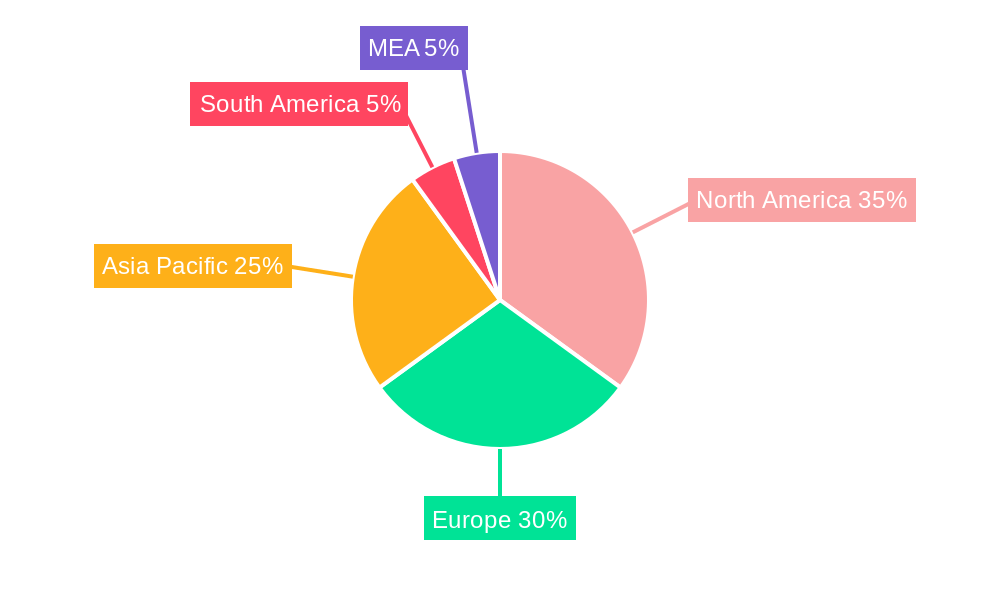
Returnable Transit Packaging Industry Regional Market Share
Geographic Coverage of Returnable Transit Packaging Industry
Returnable Transit Packaging Industry REPORT HIGHLIGHTS
| Aspects | Details |
|---|---|
| Study Period | 2020-2034 |
| Base Year | 2025 |
| Estimated Year | 2026 |
| Forecast Period | 2026-2034 |
| Historical Period | 2020-2025 |
| Growth Rate | CAGR of 7.19% from 2020-2034 |
| Segmentation |
|
Table of Contents
- 1. Introduction
- 1.1. Research Scope
- 1.2. Market Segmentation
- 1.3. Research Objective
- 1.4. Definitions and Assumptions
- 2. Executive Summary
- 2.1. Market Snapshot
- 3. Market Dynamics
- 3.1. Market Drivers
- 3.2. Market Restrains
- 3.3. Market Trends
- 3.4. Market Opportunities
- 4. Market Factor Analysis
- 4.1. Porters Five Forces
- 4.1.1. Bargaining Power of Suppliers
- 4.1.2. Bargaining Power of Buyers
- 4.1.3. Threat of New Entrants
- 4.1.4. Threat of Substitutes
- 4.1.5. Competitive Rivalry
- 4.2. PESTEL analysis
- 4.3. BCG Analysis
- 4.3.1. Stars (High Growth, High Market Share)
- 4.3.2. Cash Cows (Low Growth, High Market Share)
- 4.3.3. Question Mark (High Growth, Low Market Share)
- 4.3.4. Dogs (Low Growth, Low Market Share)
- 4.4. Ansoff Matrix Analysis
- 4.5. Supply Chain Analysis
- 4.6. Regulatory Landscape
- 4.7. Current Market Potential and Opportunity Assessment (TAM–SAM–SOM Framework)
- 4.8. TIR Analyst Note
- 4.1. Porters Five Forces
- 5. Market Analysis, Insights and Forecast 2021-2033
- 5.1. Market Analysis, Insights and Forecast - by Material
- 5.1.1. Plastic
- 5.1.2. Metal
- 5.1.3. Wood
- 5.2. Market Analysis, Insights and Forecast - by Product
- 5.2.1. Containers
- 5.2.2. Drums & Barrels
- 5.2.3. Pallets
- 5.2.4. Crates, Totes, Trays & Bins
- 5.2.5. Intermediate Bulk Containers (IBC's)
- 5.2.6. Other Product Types
- 5.3. Market Analysis, Insights and Forecast - by Application
- 5.3.1. Automotive
- 5.3.2. Food and Beverages
- 5.3.3. Consumer Goods
- 5.3.4. Industrial
- 5.3.5. Others
- 5.4. Market Analysis, Insights and Forecast - by Region
- 5.4.1. North America
- 5.4.2. Europe
- 5.4.3. Asia Pacific
- 5.4.4. Latin America
- 5.4.5. Middle East and Africa
- 5.1. Market Analysis, Insights and Forecast - by Material
- 6. Global Returnable Transit Packaging Industry Analysis, Insights and Forecast, 2021-2033
- 6.1. Market Analysis, Insights and Forecast - by Material
- 6.1.1. Plastic
- 6.1.2. Metal
- 6.1.3. Wood
- 6.2. Market Analysis, Insights and Forecast - by Product
- 6.2.1. Containers
- 6.2.2. Drums & Barrels
- 6.2.3. Pallets
- 6.2.4. Crates, Totes, Trays & Bins
- 6.2.5. Intermediate Bulk Containers (IBC's)
- 6.2.6. Other Product Types
- 6.3. Market Analysis, Insights and Forecast - by Application
- 6.3.1. Automotive
- 6.3.2. Food and Beverages
- 6.3.3. Consumer Goods
- 6.3.4. Industrial
- 6.3.5. Others
- 6.1. Market Analysis, Insights and Forecast - by Material
- 7. North America Returnable Transit Packaging Industry Analysis, Insights and Forecast, 2020-2032
- 7.1. Market Analysis, Insights and Forecast - by Material
- 7.1.1. Plastic
- 7.1.2. Metal
- 7.1.3. Wood
- 7.2. Market Analysis, Insights and Forecast - by Product
- 7.2.1. Containers
- 7.2.2. Drums & Barrels
- 7.2.3. Pallets
- 7.2.4. Crates, Totes, Trays & Bins
- 7.2.5. Intermediate Bulk Containers (IBC's)
- 7.2.6. Other Product Types
- 7.3. Market Analysis, Insights and Forecast - by Application
- 7.3.1. Automotive
- 7.3.2. Food and Beverages
- 7.3.3. Consumer Goods
- 7.3.4. Industrial
- 7.3.5. Others
- 7.1. Market Analysis, Insights and Forecast - by Material
- 8. Europe Returnable Transit Packaging Industry Analysis, Insights and Forecast, 2020-2032
- 8.1. Market Analysis, Insights and Forecast - by Material
- 8.1.1. Plastic
- 8.1.2. Metal
- 8.1.3. Wood
- 8.2. Market Analysis, Insights and Forecast - by Product
- 8.2.1. Containers
- 8.2.2. Drums & Barrels
- 8.2.3. Pallets
- 8.2.4. Crates, Totes, Trays & Bins
- 8.2.5. Intermediate Bulk Containers (IBC's)
- 8.2.6. Other Product Types
- 8.3. Market Analysis, Insights and Forecast - by Application
- 8.3.1. Automotive
- 8.3.2. Food and Beverages
- 8.3.3. Consumer Goods
- 8.3.4. Industrial
- 8.3.5. Others
- 8.1. Market Analysis, Insights and Forecast - by Material
- 9. Asia Pacific Returnable Transit Packaging Industry Analysis, Insights and Forecast, 2020-2032
- 9.1. Market Analysis, Insights and Forecast - by Material
- 9.1.1. Plastic
- 9.1.2. Metal
- 9.1.3. Wood
- 9.2. Market Analysis, Insights and Forecast - by Product
- 9.2.1. Containers
- 9.2.2. Drums & Barrels
- 9.2.3. Pallets
- 9.2.4. Crates, Totes, Trays & Bins
- 9.2.5. Intermediate Bulk Containers (IBC's)
- 9.2.6. Other Product Types
- 9.3. Market Analysis, Insights and Forecast - by Application
- 9.3.1. Automotive
- 9.3.2. Food and Beverages
- 9.3.3. Consumer Goods
- 9.3.4. Industrial
- 9.3.5. Others
- 9.1. Market Analysis, Insights and Forecast - by Material
- 10. Latin America Returnable Transit Packaging Industry Analysis, Insights and Forecast, 2020-2032
- 10.1. Market Analysis, Insights and Forecast - by Material
- 10.1.1. Plastic
- 10.1.2. Metal
- 10.1.3. Wood
- 10.2. Market Analysis, Insights and Forecast - by Product
- 10.2.1. Containers
- 10.2.2. Drums & Barrels
- 10.2.3. Pallets
- 10.2.4. Crates, Totes, Trays & Bins
- 10.2.5. Intermediate Bulk Containers (IBC's)
- 10.2.6. Other Product Types
- 10.3. Market Analysis, Insights and Forecast - by Application
- 10.3.1. Automotive
- 10.3.2. Food and Beverages
- 10.3.3. Consumer Goods
- 10.3.4. Industrial
- 10.3.5. Others
- 10.1. Market Analysis, Insights and Forecast - by Material
- 11. Middle East and Africa Returnable Transit Packaging Industry Analysis, Insights and Forecast, 2020-2032
- 11.1. Market Analysis, Insights and Forecast - by Material
- 11.1.1. Plastic
- 11.1.2. Metal
- 11.1.3. Wood
- 11.2. Market Analysis, Insights and Forecast - by Product
- 11.2.1. Containers
- 11.2.2. Drums & Barrels
- 11.2.3. Pallets
- 11.2.4. Crates, Totes, Trays & Bins
- 11.2.5. Intermediate Bulk Containers (IBC's)
- 11.2.6. Other Product Types
- 11.3. Market Analysis, Insights and Forecast - by Application
- 11.3.1. Automotive
- 11.3.2. Food and Beverages
- 11.3.3. Consumer Goods
- 11.3.4. Industrial
- 11.3.5. Others
- 11.1. Market Analysis, Insights and Forecast - by Material
- 12. Competitive Analysis
- 12.1. Company Profiles
- 12.1.1 Polymer Logistics NV
- 12.1.1.1. Company Overview
- 12.1.1.2. Products
- 12.1.1.3. Company Financials
- 12.1.1.4. SWOT Analysis
- 12.1.2 SSI Schaefer Group
- 12.1.2.1. Company Overview
- 12.1.2.2. Products
- 12.1.2.3. Company Financials
- 12.1.2.4. SWOT Analysis
- 12.1.3 Rehrig Pacific Company
- 12.1.3.1. Company Overview
- 12.1.3.2. Products
- 12.1.3.3. Company Financials
- 12.1.3.4. SWOT Analysis
- 12.1.4 CSI Sertapak Inc
- 12.1.4.1. Company Overview
- 12.1.4.2. Products
- 12.1.4.3. Company Financials
- 12.1.4.4. SWOT Analysis
- 12.1.5 Schoeller Allibert Group BV
- 12.1.5.1. Company Overview
- 12.1.5.2. Products
- 12.1.5.3. Company Financials
- 12.1.5.4. SWOT Analysis
- 12.1.6 Nefab AB
- 12.1.6.1. Company Overview
- 12.1.6.2. Products
- 12.1.6.3. Company Financials
- 12.1.6.4. SWOT Analysis
- 12.1.7 IFCO Systems
- 12.1.7.1. Company Overview
- 12.1.7.2. Products
- 12.1.7.3. Company Financials
- 12.1.7.4. SWOT Analysis
- 12.1.8 Mugele Group
- 12.1.8.1. Company Overview
- 12.1.8.2. Products
- 12.1.8.3. Company Financials
- 12.1.8.4. SWOT Analysis
- 12.1.9 Lamar Packaging Systems
- 12.1.9.1. Company Overview
- 12.1.9.2. Products
- 12.1.9.3. Company Financials
- 12.1.9.4. SWOT Analysis
- 12.1.10 Brambles Limited (CHEP
- 12.1.10.1. Company Overview
- 12.1.10.2. Products
- 12.1.10.3. Company Financials
- 12.1.10.4. SWOT Analysis
- 12.1.11 Orbis Corporation
- 12.1.11.1. Company Overview
- 12.1.11.2. Products
- 12.1.11.3. Company Financials
- 12.1.11.4. SWOT Analysis
- 12.1.1 Polymer Logistics NV
- 12.2. Market Entropy
- 12.2.1 Company's Key Areas Served
- 12.2.2 Recent Developments
- 12.3. Company Market Share Analysis 2025
- 12.3.1 Top 5 Companies Market Share Analysis
- 12.3.2 Top 3 Companies Market Share Analysis
- 12.4. List of Potential Customers
- 13. Research Methodology
List of Figures
- Figure 1: Global Returnable Transit Packaging Industry Revenue Breakdown (billion, %) by Region 2025 & 2033
- Figure 2: North America Returnable Transit Packaging Industry Revenue (billion), by Material 2025 & 2033
- Figure 3: North America Returnable Transit Packaging Industry Revenue Share (%), by Material 2025 & 2033
- Figure 4: North America Returnable Transit Packaging Industry Revenue (billion), by Product 2025 & 2033
- Figure 5: North America Returnable Transit Packaging Industry Revenue Share (%), by Product 2025 & 2033
- Figure 6: North America Returnable Transit Packaging Industry Revenue (billion), by Application 2025 & 2033
- Figure 7: North America Returnable Transit Packaging Industry Revenue Share (%), by Application 2025 & 2033
- Figure 8: North America Returnable Transit Packaging Industry Revenue (billion), by Country 2025 & 2033
- Figure 9: North America Returnable Transit Packaging Industry Revenue Share (%), by Country 2025 & 2033
- Figure 10: Europe Returnable Transit Packaging Industry Revenue (billion), by Material 2025 & 2033
- Figure 11: Europe Returnable Transit Packaging Industry Revenue Share (%), by Material 2025 & 2033
- Figure 12: Europe Returnable Transit Packaging Industry Revenue (billion), by Product 2025 & 2033
- Figure 13: Europe Returnable Transit Packaging Industry Revenue Share (%), by Product 2025 & 2033
- Figure 14: Europe Returnable Transit Packaging Industry Revenue (billion), by Application 2025 & 2033
- Figure 15: Europe Returnable Transit Packaging Industry Revenue Share (%), by Application 2025 & 2033
- Figure 16: Europe Returnable Transit Packaging Industry Revenue (billion), by Country 2025 & 2033
- Figure 17: Europe Returnable Transit Packaging Industry Revenue Share (%), by Country 2025 & 2033
- Figure 18: Asia Pacific Returnable Transit Packaging Industry Revenue (billion), by Material 2025 & 2033
- Figure 19: Asia Pacific Returnable Transit Packaging Industry Revenue Share (%), by Material 2025 & 2033
- Figure 20: Asia Pacific Returnable Transit Packaging Industry Revenue (billion), by Product 2025 & 2033
- Figure 21: Asia Pacific Returnable Transit Packaging Industry Revenue Share (%), by Product 2025 & 2033
- Figure 22: Asia Pacific Returnable Transit Packaging Industry Revenue (billion), by Application 2025 & 2033
- Figure 23: Asia Pacific Returnable Transit Packaging Industry Revenue Share (%), by Application 2025 & 2033
- Figure 24: Asia Pacific Returnable Transit Packaging Industry Revenue (billion), by Country 2025 & 2033
- Figure 25: Asia Pacific Returnable Transit Packaging Industry Revenue Share (%), by Country 2025 & 2033
- Figure 26: Latin America Returnable Transit Packaging Industry Revenue (billion), by Material 2025 & 2033
- Figure 27: Latin America Returnable Transit Packaging Industry Revenue Share (%), by Material 2025 & 2033
- Figure 28: Latin America Returnable Transit Packaging Industry Revenue (billion), by Product 2025 & 2033
- Figure 29: Latin America Returnable Transit Packaging Industry Revenue Share (%), by Product 2025 & 2033
- Figure 30: Latin America Returnable Transit Packaging Industry Revenue (billion), by Application 2025 & 2033
- Figure 31: Latin America Returnable Transit Packaging Industry Revenue Share (%), by Application 2025 & 2033
- Figure 32: Latin America Returnable Transit Packaging Industry Revenue (billion), by Country 2025 & 2033
- Figure 33: Latin America Returnable Transit Packaging Industry Revenue Share (%), by Country 2025 & 2033
- Figure 34: Middle East and Africa Returnable Transit Packaging Industry Revenue (billion), by Material 2025 & 2033
- Figure 35: Middle East and Africa Returnable Transit Packaging Industry Revenue Share (%), by Material 2025 & 2033
- Figure 36: Middle East and Africa Returnable Transit Packaging Industry Revenue (billion), by Product 2025 & 2033
- Figure 37: Middle East and Africa Returnable Transit Packaging Industry Revenue Share (%), by Product 2025 & 2033
- Figure 38: Middle East and Africa Returnable Transit Packaging Industry Revenue (billion), by Application 2025 & 2033
- Figure 39: Middle East and Africa Returnable Transit Packaging Industry Revenue Share (%), by Application 2025 & 2033
- Figure 40: Middle East and Africa Returnable Transit Packaging Industry Revenue (billion), by Country 2025 & 2033
- Figure 41: Middle East and Africa Returnable Transit Packaging Industry Revenue Share (%), by Country 2025 & 2033
List of Tables
- Table 1: Global Returnable Transit Packaging Industry Revenue billion Forecast, by Material 2020 & 2033
- Table 2: Global Returnable Transit Packaging Industry Revenue billion Forecast, by Product 2020 & 2033
- Table 3: Global Returnable Transit Packaging Industry Revenue billion Forecast, by Application 2020 & 2033
- Table 4: Global Returnable Transit Packaging Industry Revenue billion Forecast, by Region 2020 & 2033
- Table 5: Global Returnable Transit Packaging Industry Revenue billion Forecast, by Material 2020 & 2033
- Table 6: Global Returnable Transit Packaging Industry Revenue billion Forecast, by Product 2020 & 2033
- Table 7: Global Returnable Transit Packaging Industry Revenue billion Forecast, by Application 2020 & 2033
- Table 8: Global Returnable Transit Packaging Industry Revenue billion Forecast, by Country 2020 & 2033
- Table 9: Global Returnable Transit Packaging Industry Revenue billion Forecast, by Material 2020 & 2033
- Table 10: Global Returnable Transit Packaging Industry Revenue billion Forecast, by Product 2020 & 2033
- Table 11: Global Returnable Transit Packaging Industry Revenue billion Forecast, by Application 2020 & 2033
- Table 12: Global Returnable Transit Packaging Industry Revenue billion Forecast, by Country 2020 & 2033
- Table 13: Global Returnable Transit Packaging Industry Revenue billion Forecast, by Material 2020 & 2033
- Table 14: Global Returnable Transit Packaging Industry Revenue billion Forecast, by Product 2020 & 2033
- Table 15: Global Returnable Transit Packaging Industry Revenue billion Forecast, by Application 2020 & 2033
- Table 16: Global Returnable Transit Packaging Industry Revenue billion Forecast, by Country 2020 & 2033
- Table 17: Global Returnable Transit Packaging Industry Revenue billion Forecast, by Material 2020 & 2033
- Table 18: Global Returnable Transit Packaging Industry Revenue billion Forecast, by Product 2020 & 2033
- Table 19: Global Returnable Transit Packaging Industry Revenue billion Forecast, by Application 2020 & 2033
- Table 20: Global Returnable Transit Packaging Industry Revenue billion Forecast, by Country 2020 & 2033
- Table 21: Global Returnable Transit Packaging Industry Revenue billion Forecast, by Material 2020 & 2033
- Table 22: Global Returnable Transit Packaging Industry Revenue billion Forecast, by Product 2020 & 2033
- Table 23: Global Returnable Transit Packaging Industry Revenue billion Forecast, by Application 2020 & 2033
- Table 24: Global Returnable Transit Packaging Industry Revenue billion Forecast, by Country 2020 & 2033
Frequently Asked Questions
1. What is the projected Compound Annual Growth Rate (CAGR) of the Returnable Transit Packaging Industry?
The projected CAGR is approximately 7.19%.
2. Which companies are prominent players in the Returnable Transit Packaging Industry?
Key companies in the market include Polymer Logistics NV, SSI Schaefer Group, Rehrig Pacific Company, CSI Sertapak Inc, Schoeller Allibert Group BV, Nefab AB, IFCO Systems, Mugele Group, Lamar Packaging Systems, Brambles Limited (CHEP, Orbis Corporation.
3. What are the main segments of the Returnable Transit Packaging Industry?
The market segments include Material, Product, Application.
4. Can you provide details about the market size?
The market size is estimated to be USD 257.7 billion as of 2022.
5. What are some drivers contributing to market growth?
; Demand for RTP from F&B. and Textile Industries; Stringent Government Regulations by the Government.
6. What are the notable trends driving market growth?
Drums and Barrels to Witness Significant Market Growth.
7. Are there any restraints impacting market growth?
; High Initial Costs to Setup and Buying all Kinds of Matericals.
8. Can you provide examples of recent developments in the market?
N/A
9. What pricing options are available for accessing the report?
Pricing options include single-user, multi-user, and enterprise licenses priced at USD 4750, USD 5250, and USD 8750 respectively.
10. Is the market size provided in terms of value or volume?
The market size is provided in terms of value, measured in billion.
11. Are there any specific market keywords associated with the report?
Yes, the market keyword associated with the report is "Returnable Transit Packaging Industry," which aids in identifying and referencing the specific market segment covered.
12. How do I determine which pricing option suits my needs best?
The pricing options vary based on user requirements and access needs. Individual users may opt for single-user licenses, while businesses requiring broader access may choose multi-user or enterprise licenses for cost-effective access to the report.
13. Are there any additional resources or data provided in the Returnable Transit Packaging Industry report?
While the report offers comprehensive insights, it's advisable to review the specific contents or supplementary materials provided to ascertain if additional resources or data are available.
14. How can I stay updated on further developments or reports in the Returnable Transit Packaging Industry?
To stay informed about further developments, trends, and reports in the Returnable Transit Packaging Industry, consider subscribing to industry newsletters, following relevant companies and organizations, or regularly checking reputable industry news sources and publications.
Methodology
Step 1 - Identification of Relevant Samples Size from Population Database


Step 2 - Approaches for Defining Global Market Size (Value, Volume* & Price*)

Note*: In applicable scenarios
Step 3 - Data Sources
Primary Research
- Web Analytics
- Survey Reports
- Research Institute
- Latest Research Reports
- Opinion Leaders
Secondary Research
- Annual Reports
- White Paper
- Latest Press Release
- Industry Association
- Paid Database
- Investor Presentations

Step 4 - Data Triangulation
Involves using different sources of information in order to increase the validity of a study
These sources are likely to be stakeholders in a program - participants, other researchers, program staff, other community members, and so on.
Then we put all data in single framework & apply various statistical tools to find out the dynamic on the market.
During the analysis stage, feedback from the stakeholder groups would be compared to determine areas of agreement as well as areas of divergence