

Key Insights
The US pharmaceutical caps and closures market demonstrates substantial growth potential, aligning with the global CAGR of 4.20%. The robust US pharmaceutical sector, with its escalating demand for secure and effective drug packaging, supports an estimated US market growth rate of at least 4.6%. Key growth drivers include the increasing prevalence of chronic diseases, stringent regulatory mandates for tamper-evident and child-resistant closures, and the adoption of advanced packaging technologies such as induction sealing and blister packs. These innovations enhance drug efficacy and combat counterfeiting. Market segmentation reveals strong demand across diverse pharmaceutical applications, particularly for specialized closures for injectable drugs. The competitive landscape features major global players like Aptar Group and Amcor, alongside regional and specialized firms, indicating both established dominance and niche market opportunities. Regional market distribution within the US is expected to correlate with population density and pharmaceutical manufacturing hubs, with the Northeast and West likely representing significant market shares.
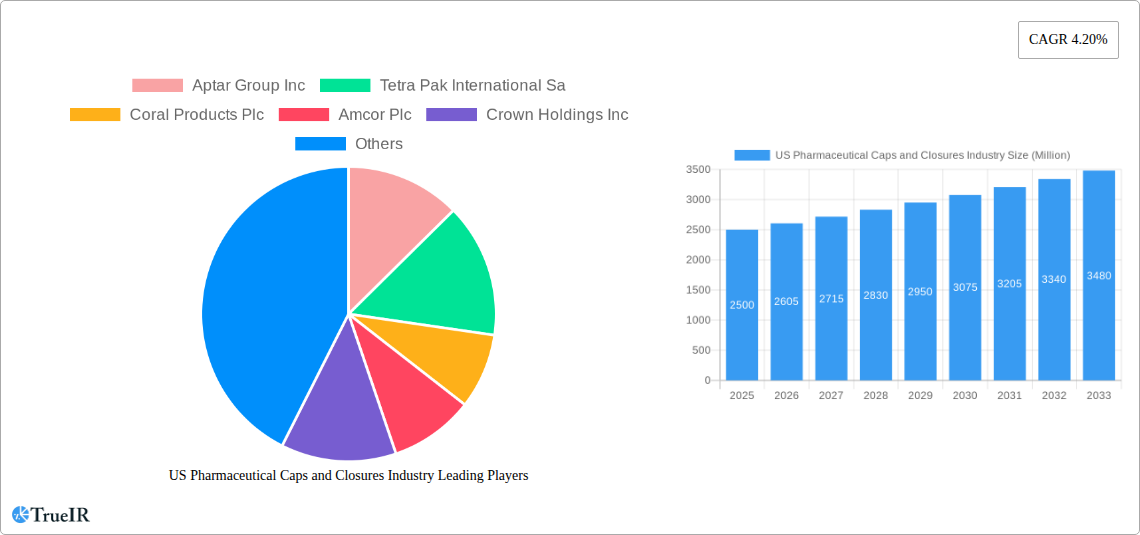
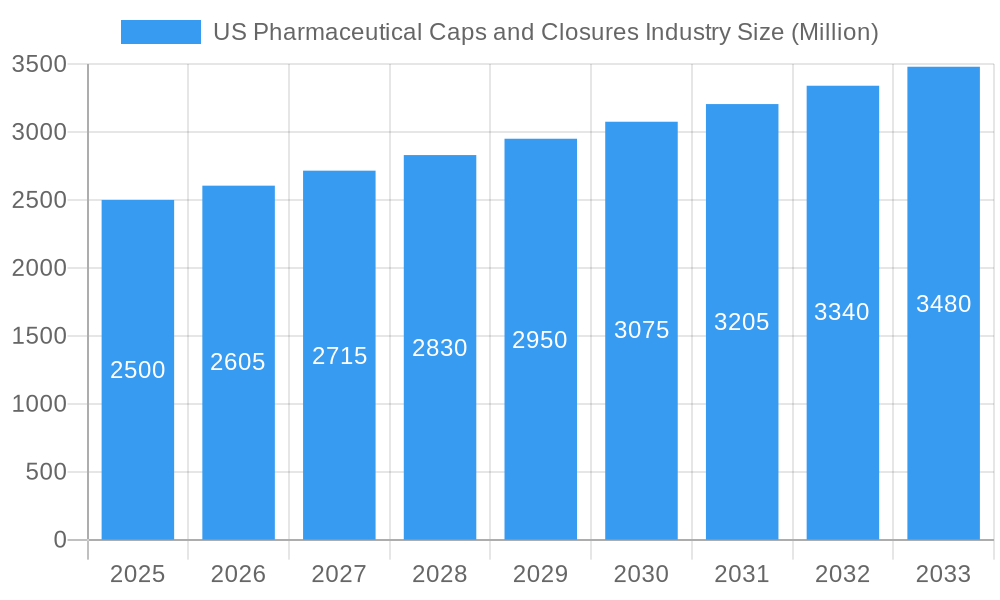
US Pharmaceutical Caps and Closures Industry Market Size (In Billion)
The forecast period of 2025-2033 offers a significant growth window. Strategic investments in R&D for innovative materials and closure designs, prioritizing enhanced security and extended shelf life, are anticipated. The growing emphasis on sustainability within the pharmaceutical industry will drive the adoption of eco-friendly packaging materials, presenting both challenges and opportunities. Companies will focus on supply chain optimization to meet rising demand, regulatory compliance, and efficient product delivery. The competitive landscape is likely to evolve through mergers, acquisitions, and strategic partnerships, particularly in specialized closures for injectables and high-value pharmaceuticals. The estimated market size for the US pharmaceutical caps and closures market in the base year 2025 is 13.3 billion.
US Pharmaceutical Caps and Closures Industry Company Market Share
US Pharmaceutical Caps and Closures Industry Market Report: 2019-2033
This comprehensive report provides a detailed analysis of the US Pharmaceutical Caps and Closures industry, offering valuable insights into market dynamics, competitive landscapes, and future growth prospects. With a study period spanning 2019-2033, a base year of 2025, and a forecast period of 2025-2033, this report is an indispensable resource for industry stakeholders, investors, and strategic decision-makers. The report leverages extensive data analysis and expert insights to provide a holistic view of this dynamic market, projected to reach xx Million by 2033.
US Pharmaceutical Caps and Closures Industry Market Structure & Competitive Landscape
The US pharmaceutical caps and closures market exhibits a moderately consolidated structure, with several key players dominating significant market share. Concentration ratios, while varying across segments, indicate a trend towards increased consolidation through mergers and acquisitions (M&A). The market's competitive landscape is characterized by intense rivalry, driven by innovation in materials, design, and functionality. Regulatory compliance is a paramount concern, significantly impacting market dynamics. Stringent quality standards and safety regulations necessitate substantial investments in R&D and manufacturing capabilities. Product substitution, although limited, is influenced by advancements in alternative packaging materials and closure technologies.
- Market Concentration: The Herfindahl-Hirschman Index (HHI) is estimated at xx, indicating a moderately concentrated market.
- M&A Activity: The historical period (2019-2024) witnessed approximately xx M&A transactions, with an average deal value of xx Million.
- Innovation Drivers: Demand for tamper-evident closures, child-resistant caps, and sustainable packaging solutions fuels innovation.
- Regulatory Impacts: FDA regulations and GMP compliance exert significant pressure on manufacturers, impacting costs and operational efficiency.
- End-User Segmentation: The pharmaceutical segment dominates the market, followed by healthcare and cosmetics.
- Key Players: Aptar Group Inc, Tetra Pak International Sa, Coral Products Plc, Amcor Plc, Crown Holdings Inc, O Berk Company Llc, Bericap Holdings, Silgan Closures, MJS Packaging, Albéa S A, Berry Global Inc, Closure Systems International.
US Pharmaceutical Caps and Closures Industry Market Trends & Opportunities
The US pharmaceutical caps and closures market is experiencing robust growth, driven by increasing pharmaceutical production, rising healthcare expenditure, and the growing demand for convenient and safe packaging solutions. Technological advancements, such as the adoption of smart packaging and improved sealing technologies, are creating new market opportunities. Consumer preferences are shifting towards sustainable and eco-friendly packaging, presenting both challenges and opportunities for manufacturers. The competitive landscape is marked by a push towards product differentiation through enhanced functionality, improved aesthetics, and superior performance. The market is expected to witness a Compound Annual Growth Rate (CAGR) of xx% during the forecast period (2025-2033), with significant market penetration anticipated in niche segments. The increasing adoption of single-dose packaging and pre-filled syringes fuels substantial demand, contributing to the overall market expansion. Market penetration rates are projected to increase from xx% in 2025 to xx% by 2033, demonstrating a significant shift in market dynamics and adoption of innovative packaging solutions.
Dominant Markets & Segments in US Pharmaceutical Caps and Closures Industry
The pharmaceutical and healthcare segment represents the largest end-user industry for caps and closures in the US, accounting for approximately xx Million in revenue in 2025. Within material types, plastic dominates, fueled by its cost-effectiveness and versatility.
Key Growth Drivers in Pharmaceutical & Healthcare Segment:
- Rising pharmaceutical production and drug development.
- Stringent regulatory requirements for safe and tamper-evident packaging.
- Increasing demand for single-dose and pre-filled syringe packaging.
- Growing preference for convenient and user-friendly packaging solutions.
Market Dominance Analysis: The dominance of the pharmaceutical segment stems from the stringent regulatory requirements for drug packaging and the crucial role of caps and closures in ensuring product safety and integrity. The Plastic material type's dominance is driven by its cost-effectiveness, ease of manufacturing, and ability to be molded into various shapes and sizes.
US Pharmaceutical Caps and Closures Industry Product Analysis
Product innovation is a key driver within this market, with a strong focus on developing sustainable, tamper-evident, and child-resistant closures. Advancements in material science and manufacturing processes are leading to the development of high-performance closures with improved sealing properties and extended shelf life. These innovations enhance product safety and extend product shelf life, providing significant competitive advantages. The market is witnessing a notable shift toward sustainable and eco-friendly packaging solutions, reflecting increasing consumer and regulatory pressure.
Key Drivers, Barriers & Challenges in US Pharmaceutical Caps and Closures Industry
Key Drivers: Technological advancements (e.g., smart packaging, improved sealing technologies), increasing demand from the pharmaceutical and healthcare sectors, rising healthcare expenditure, and stringent regulatory requirements driving the adoption of safer and more secure packaging solutions.
Challenges: Fluctuating raw material prices, supply chain disruptions, stringent regulatory compliance requirements imposing significant costs on manufacturers, and intense competition resulting in pricing pressures. Supply chain disruptions have resulted in xx% increase in production costs in 2024, impacting profitability.
Growth Drivers in the US Pharmaceutical Caps and Closures Industry Market
The pharmaceutical industry's robust growth, escalating healthcare spending, and heightened demand for tamper-evident and child-resistant packaging fuel market expansion. Technological progress leads to innovative, sustainable, and cost-effective solutions further stimulating growth. Stringent government regulations emphasizing product safety also contribute to the market's positive trajectory.
Challenges Impacting US Pharmaceutical Caps and Closures Industry Growth
Regulatory complexities, raw material price fluctuations, supply chain vulnerabilities, and intense competition create obstacles to industry growth. These factors impose constraints on production costs, margins, and overall market expansion, necessitating strategic adaptations and investment in efficient supply chain management.
Key Players Shaping the US Pharmaceutical Caps and Closures Industry Market
- Aptar Group Inc
- Tetra Pak International Sa
- Coral Products Plc
- Amcor Plc
- Crown Holdings Inc
- O Berk Company Llc
- Bericap Holdings
- Silgan Closures
- MJS Packaging
- Albéa S A
- Berry Global Inc
- Closure Systems International
Significant US Pharmaceutical Caps and Closures Industry Industry Milestones
- 2020, Q4: Increased demand for tamper-evident closures due to heightened security concerns.
- 2021, Q1: Several major players announced investments in sustainable packaging solutions.
- 2022, Q3: Significant M&A activity, consolidating market share among key players.
- 2023, Q2: Introduction of innovative child-resistant caps with improved designs.
Future Outlook for US Pharmaceutical Caps and Closures Industry Market
The US pharmaceutical caps and closures market is poised for sustained growth, driven by technological advancements, increasing demand for sustainable packaging, and the rising healthcare expenditure. Strategic partnerships, acquisitions, and investments in R&D will be critical factors shaping future market dynamics. Opportunities exist in developing innovative closure technologies, catering to specific pharmaceutical needs, and focusing on sustainable materials to meet growing environmental concerns. The market is expected to continue its upward trajectory, driven by the key factors discussed above, with significant potential for further expansion in the coming years.
US Pharmaceutical Caps and Closures Industry Segmentation
-
1. Material Type
-
1.1. Plastic
- 1.1.1. PET
- 1.1.2. PP
- 1.1.3. HDPE and LDPE
- 1.1.4. Other Plastics
- 1.2. Metal
- 1.3. Other Material Types
-
1.1. Plastic
-
2. End-User Industry
- 2.1. Beverage
- 2.2. Food
- 2.3. Pharmaceutical and Healthcare
- 2.4. Cosmetics and Toiletries
- 2.5. Other En
US Pharmaceutical Caps and Closures Industry Segmentation By Geography
-
1. North America
- 1.1. United States
- 1.2. Canada
- 1.3. Mexico
-
2. South America
- 2.1. Brazil
- 2.2. Argentina
- 2.3. Rest of South America
-
3. Europe
- 3.1. United Kingdom
- 3.2. Germany
- 3.3. France
- 3.4. Italy
- 3.5. Spain
- 3.6. Russia
- 3.7. Benelux
- 3.8. Nordics
- 3.9. Rest of Europe
-
4. Middle East & Africa
- 4.1. Turkey
- 4.2. Israel
- 4.3. GCC
- 4.4. North Africa
- 4.5. South Africa
- 4.6. Rest of Middle East & Africa
-
5. Asia Pacific
- 5.1. China
- 5.2. India
- 5.3. Japan
- 5.4. South Korea
- 5.5. ASEAN
- 5.6. Oceania
- 5.7. Rest of Asia Pacific
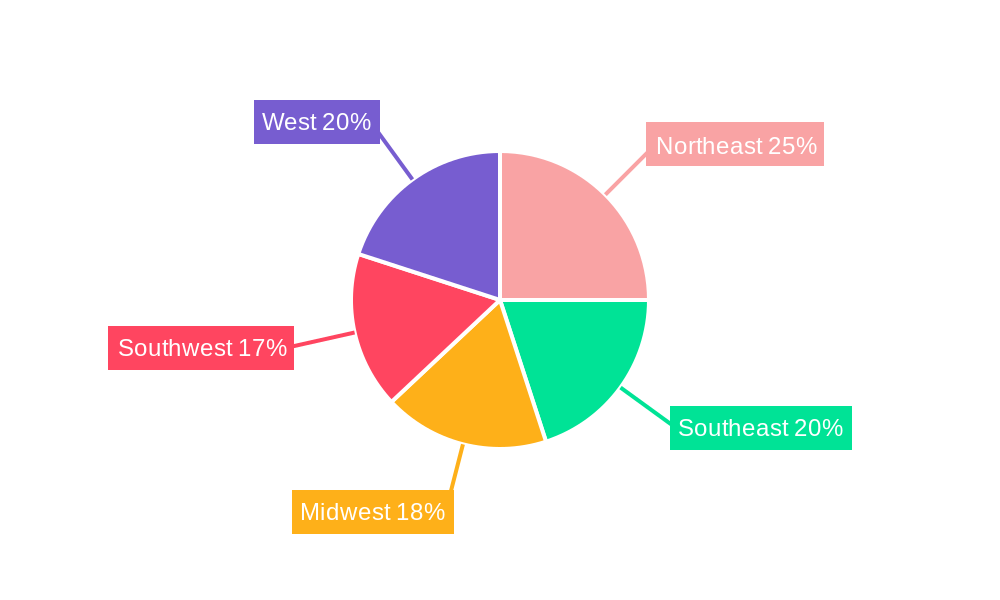
US Pharmaceutical Caps and Closures Industry Regional Market Share
Geographic Coverage of US Pharmaceutical Caps and Closures Industry
US Pharmaceutical Caps and Closures Industry REPORT HIGHLIGHTS
| Aspects | Details |
|---|---|
| Study Period | 2020-2034 |
| Base Year | 2025 |
| Estimated Year | 2026 |
| Forecast Period | 2026-2034 |
| Historical Period | 2020-2025 |
| Growth Rate | CAGR of 4.6% from 2020-2034 |
| Segmentation |
|
Table of Contents
- 1. Introduction
- 1.1. Research Scope
- 1.2. Market Segmentation
- 1.3. Research Objective
- 1.4. Definitions and Assumptions
- 2. Executive Summary
- 2.1. Market Snapshot
- 3. Market Dynamics
- 3.1. Market Drivers
- 3.2. Market Restrains
- 3.3. Market Trends
- 3.4. Market Opportunities
- 4. Market Factor Analysis
- 4.1. Porters Five Forces
- 4.1.1. Bargaining Power of Suppliers
- 4.1.2. Bargaining Power of Buyers
- 4.1.3. Threat of New Entrants
- 4.1.4. Threat of Substitutes
- 4.1.5. Competitive Rivalry
- 4.2. PESTEL analysis
- 4.3. BCG Analysis
- 4.3.1. Stars (High Growth, High Market Share)
- 4.3.2. Cash Cows (Low Growth, High Market Share)
- 4.3.3. Question Mark (High Growth, Low Market Share)
- 4.3.4. Dogs (Low Growth, Low Market Share)
- 4.4. Ansoff Matrix Analysis
- 4.5. Supply Chain Analysis
- 4.6. Regulatory Landscape
- 4.7. Current Market Potential and Opportunity Assessment (TAM–SAM–SOM Framework)
- 4.8. TIR Analyst Note
- 4.1. Porters Five Forces
- 5. Market Analysis, Insights and Forecast 2021-2033
- 5.1. Market Analysis, Insights and Forecast - by Material Type
- 5.1.1. Plastic
- 5.1.1.1. PET
- 5.1.1.2. PP
- 5.1.1.3. HDPE and LDPE
- 5.1.1.4. Other Plastics
- 5.1.2. Metal
- 5.1.3. Other Material Types
- 5.1.1. Plastic
- 5.2. Market Analysis, Insights and Forecast - by End-User Industry
- 5.2.1. Beverage
- 5.2.2. Food
- 5.2.3. Pharmaceutical and Healthcare
- 5.2.4. Cosmetics and Toiletries
- 5.2.5. Other En
- 5.3. Market Analysis, Insights and Forecast - by Region
- 5.3.1. North America
- 5.3.2. South America
- 5.3.3. Europe
- 5.3.4. Middle East & Africa
- 5.3.5. Asia Pacific
- 5.1. Market Analysis, Insights and Forecast - by Material Type
- 6. Global US Pharmaceutical Caps and Closures Industry Analysis, Insights and Forecast, 2021-2033
- 6.1. Market Analysis, Insights and Forecast - by Material Type
- 6.1.1. Plastic
- 6.1.1.1. PET
- 6.1.1.2. PP
- 6.1.1.3. HDPE and LDPE
- 6.1.1.4. Other Plastics
- 6.1.2. Metal
- 6.1.3. Other Material Types
- 6.1.1. Plastic
- 6.2. Market Analysis, Insights and Forecast - by End-User Industry
- 6.2.1. Beverage
- 6.2.2. Food
- 6.2.3. Pharmaceutical and Healthcare
- 6.2.4. Cosmetics and Toiletries
- 6.2.5. Other En
- 6.1. Market Analysis, Insights and Forecast - by Material Type
- 7. North America US Pharmaceutical Caps and Closures Industry Analysis, Insights and Forecast, 2020-2032
- 7.1. Market Analysis, Insights and Forecast - by Material Type
- 7.1.1. Plastic
- 7.1.1.1. PET
- 7.1.1.2. PP
- 7.1.1.3. HDPE and LDPE
- 7.1.1.4. Other Plastics
- 7.1.2. Metal
- 7.1.3. Other Material Types
- 7.1.1. Plastic
- 7.2. Market Analysis, Insights and Forecast - by End-User Industry
- 7.2.1. Beverage
- 7.2.2. Food
- 7.2.3. Pharmaceutical and Healthcare
- 7.2.4. Cosmetics and Toiletries
- 7.2.5. Other En
- 7.1. Market Analysis, Insights and Forecast - by Material Type
- 8. South America US Pharmaceutical Caps and Closures Industry Analysis, Insights and Forecast, 2020-2032
- 8.1. Market Analysis, Insights and Forecast - by Material Type
- 8.1.1. Plastic
- 8.1.1.1. PET
- 8.1.1.2. PP
- 8.1.1.3. HDPE and LDPE
- 8.1.1.4. Other Plastics
- 8.1.2. Metal
- 8.1.3. Other Material Types
- 8.1.1. Plastic
- 8.2. Market Analysis, Insights and Forecast - by End-User Industry
- 8.2.1. Beverage
- 8.2.2. Food
- 8.2.3. Pharmaceutical and Healthcare
- 8.2.4. Cosmetics and Toiletries
- 8.2.5. Other En
- 8.1. Market Analysis, Insights and Forecast - by Material Type
- 9. Europe US Pharmaceutical Caps and Closures Industry Analysis, Insights and Forecast, 2020-2032
- 9.1. Market Analysis, Insights and Forecast - by Material Type
- 9.1.1. Plastic
- 9.1.1.1. PET
- 9.1.1.2. PP
- 9.1.1.3. HDPE and LDPE
- 9.1.1.4. Other Plastics
- 9.1.2. Metal
- 9.1.3. Other Material Types
- 9.1.1. Plastic
- 9.2. Market Analysis, Insights and Forecast - by End-User Industry
- 9.2.1. Beverage
- 9.2.2. Food
- 9.2.3. Pharmaceutical and Healthcare
- 9.2.4. Cosmetics and Toiletries
- 9.2.5. Other En
- 9.1. Market Analysis, Insights and Forecast - by Material Type
- 10. Middle East & Africa US Pharmaceutical Caps and Closures Industry Analysis, Insights and Forecast, 2020-2032
- 10.1. Market Analysis, Insights and Forecast - by Material Type
- 10.1.1. Plastic
- 10.1.1.1. PET
- 10.1.1.2. PP
- 10.1.1.3. HDPE and LDPE
- 10.1.1.4. Other Plastics
- 10.1.2. Metal
- 10.1.3. Other Material Types
- 10.1.1. Plastic
- 10.2. Market Analysis, Insights and Forecast - by End-User Industry
- 10.2.1. Beverage
- 10.2.2. Food
- 10.2.3. Pharmaceutical and Healthcare
- 10.2.4. Cosmetics and Toiletries
- 10.2.5. Other En
- 10.1. Market Analysis, Insights and Forecast - by Material Type
- 11. Asia Pacific US Pharmaceutical Caps and Closures Industry Analysis, Insights and Forecast, 2020-2032
- 11.1. Market Analysis, Insights and Forecast - by Material Type
- 11.1.1. Plastic
- 11.1.1.1. PET
- 11.1.1.2. PP
- 11.1.1.3. HDPE and LDPE
- 11.1.1.4. Other Plastics
- 11.1.2. Metal
- 11.1.3. Other Material Types
- 11.1.1. Plastic
- 11.2. Market Analysis, Insights and Forecast - by End-User Industry
- 11.2.1. Beverage
- 11.2.2. Food
- 11.2.3. Pharmaceutical and Healthcare
- 11.2.4. Cosmetics and Toiletries
- 11.2.5. Other En
- 11.1. Market Analysis, Insights and Forecast - by Material Type
- 12. Competitive Analysis
- 12.1. Company Profiles
- 12.1.1 Aptar Group Inc
- 12.1.1.1. Company Overview
- 12.1.1.2. Products
- 12.1.1.3. Company Financials
- 12.1.1.4. SWOT Analysis
- 12.1.2 Tetra Pak International Sa
- 12.1.2.1. Company Overview
- 12.1.2.2. Products
- 12.1.2.3. Company Financials
- 12.1.2.4. SWOT Analysis
- 12.1.3 Coral Products Plc
- 12.1.3.1. Company Overview
- 12.1.3.2. Products
- 12.1.3.3. Company Financials
- 12.1.3.4. SWOT Analysis
- 12.1.4 Amcor Plc
- 12.1.4.1. Company Overview
- 12.1.4.2. Products
- 12.1.4.3. Company Financials
- 12.1.4.4. SWOT Analysis
- 12.1.5 Crown Holdings Inc
- 12.1.5.1. Company Overview
- 12.1.5.2. Products
- 12.1.5.3. Company Financials
- 12.1.5.4. SWOT Analysis
- 12.1.6 O Berk Company Llc*List Not Exhaustive
- 12.1.6.1. Company Overview
- 12.1.6.2. Products
- 12.1.6.3. Company Financials
- 12.1.6.4. SWOT Analysis
- 12.1.7 Bericap Holdings
- 12.1.7.1. Company Overview
- 12.1.7.2. Products
- 12.1.7.3. Company Financials
- 12.1.7.4. SWOT Analysis
- 12.1.8 Silgan Closures
- 12.1.8.1. Company Overview
- 12.1.8.2. Products
- 12.1.8.3. Company Financials
- 12.1.8.4. SWOT Analysis
- 12.1.9 Mjs Packaging
- 12.1.9.1. Company Overview
- 12.1.9.2. Products
- 12.1.9.3. Company Financials
- 12.1.9.4. SWOT Analysis
- 12.1.10 Albéa S A
- 12.1.10.1. Company Overview
- 12.1.10.2. Products
- 12.1.10.3. Company Financials
- 12.1.10.4. SWOT Analysis
- 12.1.11 Berry Global Inc
- 12.1.11.1. Company Overview
- 12.1.11.2. Products
- 12.1.11.3. Company Financials
- 12.1.11.4. SWOT Analysis
- 12.1.12 Closure Systems International
- 12.1.12.1. Company Overview
- 12.1.12.2. Products
- 12.1.12.3. Company Financials
- 12.1.12.4. SWOT Analysis
- 12.1.1 Aptar Group Inc
- 12.2. Market Entropy
- 12.2.1 Company's Key Areas Served
- 12.2.2 Recent Developments
- 12.3. Company Market Share Analysis 2025
- 12.3.1 Top 5 Companies Market Share Analysis
- 12.3.2 Top 3 Companies Market Share Analysis
- 12.4. List of Potential Customers
- 13. Research Methodology
List of Figures
- Figure 1: Global US Pharmaceutical Caps and Closures Industry Revenue Breakdown (billion, %) by Region 2025 & 2033
- Figure 2: North America US Pharmaceutical Caps and Closures Industry Revenue (billion), by Material Type 2025 & 2033
- Figure 3: North America US Pharmaceutical Caps and Closures Industry Revenue Share (%), by Material Type 2025 & 2033
- Figure 4: North America US Pharmaceutical Caps and Closures Industry Revenue (billion), by End-User Industry 2025 & 2033
- Figure 5: North America US Pharmaceutical Caps and Closures Industry Revenue Share (%), by End-User Industry 2025 & 2033
- Figure 6: North America US Pharmaceutical Caps and Closures Industry Revenue (billion), by Country 2025 & 2033
- Figure 7: North America US Pharmaceutical Caps and Closures Industry Revenue Share (%), by Country 2025 & 2033
- Figure 8: South America US Pharmaceutical Caps and Closures Industry Revenue (billion), by Material Type 2025 & 2033
- Figure 9: South America US Pharmaceutical Caps and Closures Industry Revenue Share (%), by Material Type 2025 & 2033
- Figure 10: South America US Pharmaceutical Caps and Closures Industry Revenue (billion), by End-User Industry 2025 & 2033
- Figure 11: South America US Pharmaceutical Caps and Closures Industry Revenue Share (%), by End-User Industry 2025 & 2033
- Figure 12: South America US Pharmaceutical Caps and Closures Industry Revenue (billion), by Country 2025 & 2033
- Figure 13: South America US Pharmaceutical Caps and Closures Industry Revenue Share (%), by Country 2025 & 2033
- Figure 14: Europe US Pharmaceutical Caps and Closures Industry Revenue (billion), by Material Type 2025 & 2033
- Figure 15: Europe US Pharmaceutical Caps and Closures Industry Revenue Share (%), by Material Type 2025 & 2033
- Figure 16: Europe US Pharmaceutical Caps and Closures Industry Revenue (billion), by End-User Industry 2025 & 2033
- Figure 17: Europe US Pharmaceutical Caps and Closures Industry Revenue Share (%), by End-User Industry 2025 & 2033
- Figure 18: Europe US Pharmaceutical Caps and Closures Industry Revenue (billion), by Country 2025 & 2033
- Figure 19: Europe US Pharmaceutical Caps and Closures Industry Revenue Share (%), by Country 2025 & 2033
- Figure 20: Middle East & Africa US Pharmaceutical Caps and Closures Industry Revenue (billion), by Material Type 2025 & 2033
- Figure 21: Middle East & Africa US Pharmaceutical Caps and Closures Industry Revenue Share (%), by Material Type 2025 & 2033
- Figure 22: Middle East & Africa US Pharmaceutical Caps and Closures Industry Revenue (billion), by End-User Industry 2025 & 2033
- Figure 23: Middle East & Africa US Pharmaceutical Caps and Closures Industry Revenue Share (%), by End-User Industry 2025 & 2033
- Figure 24: Middle East & Africa US Pharmaceutical Caps and Closures Industry Revenue (billion), by Country 2025 & 2033
- Figure 25: Middle East & Africa US Pharmaceutical Caps and Closures Industry Revenue Share (%), by Country 2025 & 2033
- Figure 26: Asia Pacific US Pharmaceutical Caps and Closures Industry Revenue (billion), by Material Type 2025 & 2033
- Figure 27: Asia Pacific US Pharmaceutical Caps and Closures Industry Revenue Share (%), by Material Type 2025 & 2033
- Figure 28: Asia Pacific US Pharmaceutical Caps and Closures Industry Revenue (billion), by End-User Industry 2025 & 2033
- Figure 29: Asia Pacific US Pharmaceutical Caps and Closures Industry Revenue Share (%), by End-User Industry 2025 & 2033
- Figure 30: Asia Pacific US Pharmaceutical Caps and Closures Industry Revenue (billion), by Country 2025 & 2033
- Figure 31: Asia Pacific US Pharmaceutical Caps and Closures Industry Revenue Share (%), by Country 2025 & 2033
List of Tables
- Table 1: Global US Pharmaceutical Caps and Closures Industry Revenue billion Forecast, by Material Type 2020 & 2033
- Table 2: Global US Pharmaceutical Caps and Closures Industry Revenue billion Forecast, by End-User Industry 2020 & 2033
- Table 3: Global US Pharmaceutical Caps and Closures Industry Revenue billion Forecast, by Region 2020 & 2033
- Table 4: Global US Pharmaceutical Caps and Closures Industry Revenue billion Forecast, by Material Type 2020 & 2033
- Table 5: Global US Pharmaceutical Caps and Closures Industry Revenue billion Forecast, by End-User Industry 2020 & 2033
- Table 6: Global US Pharmaceutical Caps and Closures Industry Revenue billion Forecast, by Country 2020 & 2033
- Table 7: United States US Pharmaceutical Caps and Closures Industry Revenue (billion) Forecast, by Application 2020 & 2033
- Table 8: Canada US Pharmaceutical Caps and Closures Industry Revenue (billion) Forecast, by Application 2020 & 2033
- Table 9: Mexico US Pharmaceutical Caps and Closures Industry Revenue (billion) Forecast, by Application 2020 & 2033
- Table 10: Global US Pharmaceutical Caps and Closures Industry Revenue billion Forecast, by Material Type 2020 & 2033
- Table 11: Global US Pharmaceutical Caps and Closures Industry Revenue billion Forecast, by End-User Industry 2020 & 2033
- Table 12: Global US Pharmaceutical Caps and Closures Industry Revenue billion Forecast, by Country 2020 & 2033
- Table 13: Brazil US Pharmaceutical Caps and Closures Industry Revenue (billion) Forecast, by Application 2020 & 2033
- Table 14: Argentina US Pharmaceutical Caps and Closures Industry Revenue (billion) Forecast, by Application 2020 & 2033
- Table 15: Rest of South America US Pharmaceutical Caps and Closures Industry Revenue (billion) Forecast, by Application 2020 & 2033
- Table 16: Global US Pharmaceutical Caps and Closures Industry Revenue billion Forecast, by Material Type 2020 & 2033
- Table 17: Global US Pharmaceutical Caps and Closures Industry Revenue billion Forecast, by End-User Industry 2020 & 2033
- Table 18: Global US Pharmaceutical Caps and Closures Industry Revenue billion Forecast, by Country 2020 & 2033
- Table 19: United Kingdom US Pharmaceutical Caps and Closures Industry Revenue (billion) Forecast, by Application 2020 & 2033
- Table 20: Germany US Pharmaceutical Caps and Closures Industry Revenue (billion) Forecast, by Application 2020 & 2033
- Table 21: France US Pharmaceutical Caps and Closures Industry Revenue (billion) Forecast, by Application 2020 & 2033
- Table 22: Italy US Pharmaceutical Caps and Closures Industry Revenue (billion) Forecast, by Application 2020 & 2033
- Table 23: Spain US Pharmaceutical Caps and Closures Industry Revenue (billion) Forecast, by Application 2020 & 2033
- Table 24: Russia US Pharmaceutical Caps and Closures Industry Revenue (billion) Forecast, by Application 2020 & 2033
- Table 25: Benelux US Pharmaceutical Caps and Closures Industry Revenue (billion) Forecast, by Application 2020 & 2033
- Table 26: Nordics US Pharmaceutical Caps and Closures Industry Revenue (billion) Forecast, by Application 2020 & 2033
- Table 27: Rest of Europe US Pharmaceutical Caps and Closures Industry Revenue (billion) Forecast, by Application 2020 & 2033
- Table 28: Global US Pharmaceutical Caps and Closures Industry Revenue billion Forecast, by Material Type 2020 & 2033
- Table 29: Global US Pharmaceutical Caps and Closures Industry Revenue billion Forecast, by End-User Industry 2020 & 2033
- Table 30: Global US Pharmaceutical Caps and Closures Industry Revenue billion Forecast, by Country 2020 & 2033
- Table 31: Turkey US Pharmaceutical Caps and Closures Industry Revenue (billion) Forecast, by Application 2020 & 2033
- Table 32: Israel US Pharmaceutical Caps and Closures Industry Revenue (billion) Forecast, by Application 2020 & 2033
- Table 33: GCC US Pharmaceutical Caps and Closures Industry Revenue (billion) Forecast, by Application 2020 & 2033
- Table 34: North Africa US Pharmaceutical Caps and Closures Industry Revenue (billion) Forecast, by Application 2020 & 2033
- Table 35: South Africa US Pharmaceutical Caps and Closures Industry Revenue (billion) Forecast, by Application 2020 & 2033
- Table 36: Rest of Middle East & Africa US Pharmaceutical Caps and Closures Industry Revenue (billion) Forecast, by Application 2020 & 2033
- Table 37: Global US Pharmaceutical Caps and Closures Industry Revenue billion Forecast, by Material Type 2020 & 2033
- Table 38: Global US Pharmaceutical Caps and Closures Industry Revenue billion Forecast, by End-User Industry 2020 & 2033
- Table 39: Global US Pharmaceutical Caps and Closures Industry Revenue billion Forecast, by Country 2020 & 2033
- Table 40: China US Pharmaceutical Caps and Closures Industry Revenue (billion) Forecast, by Application 2020 & 2033
- Table 41: India US Pharmaceutical Caps and Closures Industry Revenue (billion) Forecast, by Application 2020 & 2033
- Table 42: Japan US Pharmaceutical Caps and Closures Industry Revenue (billion) Forecast, by Application 2020 & 2033
- Table 43: South Korea US Pharmaceutical Caps and Closures Industry Revenue (billion) Forecast, by Application 2020 & 2033
- Table 44: ASEAN US Pharmaceutical Caps and Closures Industry Revenue (billion) Forecast, by Application 2020 & 2033
- Table 45: Oceania US Pharmaceutical Caps and Closures Industry Revenue (billion) Forecast, by Application 2020 & 2033
- Table 46: Rest of Asia Pacific US Pharmaceutical Caps and Closures Industry Revenue (billion) Forecast, by Application 2020 & 2033
Frequently Asked Questions
1. What is the projected Compound Annual Growth Rate (CAGR) of the US Pharmaceutical Caps and Closures Industry?
The projected CAGR is approximately 4.6%.
2. Which companies are prominent players in the US Pharmaceutical Caps and Closures Industry?
Key companies in the market include Aptar Group Inc, Tetra Pak International Sa, Coral Products Plc, Amcor Plc, Crown Holdings Inc, O Berk Company Llc*List Not Exhaustive, Bericap Holdings, Silgan Closures, Mjs Packaging, Albéa S A, Berry Global Inc, Closure Systems International.
3. What are the main segments of the US Pharmaceutical Caps and Closures Industry?
The market segments include Material Type, End-User Industry.
4. Can you provide details about the market size?
The market size is estimated to be USD 13.3 billion as of 2022.
5. What are some drivers contributing to market growth?
; The Increased Demand for Innovative Solutions from Different End Users..
6. What are the notable trends driving market growth?
Plastic to Witness a Highest Growth.
7. Are there any restraints impacting market growth?
; Stringent Regulation on Manufacturers Pertaining to Environmental Degradation.
8. Can you provide examples of recent developments in the market?
N/A
9. What pricing options are available for accessing the report?
Pricing options include single-user, multi-user, and enterprise licenses priced at USD 3800, USD 4500, and USD 5800 respectively.
10. Is the market size provided in terms of value or volume?
The market size is provided in terms of value, measured in billion.
11. Are there any specific market keywords associated with the report?
Yes, the market keyword associated with the report is "US Pharmaceutical Caps and Closures Industry," which aids in identifying and referencing the specific market segment covered.
12. How do I determine which pricing option suits my needs best?
The pricing options vary based on user requirements and access needs. Individual users may opt for single-user licenses, while businesses requiring broader access may choose multi-user or enterprise licenses for cost-effective access to the report.
13. Are there any additional resources or data provided in the US Pharmaceutical Caps and Closures Industry report?
While the report offers comprehensive insights, it's advisable to review the specific contents or supplementary materials provided to ascertain if additional resources or data are available.
14. How can I stay updated on further developments or reports in the US Pharmaceutical Caps and Closures Industry?
To stay informed about further developments, trends, and reports in the US Pharmaceutical Caps and Closures Industry, consider subscribing to industry newsletters, following relevant companies and organizations, or regularly checking reputable industry news sources and publications.
Methodology
Step 1 - Identification of Relevant Samples Size from Population Database


Step 2 - Approaches for Defining Global Market Size (Value, Volume* & Price*)

Note*: In applicable scenarios
Step 3 - Data Sources
Primary Research
- Web Analytics
- Survey Reports
- Research Institute
- Latest Research Reports
- Opinion Leaders
Secondary Research
- Annual Reports
- White Paper
- Latest Press Release
- Industry Association
- Paid Database
- Investor Presentations

Step 4 - Data Triangulation
Involves using different sources of information in order to increase the validity of a study
These sources are likely to be stakeholders in a program - participants, other researchers, program staff, other community members, and so on.
Then we put all data in single framework & apply various statistical tools to find out the dynamic on the market.
During the analysis stage, feedback from the stakeholder groups would be compared to determine areas of agreement as well as areas of divergence