

Key Insights
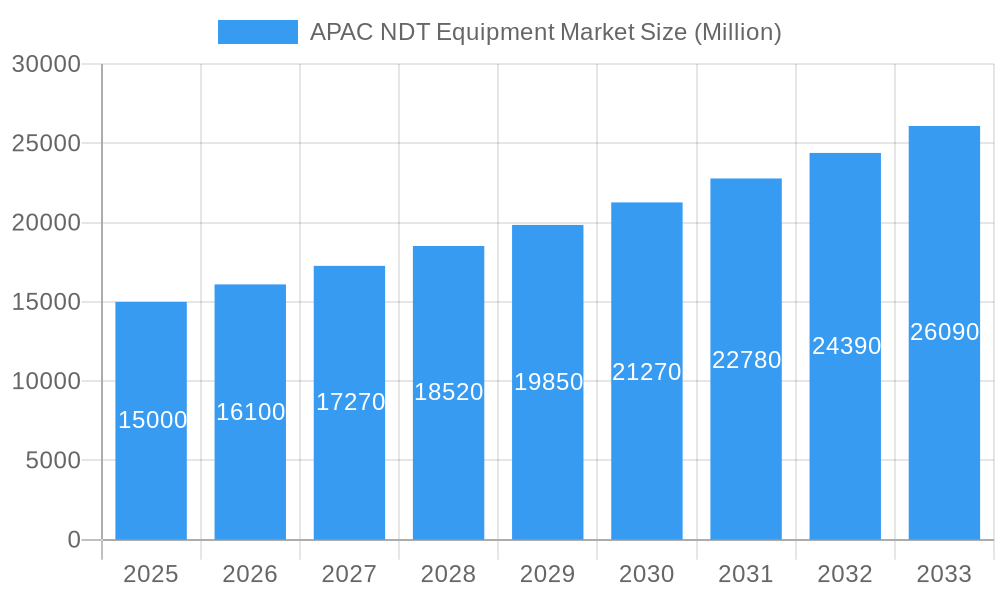
The Asia-Pacific (APAC) Non-Destructive Testing (NDT) equipment market is poised for significant expansion, driven by escalating infrastructure investments and the robust growth of key industrial sectors including automotive, aerospace & defense, and power & energy. Demand for advanced NDT methods like ultrasonic and eddy current testing is increasing, crucial for ensuring product quality, elevating safety standards, and reducing operational expenditures. Despite challenges such as high initial equipment costs and a shortage of skilled professionals, the market's growth trajectory remains positive. The integration of Industry 4.0 principles and a growing emphasis on predictive maintenance are further accelerating market expansion as organizations prioritize operational efficiency and minimal downtime. The market is projected to reach a size of $5 billion by 2025, with a Compound Annual Growth Rate (CAGR) of 7.23% between 2025 and 2033. Stringent government regulations concerning safety and quality control, particularly within the oil & gas and construction industries, are significant growth catalysts. Competitive dynamics are intense, with established and emerging players focusing on innovation and strategic alliances to capture market share. Regional growth within APAC will be influenced by individual nation's economic development, infrastructure projects, and regulatory landscapes.
APAC NDT Equipment Market Market Size (In Billion)
Anticipated growth in the APAC NDT equipment market is particularly strong in nations undertaking substantial industrialization and infrastructure development. Sectors with stringent safety requirements and a critical need for quality assurance, such as aerospace & defense and oil & gas, will likely see concentrated growth. Market segmentation by technology highlights a strong preference for advanced techniques, including ultrasonic and eddy current testing, indicating a shift towards more efficient and precise inspection methodologies. This trend is propelled by the demand for superior product quality, stricter quality control mandates, and the necessity for accurate defect detection. Market participants are concentrating on delivering integrated solutions encompassing equipment, software, and services to meet evolving industry demands. Furthermore, increased investment in research and development is expected to enhance the accuracy, efficiency, and portability of NDT equipment.
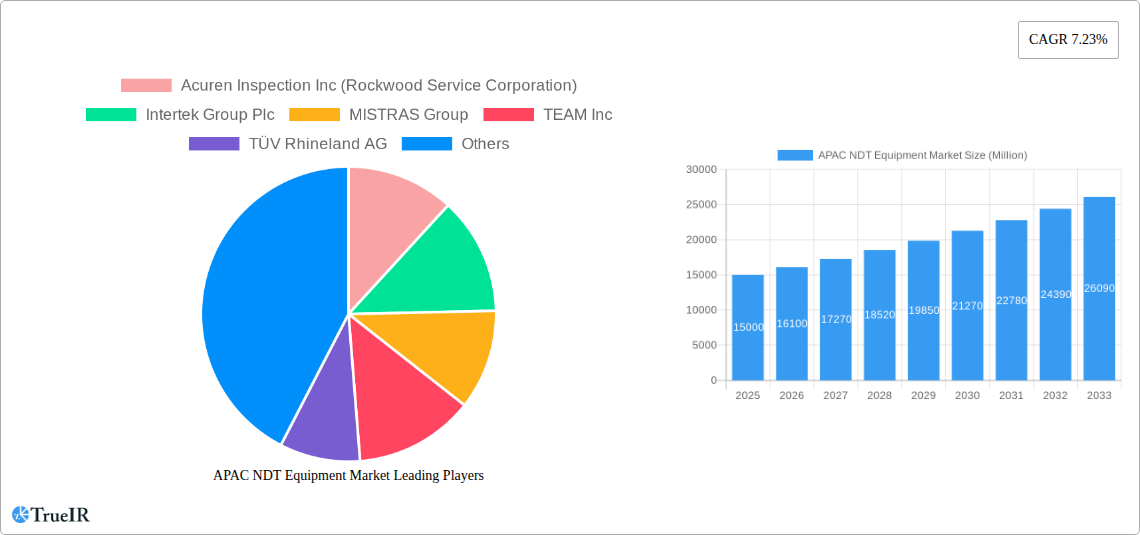
APAC NDT Equipment Market Company Market Share
APAC NDT Equipment Market: A Comprehensive Market Report (2019-2033)
This in-depth report provides a comprehensive analysis of the Asia-Pacific (APAC) Non-Destructive Testing (NDT) equipment market, covering the period from 2019 to 2033. It offers valuable insights into market size, growth drivers, challenges, competitive dynamics, and future outlook, empowering businesses to make informed strategic decisions. The report leverages extensive data analysis and expert insights to paint a clear picture of this dynamic market. Market value projections are in Millions USD.
APAC NDT Equipment Market Structure & Competitive Landscape
The APAC NDT equipment market is characterized by a moderately concentrated landscape, with several multinational corporations and regional players vying for market share. The market structure exhibits a mix of intense competition and niche specialization, driven by technological advancements and diverse end-user requirements.
Market Concentration: The Herfindahl-Hirschman Index (HHI) for the APAC NDT equipment market in 2024 is estimated at xx, indicating a moderately concentrated market. This suggests the presence of both large multinational corporations and smaller, specialized players.
Innovation Drivers: Continuous innovation in NDT technologies, such as advanced imaging techniques and automated inspection systems, is a key driver of market growth. The demand for improved accuracy, efficiency, and portability fuels the development of new products and services.
Regulatory Impacts: Stringent safety regulations across various industries are driving the adoption of NDT equipment. Government initiatives promoting infrastructure development and industrial safety standards also significantly influence market demand.
Product Substitutes: While direct substitutes for NDT equipment are limited, alternative inspection methods like visual inspection and traditional testing techniques exist. However, the growing demand for higher accuracy, reliability, and speed favors NDT technologies.
End-User Segmentation: The market is segmented by end-users, including Oil & Gas, Power & Energy, Construction, Automotive & Transportation, Aerospace & Defense, and Others. Growth across various segments depends on sector-specific regulatory mandates and the intensity of infrastructure development activities.
M&A Trends: The APAC NDT equipment market has witnessed a moderate level of mergers and acquisitions (M&A) activity in recent years, with approximately xx M&A deals recorded between 2019 and 2024. These activities aim to expand market reach, enhance technological capabilities, and diversify product portfolios.
APAC NDT Equipment Market Market Trends & Opportunities
The Non-Destructive Testing (NDT) equipment market in the Asia-Pacific (APAC) region is experiencing a dynamic period of growth and innovation. This expansion is predominantly driven by a confluence of accelerating industrialization across key economies, substantial investments in critical infrastructure development, and an increasingly stringent regulatory landscape focused on safety and quality assurance. The market is poised for significant expansion, with projections indicating a substantial market size by 2025 and a robust Compound Annual Growth Rate (CAGR) throughout the forecast period (2025-2033). This positive trajectory is underpinned by several pivotal factors:
- Technological Advancements & Digitalization: A key trend is the deep integration of cutting-edge technologies such as Artificial Intelligence (AI), Machine Learning (ML), and advanced data analytics into NDT methodologies. These innovations are not only enhancing the accuracy and efficiency of inspection processes but are also paving the way for predictive maintenance strategies. Furthermore, the increasing adoption of robotics and automation is revolutionizing how inspections are conducted, making them safer, faster, and more comprehensive.
- Surging Infrastructure Spending: APAC nations are witnessing unprecedented levels of investment in a wide array of infrastructure projects, including transportation networks, energy facilities, and urban development. This surge necessitates rigorous quality control and safety validation, directly fueling the demand for sophisticated NDT equipment, particularly in economic powerhouses like China, India, and other rapidly developing economies within the region.
- Enforcement of Stringent Safety Regulations: Governments across the APAC region are progressively implementing and enforcing more rigorous safety regulations across diverse industrial sectors. These regulations mandate the consistent application of NDT techniques to ensure the integrity and safety of assets, thereby driving market demand and accelerating the adoption of advanced NDT technologies.
- Growing Demand for Advanced Materials: The increasing utilization of high-performance and advanced materials, such as composites, advanced alloys, and specialized polymers, in industries ranging from aerospace to automotive, is creating a parallel demand for sophisticated NDT equipment. These advanced tools are essential for inspecting complex geometries and detecting subtle defects in these novel materials.
- Competitive Landscape: The APAC NDT equipment market is characterized by a dynamic competitive environment. It features a strong presence of well-established multinational corporations renowned for their comprehensive product portfolios and global reach, alongside agile and innovative regional players who are adept at catering to specific local market needs. This competitive interplay fosters continuous innovation, drives down costs, and offers a wider array of solutions to end-users.
Dominant Markets & Segments in APAC NDT Equipment Market
Within the expansive APAC NDT equipment market, China stands out as the dominant force, followed by other significant markets such as Japan, India, and South Korea. These leading countries collectively command a substantial portion of the regional market revenue, a testament to their robust industrial ecosystems, rapid infrastructure expansion, and a growing emphasis on technological adoption for quality and safety.
Leading Countries:
- China: Benefiting from its colossal industrial base, accelerated infrastructure development initiatives, and a heightened focus on industrial safety and quality standards, China has firmly established itself as the largest and most significant market for NDT equipment in the APAC region.
- Japan: Japan's mature and highly advanced manufacturing sector, coupled with its unwavering commitment to exceptional quality control and product reliability, continues to drive a consistent demand for high-end and sophisticated NDT equipment.
- India: The booming construction industry, expanding energy sector, and burgeoning manufacturing base in India are collectively contributing to substantial and sustained growth in the NDT equipment market, reflecting the nation's rapid industrialization.
- South Korea: With its advanced technological capabilities, world-leading manufacturing prowess, and a strong focus on innovation, South Korea remains a key market for high-performance and cutting-edge NDT technologies, particularly in specialized industrial applications.
Dominant Segments:
- Technology Type: Currently, ultrasonic testing and radiographic testing technologies hold significant market shares due to their inherent versatility, proven reliability, and wide-ranging applicability across a multitude of industries. Eddy current testing is also emerging as a rapidly growing segment, gaining particular traction in demanding sectors like aerospace and automotive manufacturing.
- End-user: The Oil & Gas and Power & Energy sectors are consistently the largest consumers of NDT equipment. This dominance is attributed to the critical nature of their operations, the imperative for unwavering safety, and the stringent regulatory mandates governing these industries. The construction sector also represents a significant end-user, with demand largely driven by large-scale infrastructure development projects.
Key Growth Drivers:
- Infrastructure Development: The sheer scale of ongoing and planned infrastructure projects across the APAC region acts as a powerful catalyst for NDT equipment adoption, ensuring quality assurance and safety compliance.
- Stringent Safety Regulations: Government mandates and evolving safety standards for critical infrastructure and industrial applications are increasingly compelling organizations to invest in and utilize NDT technologies, thereby fueling market expansion.
- Rising Industrialization: The continuous and rapid growth of manufacturing and industrial sectors throughout APAC directly translates into sustained demand for a wide range of NDT equipment to support diverse production and maintenance needs.
APAC NDT Equipment Market Product Analysis
Recent product innovations in the APAC NDT equipment market focus on enhancing efficiency, precision, and portability. Advances in sensor technology, data analytics, and automation are driving the development of sophisticated NDT systems. These innovations address industry needs for faster inspection times, improved accuracy, and reduced operational costs. The market sees a shift toward integrated systems that combine multiple NDT techniques, offering comprehensive inspection capabilities. These systems benefit from improved data management and streamlined workflows.
Key Drivers, Barriers & Challenges in APAC NDT Equipment Market
The APAC NDT equipment market is propelled by a set of powerful drivers, but also contends with notable barriers and challenges that shape its trajectory.
Key Drivers:
- Technological Advancements: The ongoing integration of AI, ML, and automated systems is dramatically enhancing the accuracy, efficiency, and diagnostic capabilities of NDT inspections.
- Increasing Infrastructure Spending: Large-scale public and private infrastructure projects across the region necessitate robust quality control measures, driving significant demand for NDT solutions.
- Stringent Safety Regulations: Evolving and enforced safety regulations by governments are making NDT an essential component for ensuring compliance and enhancing safety standards in various industries.
Challenges:
- High Initial Investment Costs: The sophisticated nature of advanced NDT equipment can translate to substantial upfront costs, which can be a deterrent for smaller enterprises and startups looking to adopt these technologies.
- Skilled Labor Shortage: The effective operation, calibration, and accurate interpretation of NDT data require highly specialized skills and training. A widespread shortage of qualified NDT professionals can limit the full utilization of advanced equipment.
- Intense Competition: The market is characterized by a highly competitive landscape, featuring both established global players with extensive market presence and emerging regional companies offering specialized solutions. This can lead to price pressures and challenges in market differentiation.
- Supply Chain Disruptions: Global geopolitical events, logistical challenges, and the availability of critical components and specialized materials can lead to unpredictable supply chain disruptions, potentially causing project delays and increased operational costs for both manufacturers and end-users.
Growth Drivers in the APAC NDT Equipment Market Market
The APAC NDT equipment market is experiencing robust growth, propelled by a convergence of technological advancements, supportive government policies, and rising industrial activities. The increasing adoption of advanced materials, stringent safety regulations, and a focus on infrastructure development are key catalysts. The market's expansion is further reinforced by the burgeoning demand for higher inspection accuracy and efficiency across diverse sectors, prompting the deployment of cutting-edge NDT solutions.
Challenges Impacting APAC NDT Equipment Market Growth
Despite the considerable growth potential inherent in the APAC NDT equipment market, several critical challenges can temper its expansion. Foremost among these is the substantial initial investment required for advanced NDT technologies, which can present a significant barrier to entry for smaller businesses or those with limited capital. Furthermore, a persistent scarcity of highly skilled professionals capable of operating and interpreting complex NDT equipment effectively poses a constraint. The market also grapples with intense competition among a growing number of both established multinational corporations and agile regional players. Beyond these internal market dynamics, external factors such as unpredictable global supply chain disruptions and the inherent variability in regulatory frameworks across different APAC countries can also impede the seamless adoption and widespread deployment of sophisticated NDT solutions. Addressing these multifaceted challenges will be crucial for unlocking the full potential of the APAC NDT equipment market.
Key Players Shaping the APAC NDT Equipment Market Market
The APAC NDT equipment market is a dynamic arena shaped by a combination of globally recognized leaders and specialized regional providers. These key players are instrumental in driving innovation, setting industry standards, and catering to the diverse needs of the region's burgeoning industrial landscape:
- Acuren Inspection Inc (Rockwood Service Corporation)
- Intertek Group Plc
- MISTRAS Group
- TEAM Inc
- TÜV Rhineland AG
- Zetec Inc
- SGS Group
- Bureau Veritas S A
- Nikon Metrology NV
- Fujifilm Corporation
- Olympus Corporation
- Magnaflux Corp
- NCS Testing Technology Co Limited
- GE Measurement and Control
- Applus Services S A
- YXLON International Gmbh ( COMET Group)
Significant APAC NDT Equipment Market Industry Milestones
- April 2021: Nikon Corporation launched the Lasermeister 102A, a new optical processing system for additive manufacturing, enhancing precision and capabilities in metal processing.
- April 2021: Nikon Corporation released a "Remote Control SDK" for its NEXIV CNC Video Measuring System, improving automation and efficiency in measurement and inspection processes.
- April 2021: Bureau Veritas joined the Task Force on Climate-related Financial Disclosures (TCFD), demonstrating commitment to climate-related transparency and influencing industry standards.
- April 2021: Carnival Corporation & plc partnered with Bureau Veritas for health and safety services (NDT), showcasing the growing demand for NDT in the leisure travel industry.
Future Outlook for APAC NDT Equipment Market Market
The APAC NDT equipment market is poised for continued expansion, driven by sustained infrastructure investment, stringent safety standards, and technological advancements. The integration of AI and automation will further enhance inspection efficiency and accuracy. Strategic partnerships and acquisitions are expected to shape the competitive landscape. The market presents significant opportunities for companies offering innovative, cost-effective, and user-friendly NDT solutions. The increasing focus on digitalization and data analytics will unlock new avenues for growth.
APAC NDT Equipment Market Segmentation
-
1. Technology Type
- 1.1. Radiography Testing
- 1.2. Ultrasonic Testing
- 1.3. Magnetic Particle Testing*
- 1.4. Liquid Penetrant Testing
- 1.5. Visual Inspection
- 1.6. Eddy Current Testing*
- 1.7. Other Technologies
-
2. End-user
- 2.1. Oil & Gas
- 2.2. Power & Energy
- 2.3. Construction
- 2.4. Automotive & Transportation
- 2.5. Aerospace & Defense
- 2.6. Other End-users
APAC NDT Equipment Market Segmentation By Geography
-
1. North America
- 1.1. United States
- 1.2. Canada
- 1.3. Mexico
-
2. South America
- 2.1. Brazil
- 2.2. Argentina
- 2.3. Rest of South America
-
3. Europe
- 3.1. United Kingdom
- 3.2. Germany
- 3.3. France
- 3.4. Italy
- 3.5. Spain
- 3.6. Russia
- 3.7. Benelux
- 3.8. Nordics
- 3.9. Rest of Europe
-
4. Middle East & Africa
- 4.1. Turkey
- 4.2. Israel
- 4.3. GCC
- 4.4. North Africa
- 4.5. South Africa
- 4.6. Rest of Middle East & Africa
-
5. Asia Pacific
- 5.1. China
- 5.2. India
- 5.3. Japan
- 5.4. South Korea
- 5.5. ASEAN
- 5.6. Oceania
- 5.7. Rest of Asia Pacific
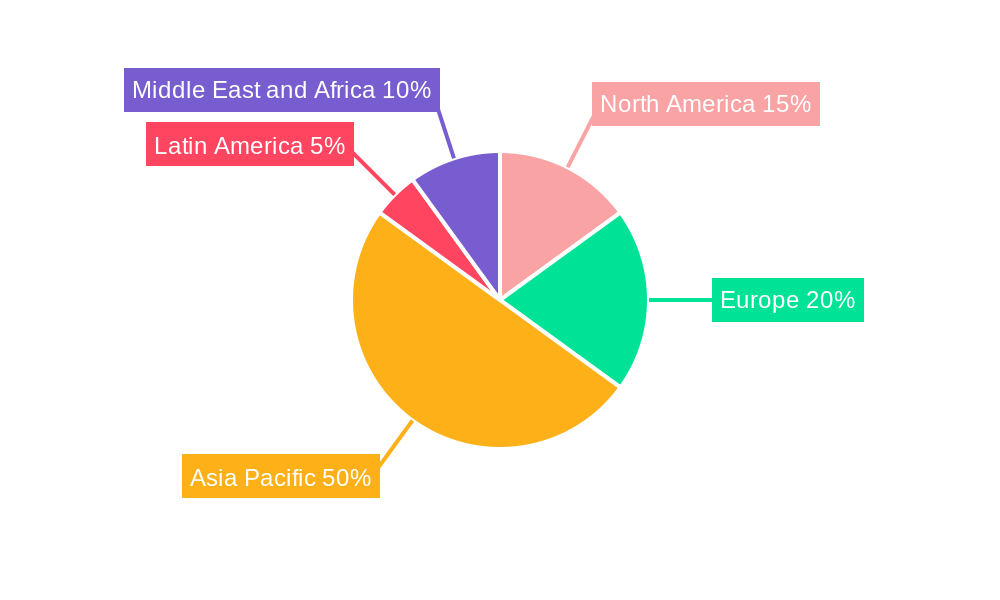
APAC NDT Equipment Market Regional Market Share
Geographic Coverage of APAC NDT Equipment Market
APAC NDT Equipment Market REPORT HIGHLIGHTS
| Aspects | Details |
|---|---|
| Study Period | 2020-2034 |
| Base Year | 2025 |
| Estimated Year | 2026 |
| Forecast Period | 2026-2034 |
| Historical Period | 2020-2025 |
| Growth Rate | CAGR of 7.23% from 2020-2034 |
| Segmentation |
|
Table of Contents
- 1. Introduction
- 1.1. Research Scope
- 1.2. Market Segmentation
- 1.3. Research Objective
- 1.4. Definitions and Assumptions
- 2. Executive Summary
- 2.1. Market Snapshot
- 3. Market Dynamics
- 3.1. Market Drivers
- 3.2. Market Restrains
- 3.3. Market Trends
- 3.4. Market Opportunities
- 4. Market Factor Analysis
- 4.1. Porters Five Forces
- 4.1.1. Bargaining Power of Suppliers
- 4.1.2. Bargaining Power of Buyers
- 4.1.3. Threat of New Entrants
- 4.1.4. Threat of Substitutes
- 4.1.5. Competitive Rivalry
- 4.2. PESTEL analysis
- 4.3. BCG Analysis
- 4.3.1. Stars (High Growth, High Market Share)
- 4.3.2. Cash Cows (Low Growth, High Market Share)
- 4.3.3. Question Mark (High Growth, Low Market Share)
- 4.3.4. Dogs (Low Growth, Low Market Share)
- 4.4. Ansoff Matrix Analysis
- 4.5. Supply Chain Analysis
- 4.6. Regulatory Landscape
- 4.7. Current Market Potential and Opportunity Assessment (TAM–SAM–SOM Framework)
- 4.8. TIR Analyst Note
- 4.1. Porters Five Forces
- 5. Market Analysis, Insights and Forecast 2021-2033
- 5.1. Market Analysis, Insights and Forecast - by Technology Type
- 5.1.1. Radiography Testing
- 5.1.2. Ultrasonic Testing
- 5.1.3. Magnetic Particle Testing*
- 5.1.4. Liquid Penetrant Testing
- 5.1.5. Visual Inspection
- 5.1.6. Eddy Current Testing*
- 5.1.7. Other Technologies
- 5.2. Market Analysis, Insights and Forecast - by End-user
- 5.2.1. Oil & Gas
- 5.2.2. Power & Energy
- 5.2.3. Construction
- 5.2.4. Automotive & Transportation
- 5.2.5. Aerospace & Defense
- 5.2.6. Other End-users
- 5.3. Market Analysis, Insights and Forecast - by Region
- 5.3.1. North America
- 5.3.2. South America
- 5.3.3. Europe
- 5.3.4. Middle East & Africa
- 5.3.5. Asia Pacific
- 5.1. Market Analysis, Insights and Forecast - by Technology Type
- 6. Global APAC NDT Equipment Market Analysis, Insights and Forecast, 2021-2033
- 6.1. Market Analysis, Insights and Forecast - by Technology Type
- 6.1.1. Radiography Testing
- 6.1.2. Ultrasonic Testing
- 6.1.3. Magnetic Particle Testing*
- 6.1.4. Liquid Penetrant Testing
- 6.1.5. Visual Inspection
- 6.1.6. Eddy Current Testing*
- 6.1.7. Other Technologies
- 6.2. Market Analysis, Insights and Forecast - by End-user
- 6.2.1. Oil & Gas
- 6.2.2. Power & Energy
- 6.2.3. Construction
- 6.2.4. Automotive & Transportation
- 6.2.5. Aerospace & Defense
- 6.2.6. Other End-users
- 6.1. Market Analysis, Insights and Forecast - by Technology Type
- 7. North America APAC NDT Equipment Market Analysis, Insights and Forecast, 2020-2032
- 7.1. Market Analysis, Insights and Forecast - by Technology Type
- 7.1.1. Radiography Testing
- 7.1.2. Ultrasonic Testing
- 7.1.3. Magnetic Particle Testing*
- 7.1.4. Liquid Penetrant Testing
- 7.1.5. Visual Inspection
- 7.1.6. Eddy Current Testing*
- 7.1.7. Other Technologies
- 7.2. Market Analysis, Insights and Forecast - by End-user
- 7.2.1. Oil & Gas
- 7.2.2. Power & Energy
- 7.2.3. Construction
- 7.2.4. Automotive & Transportation
- 7.2.5. Aerospace & Defense
- 7.2.6. Other End-users
- 7.1. Market Analysis, Insights and Forecast - by Technology Type
- 8. South America APAC NDT Equipment Market Analysis, Insights and Forecast, 2020-2032
- 8.1. Market Analysis, Insights and Forecast - by Technology Type
- 8.1.1. Radiography Testing
- 8.1.2. Ultrasonic Testing
- 8.1.3. Magnetic Particle Testing*
- 8.1.4. Liquid Penetrant Testing
- 8.1.5. Visual Inspection
- 8.1.6. Eddy Current Testing*
- 8.1.7. Other Technologies
- 8.2. Market Analysis, Insights and Forecast - by End-user
- 8.2.1. Oil & Gas
- 8.2.2. Power & Energy
- 8.2.3. Construction
- 8.2.4. Automotive & Transportation
- 8.2.5. Aerospace & Defense
- 8.2.6. Other End-users
- 8.1. Market Analysis, Insights and Forecast - by Technology Type
- 9. Europe APAC NDT Equipment Market Analysis, Insights and Forecast, 2020-2032
- 9.1. Market Analysis, Insights and Forecast - by Technology Type
- 9.1.1. Radiography Testing
- 9.1.2. Ultrasonic Testing
- 9.1.3. Magnetic Particle Testing*
- 9.1.4. Liquid Penetrant Testing
- 9.1.5. Visual Inspection
- 9.1.6. Eddy Current Testing*
- 9.1.7. Other Technologies
- 9.2. Market Analysis, Insights and Forecast - by End-user
- 9.2.1. Oil & Gas
- 9.2.2. Power & Energy
- 9.2.3. Construction
- 9.2.4. Automotive & Transportation
- 9.2.5. Aerospace & Defense
- 9.2.6. Other End-users
- 9.1. Market Analysis, Insights and Forecast - by Technology Type
- 10. Middle East & Africa APAC NDT Equipment Market Analysis, Insights and Forecast, 2020-2032
- 10.1. Market Analysis, Insights and Forecast - by Technology Type
- 10.1.1. Radiography Testing
- 10.1.2. Ultrasonic Testing
- 10.1.3. Magnetic Particle Testing*
- 10.1.4. Liquid Penetrant Testing
- 10.1.5. Visual Inspection
- 10.1.6. Eddy Current Testing*
- 10.1.7. Other Technologies
- 10.2. Market Analysis, Insights and Forecast - by End-user
- 10.2.1. Oil & Gas
- 10.2.2. Power & Energy
- 10.2.3. Construction
- 10.2.4. Automotive & Transportation
- 10.2.5. Aerospace & Defense
- 10.2.6. Other End-users
- 10.1. Market Analysis, Insights and Forecast - by Technology Type
- 11. Asia Pacific APAC NDT Equipment Market Analysis, Insights and Forecast, 2020-2032
- 11.1. Market Analysis, Insights and Forecast - by Technology Type
- 11.1.1. Radiography Testing
- 11.1.2. Ultrasonic Testing
- 11.1.3. Magnetic Particle Testing*
- 11.1.4. Liquid Penetrant Testing
- 11.1.5. Visual Inspection
- 11.1.6. Eddy Current Testing*
- 11.1.7. Other Technologies
- 11.2. Market Analysis, Insights and Forecast - by End-user
- 11.2.1. Oil & Gas
- 11.2.2. Power & Energy
- 11.2.3. Construction
- 11.2.4. Automotive & Transportation
- 11.2.5. Aerospace & Defense
- 11.2.6. Other End-users
- 11.1. Market Analysis, Insights and Forecast - by Technology Type
- 12. Competitive Analysis
- 12.1. Company Profiles
- 12.1.1 Acuren Inspection Inc (Rockwood Service Corporation)
- 12.1.1.1. Company Overview
- 12.1.1.2. Products
- 12.1.1.3. Company Financials
- 12.1.1.4. SWOT Analysis
- 12.1.2 Intertek Group Plc
- 12.1.2.1. Company Overview
- 12.1.2.2. Products
- 12.1.2.3. Company Financials
- 12.1.2.4. SWOT Analysis
- 12.1.3 MISTRAS Group
- 12.1.3.1. Company Overview
- 12.1.3.2. Products
- 12.1.3.3. Company Financials
- 12.1.3.4. SWOT Analysis
- 12.1.4 TEAM Inc
- 12.1.4.1. Company Overview
- 12.1.4.2. Products
- 12.1.4.3. Company Financials
- 12.1.4.4. SWOT Analysis
- 12.1.5 TÜV Rhineland AG
- 12.1.5.1. Company Overview
- 12.1.5.2. Products
- 12.1.5.3. Company Financials
- 12.1.5.4. SWOT Analysis
- 12.1.6 Zetec Inc *List Not Exhaustive
- 12.1.6.1. Company Overview
- 12.1.6.2. Products
- 12.1.6.3. Company Financials
- 12.1.6.4. SWOT Analysis
- 12.1.7 SGS Group
- 12.1.7.1. Company Overview
- 12.1.7.2. Products
- 12.1.7.3. Company Financials
- 12.1.7.4. SWOT Analysis
- 12.1.8 Bureau Veritas S A
- 12.1.8.1. Company Overview
- 12.1.8.2. Products
- 12.1.8.3. Company Financials
- 12.1.8.4. SWOT Analysis
- 12.1.9 Nikon Metrology NV
- 12.1.9.1. Company Overview
- 12.1.9.2. Products
- 12.1.9.3. Company Financials
- 12.1.9.4. SWOT Analysis
- 12.1.10 Fujifilm Corporation
- 12.1.10.1. Company Overview
- 12.1.10.2. Products
- 12.1.10.3. Company Financials
- 12.1.10.4. SWOT Analysis
- 12.1.11 Olympus Corporation
- 12.1.11.1. Company Overview
- 12.1.11.2. Products
- 12.1.11.3. Company Financials
- 12.1.11.4. SWOT Analysis
- 12.1.12 Magnaflux Corp
- 12.1.12.1. Company Overview
- 12.1.12.2. Products
- 12.1.12.3. Company Financials
- 12.1.12.4. SWOT Analysis
- 12.1.13 NCS Testing Technology Co Limited
- 12.1.13.1. Company Overview
- 12.1.13.2. Products
- 12.1.13.3. Company Financials
- 12.1.13.4. SWOT Analysis
- 12.1.14 GE Measurement and Control
- 12.1.14.1. Company Overview
- 12.1.14.2. Products
- 12.1.14.3. Company Financials
- 12.1.14.4. SWOT Analysis
- 12.1.15 Applus Services S A
- 12.1.15.1. Company Overview
- 12.1.15.2. Products
- 12.1.15.3. Company Financials
- 12.1.15.4. SWOT Analysis
- 12.1.16 YXLON International Gmbh ( COMET Group)
- 12.1.16.1. Company Overview
- 12.1.16.2. Products
- 12.1.16.3. Company Financials
- 12.1.16.4. SWOT Analysis
- 12.1.1 Acuren Inspection Inc (Rockwood Service Corporation)
- 12.2. Market Entropy
- 12.2.1 Company's Key Areas Served
- 12.2.2 Recent Developments
- 12.3. Company Market Share Analysis 2025
- 12.3.1 Top 5 Companies Market Share Analysis
- 12.3.2 Top 3 Companies Market Share Analysis
- 12.4. List of Potential Customers
- 13. Research Methodology
List of Figures
- Figure 1: Global APAC NDT Equipment Market Revenue Breakdown (billion, %) by Region 2025 & 2033
- Figure 2: North America APAC NDT Equipment Market Revenue (billion), by Technology Type 2025 & 2033
- Figure 3: North America APAC NDT Equipment Market Revenue Share (%), by Technology Type 2025 & 2033
- Figure 4: North America APAC NDT Equipment Market Revenue (billion), by End-user 2025 & 2033
- Figure 5: North America APAC NDT Equipment Market Revenue Share (%), by End-user 2025 & 2033
- Figure 6: North America APAC NDT Equipment Market Revenue (billion), by Country 2025 & 2033
- Figure 7: North America APAC NDT Equipment Market Revenue Share (%), by Country 2025 & 2033
- Figure 8: South America APAC NDT Equipment Market Revenue (billion), by Technology Type 2025 & 2033
- Figure 9: South America APAC NDT Equipment Market Revenue Share (%), by Technology Type 2025 & 2033
- Figure 10: South America APAC NDT Equipment Market Revenue (billion), by End-user 2025 & 2033
- Figure 11: South America APAC NDT Equipment Market Revenue Share (%), by End-user 2025 & 2033
- Figure 12: South America APAC NDT Equipment Market Revenue (billion), by Country 2025 & 2033
- Figure 13: South America APAC NDT Equipment Market Revenue Share (%), by Country 2025 & 2033
- Figure 14: Europe APAC NDT Equipment Market Revenue (billion), by Technology Type 2025 & 2033
- Figure 15: Europe APAC NDT Equipment Market Revenue Share (%), by Technology Type 2025 & 2033
- Figure 16: Europe APAC NDT Equipment Market Revenue (billion), by End-user 2025 & 2033
- Figure 17: Europe APAC NDT Equipment Market Revenue Share (%), by End-user 2025 & 2033
- Figure 18: Europe APAC NDT Equipment Market Revenue (billion), by Country 2025 & 2033
- Figure 19: Europe APAC NDT Equipment Market Revenue Share (%), by Country 2025 & 2033
- Figure 20: Middle East & Africa APAC NDT Equipment Market Revenue (billion), by Technology Type 2025 & 2033
- Figure 21: Middle East & Africa APAC NDT Equipment Market Revenue Share (%), by Technology Type 2025 & 2033
- Figure 22: Middle East & Africa APAC NDT Equipment Market Revenue (billion), by End-user 2025 & 2033
- Figure 23: Middle East & Africa APAC NDT Equipment Market Revenue Share (%), by End-user 2025 & 2033
- Figure 24: Middle East & Africa APAC NDT Equipment Market Revenue (billion), by Country 2025 & 2033
- Figure 25: Middle East & Africa APAC NDT Equipment Market Revenue Share (%), by Country 2025 & 2033
- Figure 26: Asia Pacific APAC NDT Equipment Market Revenue (billion), by Technology Type 2025 & 2033
- Figure 27: Asia Pacific APAC NDT Equipment Market Revenue Share (%), by Technology Type 2025 & 2033
- Figure 28: Asia Pacific APAC NDT Equipment Market Revenue (billion), by End-user 2025 & 2033
- Figure 29: Asia Pacific APAC NDT Equipment Market Revenue Share (%), by End-user 2025 & 2033
- Figure 30: Asia Pacific APAC NDT Equipment Market Revenue (billion), by Country 2025 & 2033
- Figure 31: Asia Pacific APAC NDT Equipment Market Revenue Share (%), by Country 2025 & 2033
List of Tables
- Table 1: Global APAC NDT Equipment Market Revenue billion Forecast, by Technology Type 2020 & 2033
- Table 2: Global APAC NDT Equipment Market Revenue billion Forecast, by End-user 2020 & 2033
- Table 3: Global APAC NDT Equipment Market Revenue billion Forecast, by Region 2020 & 2033
- Table 4: Global APAC NDT Equipment Market Revenue billion Forecast, by Technology Type 2020 & 2033
- Table 5: Global APAC NDT Equipment Market Revenue billion Forecast, by End-user 2020 & 2033
- Table 6: Global APAC NDT Equipment Market Revenue billion Forecast, by Country 2020 & 2033
- Table 7: United States APAC NDT Equipment Market Revenue (billion) Forecast, by Application 2020 & 2033
- Table 8: Canada APAC NDT Equipment Market Revenue (billion) Forecast, by Application 2020 & 2033
- Table 9: Mexico APAC NDT Equipment Market Revenue (billion) Forecast, by Application 2020 & 2033
- Table 10: Global APAC NDT Equipment Market Revenue billion Forecast, by Technology Type 2020 & 2033
- Table 11: Global APAC NDT Equipment Market Revenue billion Forecast, by End-user 2020 & 2033
- Table 12: Global APAC NDT Equipment Market Revenue billion Forecast, by Country 2020 & 2033
- Table 13: Brazil APAC NDT Equipment Market Revenue (billion) Forecast, by Application 2020 & 2033
- Table 14: Argentina APAC NDT Equipment Market Revenue (billion) Forecast, by Application 2020 & 2033
- Table 15: Rest of South America APAC NDT Equipment Market Revenue (billion) Forecast, by Application 2020 & 2033
- Table 16: Global APAC NDT Equipment Market Revenue billion Forecast, by Technology Type 2020 & 2033
- Table 17: Global APAC NDT Equipment Market Revenue billion Forecast, by End-user 2020 & 2033
- Table 18: Global APAC NDT Equipment Market Revenue billion Forecast, by Country 2020 & 2033
- Table 19: United Kingdom APAC NDT Equipment Market Revenue (billion) Forecast, by Application 2020 & 2033
- Table 20: Germany APAC NDT Equipment Market Revenue (billion) Forecast, by Application 2020 & 2033
- Table 21: France APAC NDT Equipment Market Revenue (billion) Forecast, by Application 2020 & 2033
- Table 22: Italy APAC NDT Equipment Market Revenue (billion) Forecast, by Application 2020 & 2033
- Table 23: Spain APAC NDT Equipment Market Revenue (billion) Forecast, by Application 2020 & 2033
- Table 24: Russia APAC NDT Equipment Market Revenue (billion) Forecast, by Application 2020 & 2033
- Table 25: Benelux APAC NDT Equipment Market Revenue (billion) Forecast, by Application 2020 & 2033
- Table 26: Nordics APAC NDT Equipment Market Revenue (billion) Forecast, by Application 2020 & 2033
- Table 27: Rest of Europe APAC NDT Equipment Market Revenue (billion) Forecast, by Application 2020 & 2033
- Table 28: Global APAC NDT Equipment Market Revenue billion Forecast, by Technology Type 2020 & 2033
- Table 29: Global APAC NDT Equipment Market Revenue billion Forecast, by End-user 2020 & 2033
- Table 30: Global APAC NDT Equipment Market Revenue billion Forecast, by Country 2020 & 2033
- Table 31: Turkey APAC NDT Equipment Market Revenue (billion) Forecast, by Application 2020 & 2033
- Table 32: Israel APAC NDT Equipment Market Revenue (billion) Forecast, by Application 2020 & 2033
- Table 33: GCC APAC NDT Equipment Market Revenue (billion) Forecast, by Application 2020 & 2033
- Table 34: North Africa APAC NDT Equipment Market Revenue (billion) Forecast, by Application 2020 & 2033
- Table 35: South Africa APAC NDT Equipment Market Revenue (billion) Forecast, by Application 2020 & 2033
- Table 36: Rest of Middle East & Africa APAC NDT Equipment Market Revenue (billion) Forecast, by Application 2020 & 2033
- Table 37: Global APAC NDT Equipment Market Revenue billion Forecast, by Technology Type 2020 & 2033
- Table 38: Global APAC NDT Equipment Market Revenue billion Forecast, by End-user 2020 & 2033
- Table 39: Global APAC NDT Equipment Market Revenue billion Forecast, by Country 2020 & 2033
- Table 40: China APAC NDT Equipment Market Revenue (billion) Forecast, by Application 2020 & 2033
- Table 41: India APAC NDT Equipment Market Revenue (billion) Forecast, by Application 2020 & 2033
- Table 42: Japan APAC NDT Equipment Market Revenue (billion) Forecast, by Application 2020 & 2033
- Table 43: South Korea APAC NDT Equipment Market Revenue (billion) Forecast, by Application 2020 & 2033
- Table 44: ASEAN APAC NDT Equipment Market Revenue (billion) Forecast, by Application 2020 & 2033
- Table 45: Oceania APAC NDT Equipment Market Revenue (billion) Forecast, by Application 2020 & 2033
- Table 46: Rest of Asia Pacific APAC NDT Equipment Market Revenue (billion) Forecast, by Application 2020 & 2033
Frequently Asked Questions
1. What is the projected Compound Annual Growth Rate (CAGR) of the APAC NDT Equipment Market?
The projected CAGR is approximately 7.23%.
2. Which companies are prominent players in the APAC NDT Equipment Market?
Key companies in the market include Acuren Inspection Inc (Rockwood Service Corporation), Intertek Group Plc, MISTRAS Group, TEAM Inc, TÜV Rhineland AG, Zetec Inc *List Not Exhaustive, SGS Group, Bureau Veritas S A, Nikon Metrology NV, Fujifilm Corporation, Olympus Corporation, Magnaflux Corp, NCS Testing Technology Co Limited, GE Measurement and Control, Applus Services S A, YXLON International Gmbh ( COMET Group).
3. What are the main segments of the APAC NDT Equipment Market?
The market segments include Technology Type, End-user.
4. Can you provide details about the market size?
The market size is estimated to be USD 5 billion as of 2022.
5. What are some drivers contributing to market growth?
Stringent safety regulations and growth in inspection services industry expected to drive adoption; Growing demand from the construction industry.
6. What are the notable trends driving market growth?
Stringent Regulations Mandating Safety.
7. Are there any restraints impacting market growth?
High replacement rate remains a key concern followed by reluctance to adopt new technologies in emerging regions.
8. Can you provide examples of recent developments in the market?
APRIL 2021- Nikon Corporation launched the Lasermeister 102A, a new optical processing system capable of titanium alloy additive manufacturing. The Lasermeister series uses a high-precision laser to perform a variety of metal processing tasks, including additive manufacturing like a 3D printer and laser marking and welding.
9. What pricing options are available for accessing the report?
Pricing options include single-user, multi-user, and enterprise licenses priced at USD 4750, USD 4950, and USD 6800 respectively.
10. Is the market size provided in terms of value or volume?
The market size is provided in terms of value, measured in billion.
11. Are there any specific market keywords associated with the report?
Yes, the market keyword associated with the report is "APAC NDT Equipment Market," which aids in identifying and referencing the specific market segment covered.
12. How do I determine which pricing option suits my needs best?
The pricing options vary based on user requirements and access needs. Individual users may opt for single-user licenses, while businesses requiring broader access may choose multi-user or enterprise licenses for cost-effective access to the report.
13. Are there any additional resources or data provided in the APAC NDT Equipment Market report?
While the report offers comprehensive insights, it's advisable to review the specific contents or supplementary materials provided to ascertain if additional resources or data are available.
14. How can I stay updated on further developments or reports in the APAC NDT Equipment Market?
To stay informed about further developments, trends, and reports in the APAC NDT Equipment Market, consider subscribing to industry newsletters, following relevant companies and organizations, or regularly checking reputable industry news sources and publications.
Methodology
Step 1 - Identification of Relevant Samples Size from Population Database


Step 2 - Approaches for Defining Global Market Size (Value, Volume* & Price*)

Note*: In applicable scenarios
Step 3 - Data Sources
Primary Research
- Web Analytics
- Survey Reports
- Research Institute
- Latest Research Reports
- Opinion Leaders
Secondary Research
- Annual Reports
- White Paper
- Latest Press Release
- Industry Association
- Paid Database
- Investor Presentations

Step 4 - Data Triangulation
Involves using different sources of information in order to increase the validity of a study
These sources are likely to be stakeholders in a program - participants, other researchers, program staff, other community members, and so on.
Then we put all data in single framework & apply various statistical tools to find out the dynamic on the market.
During the analysis stage, feedback from the stakeholder groups would be compared to determine areas of agreement as well as areas of divergence