
Key Insights
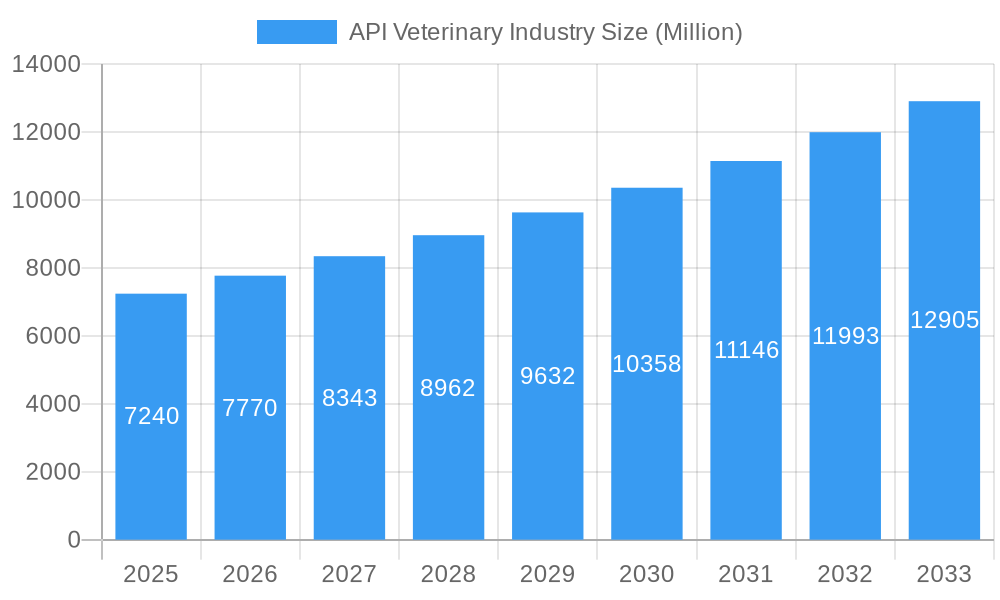
The global API Veterinary market, valued at $7.24 billion in 2025, is projected to experience robust growth, driven by a Compound Annual Growth Rate (CAGR) of 7.10% from 2025 to 2033. This expansion is fueled by several key factors. Increasing pet ownership globally, coupled with rising pet healthcare expenditure, significantly boosts demand for effective and affordable veterinary medicines. Furthermore, the growing prevalence of zoonotic diseases (diseases transmissible from animals to humans) necessitates enhanced animal health management, further stimulating API demand. Technological advancements in API synthesis, particularly in the development of novel biological APIs and highly potent APIs (HPAPIs), offer improved efficacy and reduced side effects, driving market growth. The outsourcing trend within the veterinary pharmaceutical industry, leveraging contract manufacturing organizations (CMOs) for API production, is also contributing to market expansion. However, stringent regulatory approvals and the high cost associated with research and development for new veterinary APIs represent key challenges. Market segmentation reveals a diverse landscape, with antiparasitic and anti-infective APIs holding significant market shares, reflecting the prevalence of parasitic and infectious diseases in animals. The geographical distribution shows substantial growth opportunities in rapidly developing economies of Asia-Pacific and South America, driven by increasing veterinary infrastructure and rising animal populations.

API Veterinary Industry Market Size (In Billion)
The competitive landscape is characterized by a mix of established players and emerging companies. Key players are strategically investing in research and development, expanding their product portfolios, and exploring strategic partnerships to consolidate their market positions. Sequent Scientific, AMGIS Lifescience, and FIS are examples of companies contributing significantly to API supply. The ongoing trend towards contract outsourcing presents opportunities for specialized CMOs, while the demand for HPAPIs signals a shift toward more potent and efficient treatments. Future market growth will be shaped by factors such as the development of innovative APIs, advancements in veterinary diagnostics, and evolving regulatory landscapes across different regions. The market’s success hinges on meeting the growing demand for safe and effective veterinary medicines while navigating the challenges of cost, regulations, and competition.
API Veterinary Industry Company Market Share
API Veterinary Industry Market Report: A Comprehensive Analysis (2019-2033)
This comprehensive report provides a detailed analysis of the API Veterinary Industry market, encompassing market size, growth drivers, competitive landscape, and future outlook. With a study period spanning 2019-2033, a base year of 2025, and a forecast period of 2025-2033, this report offers invaluable insights for stakeholders across the veterinary pharmaceutical value chain. The global API veterinary market is projected to reach $XX Million by 2033, exhibiting a robust CAGR of xx% during the forecast period.
API Veterinary Industry Market Structure & Competitive Landscape
The API veterinary market exhibits a moderately consolidated structure, with a few large players holding significant market share. Concentration ratios (e.g., CR4, CR8) indicate a xx% market share held by the top four companies in 2024, suggesting both opportunities for expansion and challenges for smaller entrants. Innovation in the sector is driven by the need for more effective, safer, and cost-efficient animal health solutions, particularly in emerging markets. Stringent regulatory requirements, such as those imposed by the FDA and EMA, significantly influence market dynamics, driving investments in quality control and compliance. Product substitutes, including traditional remedies and alternative therapies, exert some competitive pressure, though the efficacy and safety of APIs typically provide a strong competitive edge.
The market is segmented by various end-users, including livestock farms, companion animal clinics, and research institutions. Mergers and acquisitions (M&A) activity is frequent, reflecting the consolidating nature of the industry. In 2024, approximately $XX Million in M&A deals were recorded, signifying a drive for scale and technological capabilities. Specific examples include the Sequent Scientific acquisition of Tineta Pharma.
- Market Concentration: Moderately consolidated, with top 4 companies holding xx% market share in 2024.
- Innovation Drivers: Demand for improved efficacy, safety, and cost-effectiveness.
- Regulatory Impacts: Stringent FDA and EMA regulations drive quality control investments.
- Product Substitutes: Traditional remedies and alternative therapies pose limited competition.
- End-User Segmentation: Livestock farms, companion animal clinics, research institutions.
- M&A Trends: Significant activity (approx. $XX Million in 2024), reflecting consolidation trends.
API Veterinary Industry Market Trends & Opportunities
The global API veterinary market is experiencing substantial growth, driven by several factors. Rising pet ownership globally, coupled with increased awareness of animal health and welfare, is fueling demand for veterinary pharmaceuticals. Technological advancements in API synthesis, including the development of more potent and targeted therapies, are enhancing treatment effectiveness. Furthermore, the increasing prevalence of zoonotic diseases underscores the importance of animal health, driving government investments and funding for research and development.
Consumer preferences are shifting toward more natural and sustainable products, creating opportunities for APIs developed using environmentally friendly processes. Intense competition necessitates continuous innovation, driving companies to invest in research and development to stay ahead of the curve. Market penetration rates for key API products vary by region and animal species, with higher penetration in developed countries and for companion animals. The market is expected to see a CAGR of xx% from 2025 to 2033.
Dominant Markets & Segments in API Veterinary Industry
The North American and European markets currently dominate the API veterinary industry, driven by high pet ownership rates and established regulatory frameworks. However, the Asia-Pacific region presents a significant growth opportunity, fueled by increasing livestock production and rising disposable incomes.
Key Growth Drivers:
- North America & Europe: High pet ownership, established regulatory frameworks, advanced veterinary infrastructure.
- Asia-Pacific: Rapidly growing livestock sector, rising disposable incomes, expanding veterinary infrastructure.
Dominant Segments:
- Product: Antiparasitics are currently the largest segment, followed by anti-infectives. Vaccines represent a significant and rapidly growing segment.
- Synthesis Type: Chemical-based APIs currently hold the largest share, but biological APIs are witnessing accelerated growth. The HPAPI segment is experiencing strong growth due to the demand for highly effective, low-dosage formulations.
- Service Type: Contract outsourcing services are increasingly preferred due to cost-effectiveness and expertise.
The detailed analysis shows that the Antiparasitic segment is the dominant product segment, with a market value exceeding $XX Million in 2024, demonstrating robust growth driven by a continuous increase in animal health issues and demand for effective preventive and curative treatments.
API Veterinary Industry Product Analysis
Technological advancements are driving innovation in API veterinary products, leading to the development of novel formulations with improved efficacy, reduced side effects, and enhanced delivery systems. Products incorporating nanotechnology and targeted drug delivery systems are gaining traction, while the focus on environmentally friendly and sustainable manufacturing processes is increasing. The market is characterized by a diverse range of products catering to various animal species and health conditions, highlighting the versatility and broad applicability of APIs in the veterinary field. The effective marketing and promotion of new products, coupled with competitive pricing strategies, plays a key role in market penetration and success.
Key Drivers, Barriers & Challenges in API Veterinary Industry
Key Drivers:
- Rising Pet Ownership: Increased demand for veterinary care fuels API demand.
- Technological Advancements: Development of novel APIs with improved efficacy and safety.
- Government Regulations: Stringent regulations are driving quality and safety improvements.
Challenges & Restraints:
- Stringent Regulatory Approvals: Lengthy and complex approval processes increase development costs and time-to-market.
- Supply Chain Disruptions: Global events can disrupt the supply of raw materials and finished goods, leading to price fluctuations.
- Competitive Landscape: The presence of several players results in price competition and margin compression, impacting profitability. This impacts the profitability of smaller companies, impacting their growth and investment capacity, estimated to be $XX Million annually.
Growth Drivers in the API Veterinary Industry Market
Several factors propel the growth of the API veterinary market. The increasing prevalence of zoonotic diseases reinforces the importance of animal health, stimulating government investment and research initiatives. The rising global pet population and heightened awareness of animal welfare are driving increased demand for veterinary pharmaceuticals. Technological advancements in API synthesis and formulation, including targeted delivery systems, enhance treatment efficacy and safety. Finally, expanding veterinary infrastructure and a burgeoning middle class in emerging economies contribute to market expansion.
Challenges Impacting API Veterinary Industry Growth
Significant challenges impede the growth of the API veterinary industry. Complex regulatory processes, involving extensive testing and documentation requirements, increase the time and cost associated with new product approvals. Supply chain disruptions, whether due to geopolitical events or natural disasters, impact the availability and cost of raw materials, affecting production and profitability. Intense competition among established players and the emergence of new entrants exert downward pressure on prices, impacting profit margins.
Key Players Shaping the API Veterinary Industry Market
- Sequent Scientific Ltd (Alivira Animal Health Limited)
- AMGIS Lifescience Ltd
- FIS - Fabbrica Italiana Sintetici S p A
- Menadiona
- Sidhiv Pharma
- NGL Fine-Chem Ltd
- Grupo Indukern S L
- Chempro Pharma Private Limited
- SUANFARMA
- Stanley Black & Decker (Excel Industries Limited)
- Ofichem Group
Significant API Veterinary Industry Industry Milestones
- November 2022: Sequent Scientific Limited acquired a 100% stake in Tineta Pharma Private Limited, expanding its product portfolio and market reach.
- January 2022: Sequent Scientific Limited received a Certificate of Suitability (CEP) from the EU for its Diclazuril API, strengthening its position in the antiprotozoal market.
Future Outlook for API Veterinary Industry Market
The API veterinary industry is poised for continued growth, driven by several factors. Technological advancements will continue to improve the efficacy and safety of APIs, expanding treatment options for various animal diseases. The rising pet ownership and improved animal healthcare awareness in developing economies will stimulate increased demand. Strategic partnerships and acquisitions will further consolidate the market, driving economies of scale and innovation. These factors contribute to a positive outlook for the industry, with significant market potential in the coming years.
API Veterinary Industry Segmentation
-
1. Product
- 1.1. Antiparasitic
- 1.2. Anti-infectives
- 1.3. Vaccines
- 1.4. NSAIDs
-
2. Synthesis Type
- 2.1. Chemical Based API
- 2.2. Biological API
- 2.3. Highly Potent API (HPAPI)
-
3. Service Type
- 3.1. In House
-
3.2. Contract Outsourcing
- 3.2.1. Contract Development
- 3.2.2. Contract Manufacturing
API Veterinary Industry Segmentation By Geography
-
1. North America
- 1.1. United States
- 1.2. Canada
- 1.3. Mexico
-
2. Europe
- 2.1. Germany
- 2.2. United Kingdom
- 2.3. France
- 2.4. Italy
- 2.5. Spain
- 2.6. Rest of Europe
-
3. Asia Pacific
- 3.1. China
- 3.2. Japan
- 3.3. India
- 3.4. Australia
- 3.5. South Korea
- 3.6. Rest of Asia Pacific
-
4. Middle East and Africa
- 4.1. GCC
- 4.2. South Africa
- 4.3. Rest of Middle East and Africa
-
5. South America
- 5.1. Brazil
- 5.2. Argentina
- 5.3. Rest of South America

API Veterinary Industry Regional Market Share
Geographic Coverage of API Veterinary Industry
API Veterinary Industry REPORT HIGHLIGHTS
| Aspects | Details |
|---|---|
| Study Period | 2020-2034 |
| Base Year | 2025 |
| Estimated Year | 2026 |
| Forecast Period | 2026-2034 |
| Historical Period | 2020-2025 |
| Growth Rate | CAGR of 7.10% from 2020-2034 |
| Segmentation |
|
Table of Contents
- 1. Introduction
- 1.1. Research Scope
- 1.2. Market Segmentation
- 1.3. Research Methodology
- 1.4. Definitions and Assumptions
- 2. Executive Summary
- 2.1. Introduction
- 3. Market Dynamics
- 3.1. Introduction
- 3.2. Market Drivers
- 3.2.1. Increasing Prevalence of Zoonotic Diseases; Increasing Animal Population And Pet Ownership; Rising Number of Veterinarians and Veterinary Visits
- 3.3. Market Restrains
- 3.3.1. Lack of Awareness and High Cost of Animal Care; Stringent Government Regulations
- 3.4. Market Trends
- 3.4.1. The Vaccines Segment is Expected to Hold a Significant Market Share in the Veterinary Active Pharmaceutical Ingredients Manufacturing Market
- 4. Market Factor Analysis
- 4.1. Porters Five Forces
- 4.2. Supply/Value Chain
- 4.3. PESTEL analysis
- 4.4. Market Entropy
- 4.5. Patent/Trademark Analysis
- 5. Global API Veterinary Industry Analysis, Insights and Forecast, 2020-2032
- 5.1. Market Analysis, Insights and Forecast - by Product
- 5.1.1. Antiparasitic
- 5.1.2. Anti-infectives
- 5.1.3. Vaccines
- 5.1.4. NSAIDs
- 5.2. Market Analysis, Insights and Forecast - by Synthesis Type
- 5.2.1. Chemical Based API
- 5.2.2. Biological API
- 5.2.3. Highly Potent API (HPAPI)
- 5.3. Market Analysis, Insights and Forecast - by Service Type
- 5.3.1. In House
- 5.3.2. Contract Outsourcing
- 5.3.2.1. Contract Development
- 5.3.2.2. Contract Manufacturing
- 5.4. Market Analysis, Insights and Forecast - by Region
- 5.4.1. North America
- 5.4.2. Europe
- 5.4.3. Asia Pacific
- 5.4.4. Middle East and Africa
- 5.4.5. South America
- 5.1. Market Analysis, Insights and Forecast - by Product
- 6. North America API Veterinary Industry Analysis, Insights and Forecast, 2020-2032
- 6.1. Market Analysis, Insights and Forecast - by Product
- 6.1.1. Antiparasitic
- 6.1.2. Anti-infectives
- 6.1.3. Vaccines
- 6.1.4. NSAIDs
- 6.2. Market Analysis, Insights and Forecast - by Synthesis Type
- 6.2.1. Chemical Based API
- 6.2.2. Biological API
- 6.2.3. Highly Potent API (HPAPI)
- 6.3. Market Analysis, Insights and Forecast - by Service Type
- 6.3.1. In House
- 6.3.2. Contract Outsourcing
- 6.3.2.1. Contract Development
- 6.3.2.2. Contract Manufacturing
- 6.1. Market Analysis, Insights and Forecast - by Product
- 7. Europe API Veterinary Industry Analysis, Insights and Forecast, 2020-2032
- 7.1. Market Analysis, Insights and Forecast - by Product
- 7.1.1. Antiparasitic
- 7.1.2. Anti-infectives
- 7.1.3. Vaccines
- 7.1.4. NSAIDs
- 7.2. Market Analysis, Insights and Forecast - by Synthesis Type
- 7.2.1. Chemical Based API
- 7.2.2. Biological API
- 7.2.3. Highly Potent API (HPAPI)
- 7.3. Market Analysis, Insights and Forecast - by Service Type
- 7.3.1. In House
- 7.3.2. Contract Outsourcing
- 7.3.2.1. Contract Development
- 7.3.2.2. Contract Manufacturing
- 7.1. Market Analysis, Insights and Forecast - by Product
- 8. Asia Pacific API Veterinary Industry Analysis, Insights and Forecast, 2020-2032
- 8.1. Market Analysis, Insights and Forecast - by Product
- 8.1.1. Antiparasitic
- 8.1.2. Anti-infectives
- 8.1.3. Vaccines
- 8.1.4. NSAIDs
- 8.2. Market Analysis, Insights and Forecast - by Synthesis Type
- 8.2.1. Chemical Based API
- 8.2.2. Biological API
- 8.2.3. Highly Potent API (HPAPI)
- 8.3. Market Analysis, Insights and Forecast - by Service Type
- 8.3.1. In House
- 8.3.2. Contract Outsourcing
- 8.3.2.1. Contract Development
- 8.3.2.2. Contract Manufacturing
- 8.1. Market Analysis, Insights and Forecast - by Product
- 9. Middle East and Africa API Veterinary Industry Analysis, Insights and Forecast, 2020-2032
- 9.1. Market Analysis, Insights and Forecast - by Product
- 9.1.1. Antiparasitic
- 9.1.2. Anti-infectives
- 9.1.3. Vaccines
- 9.1.4. NSAIDs
- 9.2. Market Analysis, Insights and Forecast - by Synthesis Type
- 9.2.1. Chemical Based API
- 9.2.2. Biological API
- 9.2.3. Highly Potent API (HPAPI)
- 9.3. Market Analysis, Insights and Forecast - by Service Type
- 9.3.1. In House
- 9.3.2. Contract Outsourcing
- 9.3.2.1. Contract Development
- 9.3.2.2. Contract Manufacturing
- 9.1. Market Analysis, Insights and Forecast - by Product
- 10. South America API Veterinary Industry Analysis, Insights and Forecast, 2020-2032
- 10.1. Market Analysis, Insights and Forecast - by Product
- 10.1.1. Antiparasitic
- 10.1.2. Anti-infectives
- 10.1.3. Vaccines
- 10.1.4. NSAIDs
- 10.2. Market Analysis, Insights and Forecast - by Synthesis Type
- 10.2.1. Chemical Based API
- 10.2.2. Biological API
- 10.2.3. Highly Potent API (HPAPI)
- 10.3. Market Analysis, Insights and Forecast - by Service Type
- 10.3.1. In House
- 10.3.2. Contract Outsourcing
- 10.3.2.1. Contract Development
- 10.3.2.2. Contract Manufacturing
- 10.1. Market Analysis, Insights and Forecast - by Product
- 11. North America API Veterinary Industry Analysis, Insights and Forecast, 2020-2032
- 11.1. Market Analysis, Insights and Forecast - By Country/Sub-region
- 11.1.1 United States
- 11.1.2 Canada
- 11.1.3 Mexico
- 12. Europe API Veterinary Industry Analysis, Insights and Forecast, 2020-2032
- 12.1. Market Analysis, Insights and Forecast - By Country/Sub-region
- 12.1.1 Germany
- 12.1.2 United Kingdom
- 12.1.3 France
- 12.1.4 Italy
- 12.1.5 Spain
- 12.1.6 Rest of Europe
- 13. Asia Pacific API Veterinary Industry Analysis, Insights and Forecast, 2020-2032
- 13.1. Market Analysis, Insights and Forecast - By Country/Sub-region
- 13.1.1 China
- 13.1.2 Japan
- 13.1.3 India
- 13.1.4 Australia
- 13.1.5 South Korea
- 13.1.6 Rest of Asia Pacific
- 14. Middle East and Africa API Veterinary Industry Analysis, Insights and Forecast, 2020-2032
- 14.1. Market Analysis, Insights and Forecast - By Country/Sub-region
- 14.1.1 GCC
- 14.1.2 South Africa
- 14.1.3 Rest of Middle East and Africa
- 15. South America API Veterinary Industry Analysis, Insights and Forecast, 2020-2032
- 15.1. Market Analysis, Insights and Forecast - By Country/Sub-region
- 15.1.1 Brazil
- 15.1.2 Argentina
- 15.1.3 Rest of South America
- 16. Competitive Analysis
- 16.1. Global Market Share Analysis 2025
- 16.2. Company Profiles
- 16.2.1 Sequent Scientific Ltd (Alivira Animal Health Limited)
- 16.2.1.1. Overview
- 16.2.1.2. Products
- 16.2.1.3. SWOT Analysis
- 16.2.1.4. Recent Developments
- 16.2.1.5. Financials (Based on Availability)
- 16.2.2 AMGIS Lifescience Ltd
- 16.2.2.1. Overview
- 16.2.2.2. Products
- 16.2.2.3. SWOT Analysis
- 16.2.2.4. Recent Developments
- 16.2.2.5. Financials (Based on Availability)
- 16.2.3 FIS - Fabbrica Italiana Sintetici S p A
- 16.2.3.1. Overview
- 16.2.3.2. Products
- 16.2.3.3. SWOT Analysis
- 16.2.3.4. Recent Developments
- 16.2.3.5. Financials (Based on Availability)
- 16.2.4 Menadiona
- 16.2.4.1. Overview
- 16.2.4.2. Products
- 16.2.4.3. SWOT Analysis
- 16.2.4.4. Recent Developments
- 16.2.4.5. Financials (Based on Availability)
- 16.2.5 Sidhiv Pharma
- 16.2.5.1. Overview
- 16.2.5.2. Products
- 16.2.5.3. SWOT Analysis
- 16.2.5.4. Recent Developments
- 16.2.5.5. Financials (Based on Availability)
- 16.2.6 NGL Fine-Chem Ltd
- 16.2.6.1. Overview
- 16.2.6.2. Products
- 16.2.6.3. SWOT Analysis
- 16.2.6.4. Recent Developments
- 16.2.6.5. Financials (Based on Availability)
- 16.2.7 Grupo Indukern S L
- 16.2.7.1. Overview
- 16.2.7.2. Products
- 16.2.7.3. SWOT Analysis
- 16.2.7.4. Recent Developments
- 16.2.7.5. Financials (Based on Availability)
- 16.2.8 Chempro Pharma Private Limited
- 16.2.8.1. Overview
- 16.2.8.2. Products
- 16.2.8.3. SWOT Analysis
- 16.2.8.4. Recent Developments
- 16.2.8.5. Financials (Based on Availability)
- 16.2.9 SUANFARMA
- 16.2.9.1. Overview
- 16.2.9.2. Products
- 16.2.9.3. SWOT Analysis
- 16.2.9.4. Recent Developments
- 16.2.9.5. Financials (Based on Availability)
- 16.2.10 Stanley Black & Decker (Excel Industries Limited)
- 16.2.10.1. Overview
- 16.2.10.2. Products
- 16.2.10.3. SWOT Analysis
- 16.2.10.4. Recent Developments
- 16.2.10.5. Financials (Based on Availability)
- 16.2.11 Ofichem Group
- 16.2.11.1. Overview
- 16.2.11.2. Products
- 16.2.11.3. SWOT Analysis
- 16.2.11.4. Recent Developments
- 16.2.11.5. Financials (Based on Availability)
- 16.2.1 Sequent Scientific Ltd (Alivira Animal Health Limited)
List of Figures
- Figure 1: Global API Veterinary Industry Revenue Breakdown (Million, %) by Region 2025 & 2033
- Figure 2: North America API Veterinary Industry Revenue (Million), by Country 2025 & 2033
- Figure 3: North America API Veterinary Industry Revenue Share (%), by Country 2025 & 2033
- Figure 4: Europe API Veterinary Industry Revenue (Million), by Country 2025 & 2033
- Figure 5: Europe API Veterinary Industry Revenue Share (%), by Country 2025 & 2033
- Figure 6: Asia Pacific API Veterinary Industry Revenue (Million), by Country 2025 & 2033
- Figure 7: Asia Pacific API Veterinary Industry Revenue Share (%), by Country 2025 & 2033
- Figure 8: Middle East and Africa API Veterinary Industry Revenue (Million), by Country 2025 & 2033
- Figure 9: Middle East and Africa API Veterinary Industry Revenue Share (%), by Country 2025 & 2033
- Figure 10: South America API Veterinary Industry Revenue (Million), by Country 2025 & 2033
- Figure 11: South America API Veterinary Industry Revenue Share (%), by Country 2025 & 2033
- Figure 12: North America API Veterinary Industry Revenue (Million), by Product 2025 & 2033
- Figure 13: North America API Veterinary Industry Revenue Share (%), by Product 2025 & 2033
- Figure 14: North America API Veterinary Industry Revenue (Million), by Synthesis Type 2025 & 2033
- Figure 15: North America API Veterinary Industry Revenue Share (%), by Synthesis Type 2025 & 2033
- Figure 16: North America API Veterinary Industry Revenue (Million), by Service Type 2025 & 2033
- Figure 17: North America API Veterinary Industry Revenue Share (%), by Service Type 2025 & 2033
- Figure 18: North America API Veterinary Industry Revenue (Million), by Country 2025 & 2033
- Figure 19: North America API Veterinary Industry Revenue Share (%), by Country 2025 & 2033
- Figure 20: Europe API Veterinary Industry Revenue (Million), by Product 2025 & 2033
- Figure 21: Europe API Veterinary Industry Revenue Share (%), by Product 2025 & 2033
- Figure 22: Europe API Veterinary Industry Revenue (Million), by Synthesis Type 2025 & 2033
- Figure 23: Europe API Veterinary Industry Revenue Share (%), by Synthesis Type 2025 & 2033
- Figure 24: Europe API Veterinary Industry Revenue (Million), by Service Type 2025 & 2033
- Figure 25: Europe API Veterinary Industry Revenue Share (%), by Service Type 2025 & 2033
- Figure 26: Europe API Veterinary Industry Revenue (Million), by Country 2025 & 2033
- Figure 27: Europe API Veterinary Industry Revenue Share (%), by Country 2025 & 2033
- Figure 28: Asia Pacific API Veterinary Industry Revenue (Million), by Product 2025 & 2033
- Figure 29: Asia Pacific API Veterinary Industry Revenue Share (%), by Product 2025 & 2033
- Figure 30: Asia Pacific API Veterinary Industry Revenue (Million), by Synthesis Type 2025 & 2033
- Figure 31: Asia Pacific API Veterinary Industry Revenue Share (%), by Synthesis Type 2025 & 2033
- Figure 32: Asia Pacific API Veterinary Industry Revenue (Million), by Service Type 2025 & 2033
- Figure 33: Asia Pacific API Veterinary Industry Revenue Share (%), by Service Type 2025 & 2033
- Figure 34: Asia Pacific API Veterinary Industry Revenue (Million), by Country 2025 & 2033
- Figure 35: Asia Pacific API Veterinary Industry Revenue Share (%), by Country 2025 & 2033
- Figure 36: Middle East and Africa API Veterinary Industry Revenue (Million), by Product 2025 & 2033
- Figure 37: Middle East and Africa API Veterinary Industry Revenue Share (%), by Product 2025 & 2033
- Figure 38: Middle East and Africa API Veterinary Industry Revenue (Million), by Synthesis Type 2025 & 2033
- Figure 39: Middle East and Africa API Veterinary Industry Revenue Share (%), by Synthesis Type 2025 & 2033
- Figure 40: Middle East and Africa API Veterinary Industry Revenue (Million), by Service Type 2025 & 2033
- Figure 41: Middle East and Africa API Veterinary Industry Revenue Share (%), by Service Type 2025 & 2033
- Figure 42: Middle East and Africa API Veterinary Industry Revenue (Million), by Country 2025 & 2033
- Figure 43: Middle East and Africa API Veterinary Industry Revenue Share (%), by Country 2025 & 2033
- Figure 44: South America API Veterinary Industry Revenue (Million), by Product 2025 & 2033
- Figure 45: South America API Veterinary Industry Revenue Share (%), by Product 2025 & 2033
- Figure 46: South America API Veterinary Industry Revenue (Million), by Synthesis Type 2025 & 2033
- Figure 47: South America API Veterinary Industry Revenue Share (%), by Synthesis Type 2025 & 2033
- Figure 48: South America API Veterinary Industry Revenue (Million), by Service Type 2025 & 2033
- Figure 49: South America API Veterinary Industry Revenue Share (%), by Service Type 2025 & 2033
- Figure 50: South America API Veterinary Industry Revenue (Million), by Country 2025 & 2033
- Figure 51: South America API Veterinary Industry Revenue Share (%), by Country 2025 & 2033
List of Tables
- Table 1: Global API Veterinary Industry Revenue Million Forecast, by Region 2020 & 2033
- Table 2: Global API Veterinary Industry Revenue Million Forecast, by Product 2020 & 2033
- Table 3: Global API Veterinary Industry Revenue Million Forecast, by Synthesis Type 2020 & 2033
- Table 4: Global API Veterinary Industry Revenue Million Forecast, by Service Type 2020 & 2033
- Table 5: Global API Veterinary Industry Revenue Million Forecast, by Region 2020 & 2033
- Table 6: Global API Veterinary Industry Revenue Million Forecast, by Country 2020 & 2033
- Table 7: United States API Veterinary Industry Revenue (Million) Forecast, by Application 2020 & 2033
- Table 8: Canada API Veterinary Industry Revenue (Million) Forecast, by Application 2020 & 2033
- Table 9: Mexico API Veterinary Industry Revenue (Million) Forecast, by Application 2020 & 2033
- Table 10: Global API Veterinary Industry Revenue Million Forecast, by Country 2020 & 2033
- Table 11: Germany API Veterinary Industry Revenue (Million) Forecast, by Application 2020 & 2033
- Table 12: United Kingdom API Veterinary Industry Revenue (Million) Forecast, by Application 2020 & 2033
- Table 13: France API Veterinary Industry Revenue (Million) Forecast, by Application 2020 & 2033
- Table 14: Italy API Veterinary Industry Revenue (Million) Forecast, by Application 2020 & 2033
- Table 15: Spain API Veterinary Industry Revenue (Million) Forecast, by Application 2020 & 2033
- Table 16: Rest of Europe API Veterinary Industry Revenue (Million) Forecast, by Application 2020 & 2033
- Table 17: Global API Veterinary Industry Revenue Million Forecast, by Country 2020 & 2033
- Table 18: China API Veterinary Industry Revenue (Million) Forecast, by Application 2020 & 2033
- Table 19: Japan API Veterinary Industry Revenue (Million) Forecast, by Application 2020 & 2033
- Table 20: India API Veterinary Industry Revenue (Million) Forecast, by Application 2020 & 2033
- Table 21: Australia API Veterinary Industry Revenue (Million) Forecast, by Application 2020 & 2033
- Table 22: South Korea API Veterinary Industry Revenue (Million) Forecast, by Application 2020 & 2033
- Table 23: Rest of Asia Pacific API Veterinary Industry Revenue (Million) Forecast, by Application 2020 & 2033
- Table 24: Global API Veterinary Industry Revenue Million Forecast, by Country 2020 & 2033
- Table 25: GCC API Veterinary Industry Revenue (Million) Forecast, by Application 2020 & 2033
- Table 26: South Africa API Veterinary Industry Revenue (Million) Forecast, by Application 2020 & 2033
- Table 27: Rest of Middle East and Africa API Veterinary Industry Revenue (Million) Forecast, by Application 2020 & 2033
- Table 28: Global API Veterinary Industry Revenue Million Forecast, by Country 2020 & 2033
- Table 29: Brazil API Veterinary Industry Revenue (Million) Forecast, by Application 2020 & 2033
- Table 30: Argentina API Veterinary Industry Revenue (Million) Forecast, by Application 2020 & 2033
- Table 31: Rest of South America API Veterinary Industry Revenue (Million) Forecast, by Application 2020 & 2033
- Table 32: Global API Veterinary Industry Revenue Million Forecast, by Product 2020 & 2033
- Table 33: Global API Veterinary Industry Revenue Million Forecast, by Synthesis Type 2020 & 2033
- Table 34: Global API Veterinary Industry Revenue Million Forecast, by Service Type 2020 & 2033
- Table 35: Global API Veterinary Industry Revenue Million Forecast, by Country 2020 & 2033
- Table 36: United States API Veterinary Industry Revenue (Million) Forecast, by Application 2020 & 2033
- Table 37: Canada API Veterinary Industry Revenue (Million) Forecast, by Application 2020 & 2033
- Table 38: Mexico API Veterinary Industry Revenue (Million) Forecast, by Application 2020 & 2033
- Table 39: Global API Veterinary Industry Revenue Million Forecast, by Product 2020 & 2033
- Table 40: Global API Veterinary Industry Revenue Million Forecast, by Synthesis Type 2020 & 2033
- Table 41: Global API Veterinary Industry Revenue Million Forecast, by Service Type 2020 & 2033
- Table 42: Global API Veterinary Industry Revenue Million Forecast, by Country 2020 & 2033
- Table 43: Germany API Veterinary Industry Revenue (Million) Forecast, by Application 2020 & 2033
- Table 44: United Kingdom API Veterinary Industry Revenue (Million) Forecast, by Application 2020 & 2033
- Table 45: France API Veterinary Industry Revenue (Million) Forecast, by Application 2020 & 2033
- Table 46: Italy API Veterinary Industry Revenue (Million) Forecast, by Application 2020 & 2033
- Table 47: Spain API Veterinary Industry Revenue (Million) Forecast, by Application 2020 & 2033
- Table 48: Rest of Europe API Veterinary Industry Revenue (Million) Forecast, by Application 2020 & 2033
- Table 49: Global API Veterinary Industry Revenue Million Forecast, by Product 2020 & 2033
- Table 50: Global API Veterinary Industry Revenue Million Forecast, by Synthesis Type 2020 & 2033
- Table 51: Global API Veterinary Industry Revenue Million Forecast, by Service Type 2020 & 2033
- Table 52: Global API Veterinary Industry Revenue Million Forecast, by Country 2020 & 2033
- Table 53: China API Veterinary Industry Revenue (Million) Forecast, by Application 2020 & 2033
- Table 54: Japan API Veterinary Industry Revenue (Million) Forecast, by Application 2020 & 2033
- Table 55: India API Veterinary Industry Revenue (Million) Forecast, by Application 2020 & 2033
- Table 56: Australia API Veterinary Industry Revenue (Million) Forecast, by Application 2020 & 2033
- Table 57: South Korea API Veterinary Industry Revenue (Million) Forecast, by Application 2020 & 2033
- Table 58: Rest of Asia Pacific API Veterinary Industry Revenue (Million) Forecast, by Application 2020 & 2033
- Table 59: Global API Veterinary Industry Revenue Million Forecast, by Product 2020 & 2033
- Table 60: Global API Veterinary Industry Revenue Million Forecast, by Synthesis Type 2020 & 2033
- Table 61: Global API Veterinary Industry Revenue Million Forecast, by Service Type 2020 & 2033
- Table 62: Global API Veterinary Industry Revenue Million Forecast, by Country 2020 & 2033
- Table 63: GCC API Veterinary Industry Revenue (Million) Forecast, by Application 2020 & 2033
- Table 64: South Africa API Veterinary Industry Revenue (Million) Forecast, by Application 2020 & 2033
- Table 65: Rest of Middle East and Africa API Veterinary Industry Revenue (Million) Forecast, by Application 2020 & 2033
- Table 66: Global API Veterinary Industry Revenue Million Forecast, by Product 2020 & 2033
- Table 67: Global API Veterinary Industry Revenue Million Forecast, by Synthesis Type 2020 & 2033
- Table 68: Global API Veterinary Industry Revenue Million Forecast, by Service Type 2020 & 2033
- Table 69: Global API Veterinary Industry Revenue Million Forecast, by Country 2020 & 2033
- Table 70: Brazil API Veterinary Industry Revenue (Million) Forecast, by Application 2020 & 2033
- Table 71: Argentina API Veterinary Industry Revenue (Million) Forecast, by Application 2020 & 2033
- Table 72: Rest of South America API Veterinary Industry Revenue (Million) Forecast, by Application 2020 & 2033
Frequently Asked Questions
1. What is the projected Compound Annual Growth Rate (CAGR) of the API Veterinary Industry?
The projected CAGR is approximately 7.10%.
2. Which companies are prominent players in the API Veterinary Industry?
Key companies in the market include Sequent Scientific Ltd (Alivira Animal Health Limited), AMGIS Lifescience Ltd, FIS - Fabbrica Italiana Sintetici S p A, Menadiona, Sidhiv Pharma, NGL Fine-Chem Ltd, Grupo Indukern S L, Chempro Pharma Private Limited, SUANFARMA, Stanley Black & Decker (Excel Industries Limited), Ofichem Group.
3. What are the main segments of the API Veterinary Industry?
The market segments include Product, Synthesis Type, Service Type.
4. Can you provide details about the market size?
The market size is estimated to be USD 7.24 Million as of 2022.
5. What are some drivers contributing to market growth?
Increasing Prevalence of Zoonotic Diseases; Increasing Animal Population And Pet Ownership; Rising Number of Veterinarians and Veterinary Visits.
6. What are the notable trends driving market growth?
The Vaccines Segment is Expected to Hold a Significant Market Share in the Veterinary Active Pharmaceutical Ingredients Manufacturing Market.
7. Are there any restraints impacting market growth?
Lack of Awareness and High Cost of Animal Care; Stringent Government Regulations.
8. Can you provide examples of recent developments in the market?
In November 2022, SeQuent Scientific Limited (SeQuent), India's animal health company with a strong presence in veterinary formulations and APIs, signed a definitive agreement to acquire a 100% stake in Tineta Pharma Private Limited (Tineta), a company incorporated in India.
9. What pricing options are available for accessing the report?
Pricing options include single-user, multi-user, and enterprise licenses priced at USD 4750, USD 5250, and USD 8750 respectively.
10. Is the market size provided in terms of value or volume?
The market size is provided in terms of value, measured in Million.
11. Are there any specific market keywords associated with the report?
Yes, the market keyword associated with the report is "API Veterinary Industry," which aids in identifying and referencing the specific market segment covered.
12. How do I determine which pricing option suits my needs best?
The pricing options vary based on user requirements and access needs. Individual users may opt for single-user licenses, while businesses requiring broader access may choose multi-user or enterprise licenses for cost-effective access to the report.
13. Are there any additional resources or data provided in the API Veterinary Industry report?
While the report offers comprehensive insights, it's advisable to review the specific contents or supplementary materials provided to ascertain if additional resources or data are available.
14. How can I stay updated on further developments or reports in the API Veterinary Industry?
To stay informed about further developments, trends, and reports in the API Veterinary Industry, consider subscribing to industry newsletters, following relevant companies and organizations, or regularly checking reputable industry news sources and publications.
Methodology
Step 1 - Identification of Relevant Samples Size from Population Database


Step 2 - Approaches for Defining Global Market Size (Value, Volume* & Price*)

Note*: In applicable scenarios
Step 3 - Data Sources
Primary Research
- Web Analytics
- Survey Reports
- Research Institute
- Latest Research Reports
- Opinion Leaders
Secondary Research
- Annual Reports
- White Paper
- Latest Press Release
- Industry Association
- Paid Database
- Investor Presentations

Step 4 - Data Triangulation
Involves using different sources of information in order to increase the validity of a study
These sources are likely to be stakeholders in a program - participants, other researchers, program staff, other community members, and so on.
Then we put all data in single framework & apply various statistical tools to find out the dynamic on the market.
During the analysis stage, feedback from the stakeholder groups would be compared to determine areas of agreement as well as areas of divergence
