
Key Insights
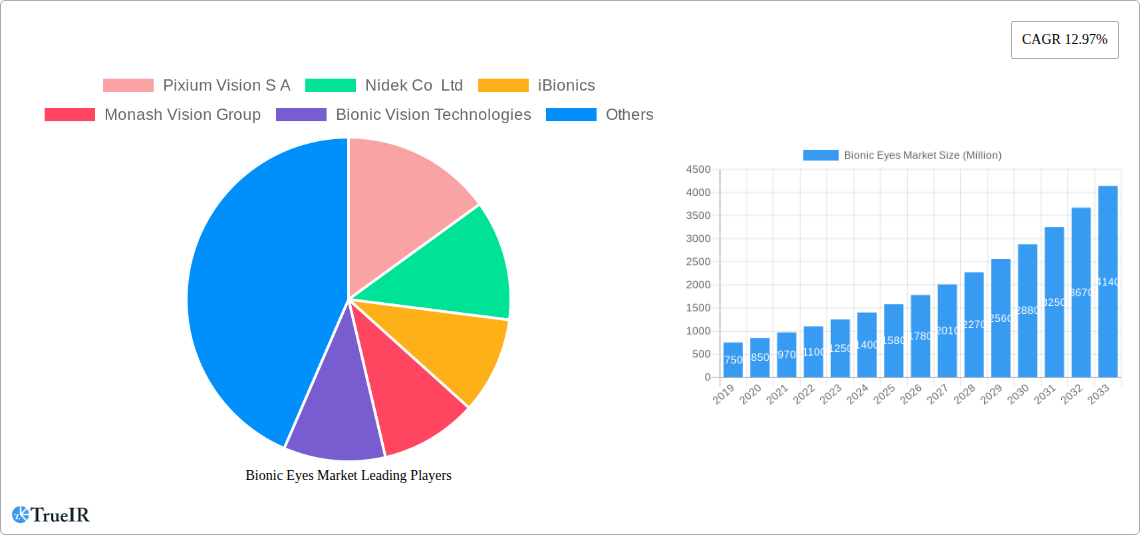
The global Bionic Eyes Market is experiencing robust growth, projected to reach a substantial market size of approximately $1.5 billion by 2025, with an impressive Compound Annual Growth Rate (CAGR) of 12.97%. This expansion is primarily fueled by a rising prevalence of vision-impairing conditions, a growing demand for advanced prosthetic solutions, and continuous technological innovations in visual prosthetics. Key drivers include the increasing incidence of age-related macular degeneration (AMD), diabetic retinopathy, and retinitis pigmentosa, conditions that significantly impact vision and create a substantial patient pool actively seeking restorative solutions. The development of sophisticated electronic and mechanical bionic eye technologies, offering enhanced visual acuity and functionality, is further propelling market adoption. Furthermore, a greater awareness and acceptance of these advanced medical devices among both patients and healthcare providers, coupled with supportive regulatory frameworks in developed regions, are contributing significantly to the market's upward trajectory.
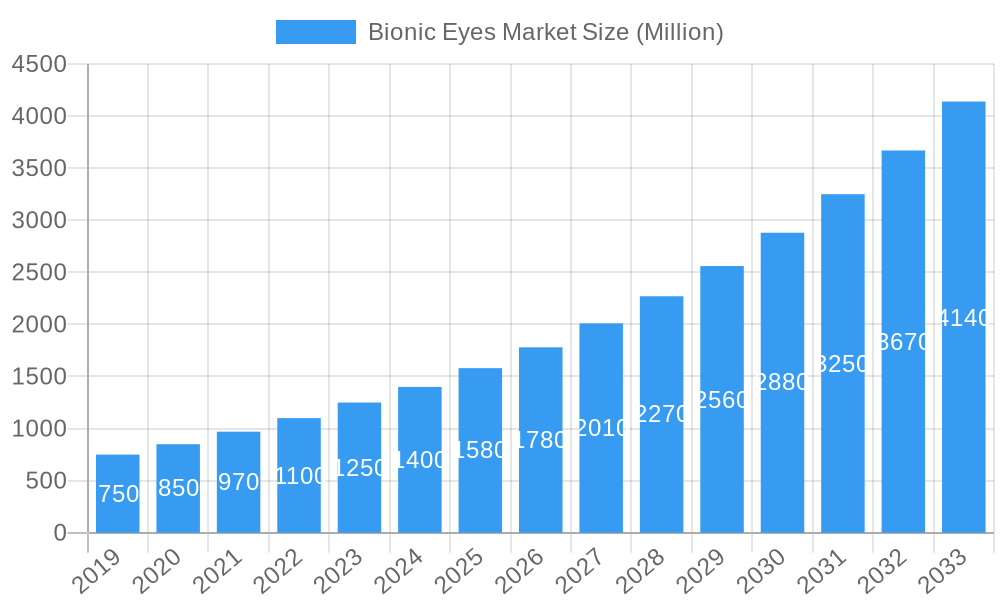
Bionic Eyes Market Market Size (In Million)
The market is segmented across various types, technologies, indications, and end-users, indicating a diverse landscape and opportunities for specialized product development. External eye implants and implanted eye devices cater to different patient needs and preferences, while mechanical and electronic technologies represent the evolving nature of bionic vision. Vision loss and impairment, alongside specific conditions like dry Age-related Macular Degeneration (dry AMD), represent the primary therapeutic areas driving demand. Hospitals and ophthalmic clinics are the dominant end-user segments, reflecting the clinical nature of bionic eye implantation and post-operative care. Geographically, North America and Europe currently lead the market due to advanced healthcare infrastructure, high disposable incomes, and early adoption of cutting-edge medical technologies. However, the Asia Pacific region is poised for significant growth, driven by a large untreated patient population, increasing healthcare expenditure, and a burgeoning medical tourism sector. The market is characterized by intense competition among key players, fostering innovation and potentially leading to price optimization for broader accessibility in the forecast period.
Bionic Eyes Market Company Market Share
This in-depth market research report provides an exhaustive analysis of the global Bionic Eyes Market, offering strategic insights for stakeholders navigating this rapidly evolving sector. Covering a study period from 2019 to 2033, with a base year of 2025 and a forecast period of 2025–2033, the report details historical trends, current market dynamics, and future projections. The Bionic Eyes Market is anticipated to reach a valuation of over 1 Million by the end of the forecast period, driven by advancements in medical technology and increasing prevalence of vision-impairing conditions.
Bionic Eyes Market Market Structure & Competitive Landscape
The Bionic Eyes Market exhibits a moderately concentrated structure, with key players investing heavily in research and development to gain a competitive edge. Innovation is the primary driver, fueled by breakthroughs in bioelectronics, nanotechnology, and surgical techniques. Regulatory bodies play a crucial role, with stringent approval processes influencing market entry and product diffusion. Product substitutes, such as advanced prosthetics and gene therapies, are emerging but currently hold a smaller market share compared to bionic eye solutions. End-user segmentation reveals a significant reliance on specialized healthcare facilities, with hospitals and ophthalmic clinics representing the largest consumer base. Mergers and acquisitions (M&A) are strategic maneuvers aimed at consolidating market share, acquiring novel technologies, and expanding geographical reach. For instance, recent M&A activities have focused on companies with promising implantable bionic eye technologies. The competitive landscape is characterized by a blend of established medical device manufacturers and innovative biotech startups, all vying for dominance in a market with immense unmet needs.
Bionic Eyes Market Market Trends & Opportunities
The global Bionic Eyes Market is poised for substantial growth, projected to witness a Compound Annual Growth Rate (CAGR) of approximately 15% over the forecast period (2025–2033). This robust expansion is underpinned by a confluence of factors, including the escalating incidence of vision-impairing diseases like Age-related Macular Degeneration (AMD) and retinitis pigmentosa, coupled with a growing aging population worldwide. Technological advancements are a cornerstone of this market's trajectory. The evolution from early external devices to sophisticated implantable bionic eyes, offering more natural visual perception, represents a significant shift. Innovations in microelectronics, sensor technology, and artificial intelligence are continuously enhancing the efficacy and user experience of these devices. Consumer preferences are increasingly leaning towards solutions that offer a higher degree of visual restoration and improved quality of life. As awareness about bionic eye technologies grows, so does the demand for these life-changing implants.
The competitive dynamics are intensifying, with companies actively pursuing strategic partnerships and collaborations to accelerate product development and market penetration. The rising awareness and acceptance of bionic eye implants as a viable treatment option for severe vision loss are also key contributors to market growth. Furthermore, favorable reimbursement policies in developed economies are expected to play a pivotal role in boosting market access and adoption rates. Opportunities abound for companies that can develop more affordable, user-friendly, and effective bionic eye systems. The potential for bionic eyes to restore functional vision, even partially, for individuals suffering from conditions previously considered untreatable, presents a significant ethical and commercial imperative. The market penetration rate, while still nascent in some regions, is expected to climb as clinical trials yield positive results and regulatory approvals broaden.
Dominant Markets & Segments in Bionic Eyes Market
The Bionic Eyes Market is currently dominated by regions with advanced healthcare infrastructure and a high prevalence of age-related vision disorders, particularly North America and Europe. These regions benefit from strong government funding for medical research, supportive regulatory frameworks, and a significant proportion of the population experiencing vision loss conditions.
- Leading Region: North America, driven by the United States, is a frontrunner due to substantial investments in medical technology innovation, a high disposable income enabling access to advanced treatments, and a robust clinical trial ecosystem.
- Dominant Segment by Type: The Implanted Eye segment is expected to witness the most rapid growth. While external bionic eyes offer a preliminary solution, the functional restoration capabilities of implantable devices are significantly more advanced and desirable for patients seeking a higher level of visual recovery.
- Dominant Segment by Technology: Electronic bionic eye technology, leveraging sophisticated microprocessors, sensors, and neural interfaces, is leading the market. These systems offer greater precision and adaptability compared to mechanical counterparts, allowing for more nuanced visual processing.
- Dominant Segment by Indication: Dry Age-related Macular Degeneration (dry AMD) is a primary indication driving market demand. As the global population ages, the incidence of dry AMD continues to rise, creating a vast patient pool requiring effective vision restoration solutions.
- Dominant Segment by End User: Hospitals and Ophthalmic Clinics are the primary end-users. These institutions possess the specialized surgical expertise, advanced diagnostic equipment, and trained personnel necessary for the implantation and post-operative care associated with bionic eyes.
Key growth drivers within these dominant segments include ongoing clinical trials demonstrating improved visual acuity and patient outcomes, increasing healthcare expenditure on advanced ophthalmological solutions, and a growing awareness among patients and clinicians about the potential of bionic vision. Policies supporting medical device innovation and reimbursement for advanced treatments further bolster market dominance in these regions and segments.
Bionic Eyes Market Product Analysis
Product innovation in the Bionic Eyes Market is characterized by a relentless pursuit of improved visual acuity and functionality. Recent advancements have focused on miniaturization of electronic components, enhanced image processing algorithms, and more biocompatible materials for implants. The competitive advantage lies in the ability to restore a more natural visual field, distinguish shapes and colors, and integrate seamlessly with the user's visual cortex. Companies are differentiating themselves through the development of next-generation bionic eyes that offer higher resolution, wider fields of vision, and more intuitive control. Applications range from restoring vision for individuals with severe forms of blindness due to conditions like dry AMD and retinitis pigmentosa to potentially aiding in rehabilitation after other eye injuries.
Key Drivers, Barriers & Challenges in Bionic Eyes Market
The Bionic Eyes Market is propelled by significant growth drivers, chief among them being the rapid advancements in bioelectronic and microelectronic technologies, enabling the development of more sophisticated and effective bionic eye systems. The increasing global prevalence of vision-impairing diseases, particularly among the aging population, creates a substantial and growing patient pool. Furthermore, growing awareness and acceptance of bionic vision as a viable treatment option among patients and healthcare providers, coupled with supportive government initiatives and funding for R&D in regenerative medicine and assistive technologies, are crucial accelerators. The potential to significantly improve the quality of life for individuals suffering from blindness fuels ongoing investment and innovation.
However, the market faces considerable barriers and challenges. The high cost of bionic eye implantation and related procedures presents a significant affordability hurdle for many patients, limiting market penetration. Stringent regulatory approval processes for novel medical devices, while ensuring safety and efficacy, can be time-consuming and expensive. Complex surgical procedures and the need for specialized training for surgeons and healthcare professionals pose logistical challenges. Limited long-term data on the efficacy and durability of bionic eye implants, despite promising early results, can create hesitancy among some patients and payers. Finally, reimbursement policies in many regions are still evolving, which can impact the widespread adoption of these advanced technologies.
Growth Drivers in the Bionic Eyes Market Market
Key growth drivers in the Bionic Eyes Market are multifaceted, encompassing technological, economic, and regulatory factors. Technologically, breakthroughs in miniaturization, AI-powered image processing, and neural interface development are continually enhancing the capabilities of bionic eyes. Economically, the rising global healthcare expenditure, coupled with an increasing disposable income in developed nations, is making advanced medical treatments more accessible. Regulatory bodies are increasingly recognizing the therapeutic potential of bionic eyes, leading to more streamlined approval pathways for innovative devices. The growing demand for improved quality of life among individuals suffering from irreversible blindness is a powerful societal driver.
Challenges Impacting Bionic Eyes Market Growth
Challenges impacting Bionic Eyes Market growth are significant and require strategic mitigation. The prohibitive cost of bionic eye systems and associated surgical interventions remains a primary restraint, limiting accessibility for a large segment of the potential patient population. Complex and lengthy regulatory approval processes for novel medical technologies can impede the timely introduction of groundbreaking innovations to the market. Supply chain complexities for specialized components and the need for a highly skilled workforce for implantation and post-operative care add further pressure. Competitive pressures from both established medical device manufacturers and emerging biotech startups necessitate continuous innovation and differentiation.
Key Players Shaping the Bionic Eyes Market Market
- Pixium Vision S A
- Nidek Co Ltd
- iBionics
- Monash Vision Group
- Bionic Vision Technologies
- Vivani Medical Inc
- Nano Retina Ltd
- Optobionics Corporation
Significant Bionic Eyes Market Industry Milestones
- July 2022: Pixium Vision SA initiated the PRIMAvera pivotal trial in atrophic dry age-related macular degeneration (dry AMD) with the first patient implantation in the Netherlands, following approval by the Dutch Ministry of Health and the opening of the first clinical site at the Rotterdam Eye Hospital. This marked a crucial step towards demonstrating the efficacy of their bionic vision system for dry AMD patients.
- January 2022: The first patient received the Prima System bionic eye implant developed by Pixium Vision in France, offering partial vision restoration for individuals with geographic atrophy (GA), the most common form of dry AMD, signifying a significant advancement in restoring sight for this patient population.
Future Outlook for Bionic Eyes Market Market
The future outlook for the Bionic Eyes Market is exceptionally promising, driven by continuous technological innovation and a growing unmet need for effective vision restoration solutions. Strategic opportunities lie in developing more affordable and accessible bionic eye systems, expanding clinical trials to cover a broader range of indications, and fostering stronger collaborations between research institutions, manufacturers, and healthcare providers. Market potential is immense, with the increasing aging global population and the rising prevalence of conditions like dry AMD creating a substantial and expanding patient base. We project the market to witness sustained double-digit growth as these life-changing technologies become more refined, clinically validated, and widely adopted, ultimately offering renewed hope and improved quality of life to millions worldwide.
Bionic Eyes Market Segmentation
-
1. Type
- 1.1. External Eye
- 1.2. Implanted Eye
-
2. Technology
- 2.1. Mechanical
- 2.2. Electronic
-
3. Indication
- 3.1. Vision Loss and Impairment
- 3.2. Dry Age-related Macular Degeneration (dry AMD)
- 3.3. Others
-
4. End User
- 4.1. Hospitals
- 4.2. Ophthalmic Clinics
- 4.3. Others
Bionic Eyes Market Segmentation By Geography
-
1. North America
- 1.1. United States
- 1.2. Canada
- 1.3. Mexico
-
2. Europe
- 2.1. United Kingdom
- 2.2. France
- 2.3. Germany
- 2.4. Italy
- 2.5. Spain
- 2.6. Rest of Europe
-
3. Asia Pacific
- 3.1. India
- 3.2. China
- 3.3. Japan
- 3.4. Australia
- 3.5. South Korea
- 3.6. Rest of Asia Pacific
-
4. Middle East and Africa
- 4.1. GCC
- 4.2. South Africa
- 4.3. Rest of Middle East and Africa
-
5. South America
- 5.1. Brazil
- 5.2. Argentina
- 5.3. Rest of South America
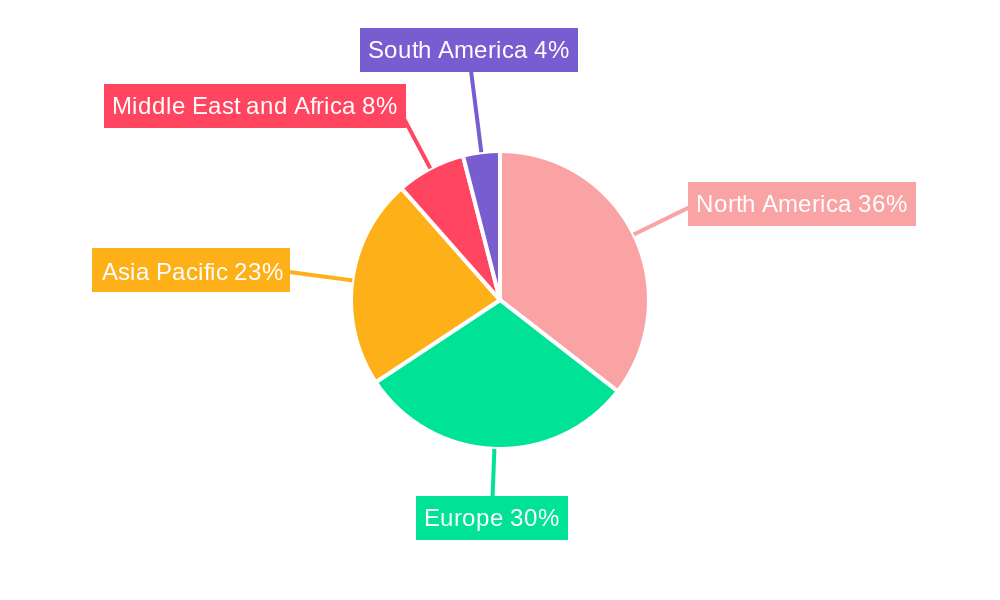
Bionic Eyes Market Regional Market Share
Geographic Coverage of Bionic Eyes Market
Bionic Eyes Market REPORT HIGHLIGHTS
| Aspects | Details |
|---|---|
| Study Period | 2020-2034 |
| Base Year | 2025 |
| Estimated Year | 2026 |
| Forecast Period | 2026-2034 |
| Historical Period | 2020-2025 |
| Growth Rate | CAGR of 12.97% from 2020-2034 |
| Segmentation |
|
Table of Contents
- 1. Introduction
- 1.1. Research Scope
- 1.2. Market Segmentation
- 1.3. Research Methodology
- 1.4. Definitions and Assumptions
- 2. Executive Summary
- 2.1. Introduction
- 3. Market Dynamics
- 3.1. Introduction
- 3.2. Market Drivers
- 3.2.1. Growing Prevalence of Vision Loss and Other Chronic Eye Diseases; Increasing Funding by Private and Public Organizations; Rapid Advancements in Technological Developments
- 3.3. Market Restrains
- 3.3.1. High Research and Development Costs; Low Awareness Among Target Population Regarding Available Products
- 3.4. Market Trends
- 3.4.1. Implanted Eye Segment is Predicted to Grow Significantly Over the Forecast Period
- 4. Market Factor Analysis
- 4.1. Porters Five Forces
- 4.2. Supply/Value Chain
- 4.3. PESTEL analysis
- 4.4. Market Entropy
- 4.5. Patent/Trademark Analysis
- 5. Global Bionic Eyes Market Analysis, Insights and Forecast, 2020-2032
- 5.1. Market Analysis, Insights and Forecast - by Type
- 5.1.1. External Eye
- 5.1.2. Implanted Eye
- 5.2. Market Analysis, Insights and Forecast - by Technology
- 5.2.1. Mechanical
- 5.2.2. Electronic
- 5.3. Market Analysis, Insights and Forecast - by Indication
- 5.3.1. Vision Loss and Impairment
- 5.3.2. Dry Age-related Macular Degeneration (dry AMD)
- 5.3.3. Others
- 5.4. Market Analysis, Insights and Forecast - by End User
- 5.4.1. Hospitals
- 5.4.2. Ophthalmic Clinics
- 5.4.3. Others
- 5.5. Market Analysis, Insights and Forecast - by Region
- 5.5.1. North America
- 5.5.2. Europe
- 5.5.3. Asia Pacific
- 5.5.4. Middle East and Africa
- 5.5.5. South America
- 5.1. Market Analysis, Insights and Forecast - by Type
- 6. North America Bionic Eyes Market Analysis, Insights and Forecast, 2020-2032
- 6.1. Market Analysis, Insights and Forecast - by Type
- 6.1.1. External Eye
- 6.1.2. Implanted Eye
- 6.2. Market Analysis, Insights and Forecast - by Technology
- 6.2.1. Mechanical
- 6.2.2. Electronic
- 6.3. Market Analysis, Insights and Forecast - by Indication
- 6.3.1. Vision Loss and Impairment
- 6.3.2. Dry Age-related Macular Degeneration (dry AMD)
- 6.3.3. Others
- 6.4. Market Analysis, Insights and Forecast - by End User
- 6.4.1. Hospitals
- 6.4.2. Ophthalmic Clinics
- 6.4.3. Others
- 6.1. Market Analysis, Insights and Forecast - by Type
- 7. Europe Bionic Eyes Market Analysis, Insights and Forecast, 2020-2032
- 7.1. Market Analysis, Insights and Forecast - by Type
- 7.1.1. External Eye
- 7.1.2. Implanted Eye
- 7.2. Market Analysis, Insights and Forecast - by Technology
- 7.2.1. Mechanical
- 7.2.2. Electronic
- 7.3. Market Analysis, Insights and Forecast - by Indication
- 7.3.1. Vision Loss and Impairment
- 7.3.2. Dry Age-related Macular Degeneration (dry AMD)
- 7.3.3. Others
- 7.4. Market Analysis, Insights and Forecast - by End User
- 7.4.1. Hospitals
- 7.4.2. Ophthalmic Clinics
- 7.4.3. Others
- 7.1. Market Analysis, Insights and Forecast - by Type
- 8. Asia Pacific Bionic Eyes Market Analysis, Insights and Forecast, 2020-2032
- 8.1. Market Analysis, Insights and Forecast - by Type
- 8.1.1. External Eye
- 8.1.2. Implanted Eye
- 8.2. Market Analysis, Insights and Forecast - by Technology
- 8.2.1. Mechanical
- 8.2.2. Electronic
- 8.3. Market Analysis, Insights and Forecast - by Indication
- 8.3.1. Vision Loss and Impairment
- 8.3.2. Dry Age-related Macular Degeneration (dry AMD)
- 8.3.3. Others
- 8.4. Market Analysis, Insights and Forecast - by End User
- 8.4.1. Hospitals
- 8.4.2. Ophthalmic Clinics
- 8.4.3. Others
- 8.1. Market Analysis, Insights and Forecast - by Type
- 9. Middle East and Africa Bionic Eyes Market Analysis, Insights and Forecast, 2020-2032
- 9.1. Market Analysis, Insights and Forecast - by Type
- 9.1.1. External Eye
- 9.1.2. Implanted Eye
- 9.2. Market Analysis, Insights and Forecast - by Technology
- 9.2.1. Mechanical
- 9.2.2. Electronic
- 9.3. Market Analysis, Insights and Forecast - by Indication
- 9.3.1. Vision Loss and Impairment
- 9.3.2. Dry Age-related Macular Degeneration (dry AMD)
- 9.3.3. Others
- 9.4. Market Analysis, Insights and Forecast - by End User
- 9.4.1. Hospitals
- 9.4.2. Ophthalmic Clinics
- 9.4.3. Others
- 9.1. Market Analysis, Insights and Forecast - by Type
- 10. South America Bionic Eyes Market Analysis, Insights and Forecast, 2020-2032
- 10.1. Market Analysis, Insights and Forecast - by Type
- 10.1.1. External Eye
- 10.1.2. Implanted Eye
- 10.2. Market Analysis, Insights and Forecast - by Technology
- 10.2.1. Mechanical
- 10.2.2. Electronic
- 10.3. Market Analysis, Insights and Forecast - by Indication
- 10.3.1. Vision Loss and Impairment
- 10.3.2. Dry Age-related Macular Degeneration (dry AMD)
- 10.3.3. Others
- 10.4. Market Analysis, Insights and Forecast - by End User
- 10.4.1. Hospitals
- 10.4.2. Ophthalmic Clinics
- 10.4.3. Others
- 10.1. Market Analysis, Insights and Forecast - by Type
- 11. North America Bionic Eyes Market Analysis, Insights and Forecast, 2020-2032
- 11.1. Market Analysis, Insights and Forecast - By Country/Sub-region
- 11.1.1 United States
- 11.1.2 Canada
- 11.1.3 Mexico
- 12. Europe Bionic Eyes Market Analysis, Insights and Forecast, 2020-2032
- 12.1. Market Analysis, Insights and Forecast - By Country/Sub-region
- 12.1.1 United Kingdom
- 12.1.2 France
- 12.1.3 Germany
- 12.1.4 Italy
- 12.1.5 Spain
- 12.1.6 Rest of Europe
- 13. Asia Pacific Bionic Eyes Market Analysis, Insights and Forecast, 2020-2032
- 13.1. Market Analysis, Insights and Forecast - By Country/Sub-region
- 13.1.1 India
- 13.1.2 China
- 13.1.3 Japan
- 13.1.4 Australia
- 13.1.5 South Korea
- 13.1.6 Rest of Asia Pacific
- 14. Middle East and Africa Bionic Eyes Market Analysis, Insights and Forecast, 2020-2032
- 14.1. Market Analysis, Insights and Forecast - By Country/Sub-region
- 14.1.1 GCC
- 14.1.2 South Africa
- 14.1.3 Rest of Middle East and Africa
- 15. South America Bionic Eyes Market Analysis, Insights and Forecast, 2020-2032
- 15.1. Market Analysis, Insights and Forecast - By Country/Sub-region
- 15.1.1 Brazil
- 15.1.2 Argentina
- 15.1.3 Rest of South America
- 16. Competitive Analysis
- 16.1. Global Market Share Analysis 2025
- 16.2. Company Profiles
- 16.2.1 Pixium Vision S A
- 16.2.1.1. Overview
- 16.2.1.2. Products
- 16.2.1.3. SWOT Analysis
- 16.2.1.4. Recent Developments
- 16.2.1.5. Financials (Based on Availability)
- 16.2.2 Nidek Co Ltd
- 16.2.2.1. Overview
- 16.2.2.2. Products
- 16.2.2.3. SWOT Analysis
- 16.2.2.4. Recent Developments
- 16.2.2.5. Financials (Based on Availability)
- 16.2.3 iBionics
- 16.2.3.1. Overview
- 16.2.3.2. Products
- 16.2.3.3. SWOT Analysis
- 16.2.3.4. Recent Developments
- 16.2.3.5. Financials (Based on Availability)
- 16.2.4 Monash Vision Group
- 16.2.4.1. Overview
- 16.2.4.2. Products
- 16.2.4.3. SWOT Analysis
- 16.2.4.4. Recent Developments
- 16.2.4.5. Financials (Based on Availability)
- 16.2.5 Bionic Vision Technologies
- 16.2.5.1. Overview
- 16.2.5.2. Products
- 16.2.5.3. SWOT Analysis
- 16.2.5.4. Recent Developments
- 16.2.5.5. Financials (Based on Availability)
- 16.2.6 Vivani Medical Inc
- 16.2.6.1. Overview
- 16.2.6.2. Products
- 16.2.6.3. SWOT Analysis
- 16.2.6.4. Recent Developments
- 16.2.6.5. Financials (Based on Availability)
- 16.2.7 Nano Retina Ltd
- 16.2.7.1. Overview
- 16.2.7.2. Products
- 16.2.7.3. SWOT Analysis
- 16.2.7.4. Recent Developments
- 16.2.7.5. Financials (Based on Availability)
- 16.2.8 Optobionics Corporation
- 16.2.8.1. Overview
- 16.2.8.2. Products
- 16.2.8.3. SWOT Analysis
- 16.2.8.4. Recent Developments
- 16.2.8.5. Financials (Based on Availability)
- 16.2.1 Pixium Vision S A
List of Figures
- Figure 1: Global Bionic Eyes Market Revenue Breakdown (Million, %) by Region 2025 & 2033
- Figure 2: Global Bionic Eyes Market Volume Breakdown (K Unit, %) by Region 2025 & 2033
- Figure 3: North America Bionic Eyes Market Revenue (Million), by Country 2025 & 2033
- Figure 4: North America Bionic Eyes Market Volume (K Unit), by Country 2025 & 2033
- Figure 5: North America Bionic Eyes Market Revenue Share (%), by Country 2025 & 2033
- Figure 6: North America Bionic Eyes Market Volume Share (%), by Country 2025 & 2033
- Figure 7: Europe Bionic Eyes Market Revenue (Million), by Country 2025 & 2033
- Figure 8: Europe Bionic Eyes Market Volume (K Unit), by Country 2025 & 2033
- Figure 9: Europe Bionic Eyes Market Revenue Share (%), by Country 2025 & 2033
- Figure 10: Europe Bionic Eyes Market Volume Share (%), by Country 2025 & 2033
- Figure 11: Asia Pacific Bionic Eyes Market Revenue (Million), by Country 2025 & 2033
- Figure 12: Asia Pacific Bionic Eyes Market Volume (K Unit), by Country 2025 & 2033
- Figure 13: Asia Pacific Bionic Eyes Market Revenue Share (%), by Country 2025 & 2033
- Figure 14: Asia Pacific Bionic Eyes Market Volume Share (%), by Country 2025 & 2033
- Figure 15: Middle East and Africa Bionic Eyes Market Revenue (Million), by Country 2025 & 2033
- Figure 16: Middle East and Africa Bionic Eyes Market Volume (K Unit), by Country 2025 & 2033
- Figure 17: Middle East and Africa Bionic Eyes Market Revenue Share (%), by Country 2025 & 2033
- Figure 18: Middle East and Africa Bionic Eyes Market Volume Share (%), by Country 2025 & 2033
- Figure 19: South America Bionic Eyes Market Revenue (Million), by Country 2025 & 2033
- Figure 20: South America Bionic Eyes Market Volume (K Unit), by Country 2025 & 2033
- Figure 21: South America Bionic Eyes Market Revenue Share (%), by Country 2025 & 2033
- Figure 22: South America Bionic Eyes Market Volume Share (%), by Country 2025 & 2033
- Figure 23: North America Bionic Eyes Market Revenue (Million), by Type 2025 & 2033
- Figure 24: North America Bionic Eyes Market Volume (K Unit), by Type 2025 & 2033
- Figure 25: North America Bionic Eyes Market Revenue Share (%), by Type 2025 & 2033
- Figure 26: North America Bionic Eyes Market Volume Share (%), by Type 2025 & 2033
- Figure 27: North America Bionic Eyes Market Revenue (Million), by Technology 2025 & 2033
- Figure 28: North America Bionic Eyes Market Volume (K Unit), by Technology 2025 & 2033
- Figure 29: North America Bionic Eyes Market Revenue Share (%), by Technology 2025 & 2033
- Figure 30: North America Bionic Eyes Market Volume Share (%), by Technology 2025 & 2033
- Figure 31: North America Bionic Eyes Market Revenue (Million), by Indication 2025 & 2033
- Figure 32: North America Bionic Eyes Market Volume (K Unit), by Indication 2025 & 2033
- Figure 33: North America Bionic Eyes Market Revenue Share (%), by Indication 2025 & 2033
- Figure 34: North America Bionic Eyes Market Volume Share (%), by Indication 2025 & 2033
- Figure 35: North America Bionic Eyes Market Revenue (Million), by End User 2025 & 2033
- Figure 36: North America Bionic Eyes Market Volume (K Unit), by End User 2025 & 2033
- Figure 37: North America Bionic Eyes Market Revenue Share (%), by End User 2025 & 2033
- Figure 38: North America Bionic Eyes Market Volume Share (%), by End User 2025 & 2033
- Figure 39: North America Bionic Eyes Market Revenue (Million), by Country 2025 & 2033
- Figure 40: North America Bionic Eyes Market Volume (K Unit), by Country 2025 & 2033
- Figure 41: North America Bionic Eyes Market Revenue Share (%), by Country 2025 & 2033
- Figure 42: North America Bionic Eyes Market Volume Share (%), by Country 2025 & 2033
- Figure 43: Europe Bionic Eyes Market Revenue (Million), by Type 2025 & 2033
- Figure 44: Europe Bionic Eyes Market Volume (K Unit), by Type 2025 & 2033
- Figure 45: Europe Bionic Eyes Market Revenue Share (%), by Type 2025 & 2033
- Figure 46: Europe Bionic Eyes Market Volume Share (%), by Type 2025 & 2033
- Figure 47: Europe Bionic Eyes Market Revenue (Million), by Technology 2025 & 2033
- Figure 48: Europe Bionic Eyes Market Volume (K Unit), by Technology 2025 & 2033
- Figure 49: Europe Bionic Eyes Market Revenue Share (%), by Technology 2025 & 2033
- Figure 50: Europe Bionic Eyes Market Volume Share (%), by Technology 2025 & 2033
- Figure 51: Europe Bionic Eyes Market Revenue (Million), by Indication 2025 & 2033
- Figure 52: Europe Bionic Eyes Market Volume (K Unit), by Indication 2025 & 2033
- Figure 53: Europe Bionic Eyes Market Revenue Share (%), by Indication 2025 & 2033
- Figure 54: Europe Bionic Eyes Market Volume Share (%), by Indication 2025 & 2033
- Figure 55: Europe Bionic Eyes Market Revenue (Million), by End User 2025 & 2033
- Figure 56: Europe Bionic Eyes Market Volume (K Unit), by End User 2025 & 2033
- Figure 57: Europe Bionic Eyes Market Revenue Share (%), by End User 2025 & 2033
- Figure 58: Europe Bionic Eyes Market Volume Share (%), by End User 2025 & 2033
- Figure 59: Europe Bionic Eyes Market Revenue (Million), by Country 2025 & 2033
- Figure 60: Europe Bionic Eyes Market Volume (K Unit), by Country 2025 & 2033
- Figure 61: Europe Bionic Eyes Market Revenue Share (%), by Country 2025 & 2033
- Figure 62: Europe Bionic Eyes Market Volume Share (%), by Country 2025 & 2033
- Figure 63: Asia Pacific Bionic Eyes Market Revenue (Million), by Type 2025 & 2033
- Figure 64: Asia Pacific Bionic Eyes Market Volume (K Unit), by Type 2025 & 2033
- Figure 65: Asia Pacific Bionic Eyes Market Revenue Share (%), by Type 2025 & 2033
- Figure 66: Asia Pacific Bionic Eyes Market Volume Share (%), by Type 2025 & 2033
- Figure 67: Asia Pacific Bionic Eyes Market Revenue (Million), by Technology 2025 & 2033
- Figure 68: Asia Pacific Bionic Eyes Market Volume (K Unit), by Technology 2025 & 2033
- Figure 69: Asia Pacific Bionic Eyes Market Revenue Share (%), by Technology 2025 & 2033
- Figure 70: Asia Pacific Bionic Eyes Market Volume Share (%), by Technology 2025 & 2033
- Figure 71: Asia Pacific Bionic Eyes Market Revenue (Million), by Indication 2025 & 2033
- Figure 72: Asia Pacific Bionic Eyes Market Volume (K Unit), by Indication 2025 & 2033
- Figure 73: Asia Pacific Bionic Eyes Market Revenue Share (%), by Indication 2025 & 2033
- Figure 74: Asia Pacific Bionic Eyes Market Volume Share (%), by Indication 2025 & 2033
- Figure 75: Asia Pacific Bionic Eyes Market Revenue (Million), by End User 2025 & 2033
- Figure 76: Asia Pacific Bionic Eyes Market Volume (K Unit), by End User 2025 & 2033
- Figure 77: Asia Pacific Bionic Eyes Market Revenue Share (%), by End User 2025 & 2033
- Figure 78: Asia Pacific Bionic Eyes Market Volume Share (%), by End User 2025 & 2033
- Figure 79: Asia Pacific Bionic Eyes Market Revenue (Million), by Country 2025 & 2033
- Figure 80: Asia Pacific Bionic Eyes Market Volume (K Unit), by Country 2025 & 2033
- Figure 81: Asia Pacific Bionic Eyes Market Revenue Share (%), by Country 2025 & 2033
- Figure 82: Asia Pacific Bionic Eyes Market Volume Share (%), by Country 2025 & 2033
- Figure 83: Middle East and Africa Bionic Eyes Market Revenue (Million), by Type 2025 & 2033
- Figure 84: Middle East and Africa Bionic Eyes Market Volume (K Unit), by Type 2025 & 2033
- Figure 85: Middle East and Africa Bionic Eyes Market Revenue Share (%), by Type 2025 & 2033
- Figure 86: Middle East and Africa Bionic Eyes Market Volume Share (%), by Type 2025 & 2033
- Figure 87: Middle East and Africa Bionic Eyes Market Revenue (Million), by Technology 2025 & 2033
- Figure 88: Middle East and Africa Bionic Eyes Market Volume (K Unit), by Technology 2025 & 2033
- Figure 89: Middle East and Africa Bionic Eyes Market Revenue Share (%), by Technology 2025 & 2033
- Figure 90: Middle East and Africa Bionic Eyes Market Volume Share (%), by Technology 2025 & 2033
- Figure 91: Middle East and Africa Bionic Eyes Market Revenue (Million), by Indication 2025 & 2033
- Figure 92: Middle East and Africa Bionic Eyes Market Volume (K Unit), by Indication 2025 & 2033
- Figure 93: Middle East and Africa Bionic Eyes Market Revenue Share (%), by Indication 2025 & 2033
- Figure 94: Middle East and Africa Bionic Eyes Market Volume Share (%), by Indication 2025 & 2033
- Figure 95: Middle East and Africa Bionic Eyes Market Revenue (Million), by End User 2025 & 2033
- Figure 96: Middle East and Africa Bionic Eyes Market Volume (K Unit), by End User 2025 & 2033
- Figure 97: Middle East and Africa Bionic Eyes Market Revenue Share (%), by End User 2025 & 2033
- Figure 98: Middle East and Africa Bionic Eyes Market Volume Share (%), by End User 2025 & 2033
- Figure 99: Middle East and Africa Bionic Eyes Market Revenue (Million), by Country 2025 & 2033
- Figure 100: Middle East and Africa Bionic Eyes Market Volume (K Unit), by Country 2025 & 2033
- Figure 101: Middle East and Africa Bionic Eyes Market Revenue Share (%), by Country 2025 & 2033
- Figure 102: Middle East and Africa Bionic Eyes Market Volume Share (%), by Country 2025 & 2033
- Figure 103: South America Bionic Eyes Market Revenue (Million), by Type 2025 & 2033
- Figure 104: South America Bionic Eyes Market Volume (K Unit), by Type 2025 & 2033
- Figure 105: South America Bionic Eyes Market Revenue Share (%), by Type 2025 & 2033
- Figure 106: South America Bionic Eyes Market Volume Share (%), by Type 2025 & 2033
- Figure 107: South America Bionic Eyes Market Revenue (Million), by Technology 2025 & 2033
- Figure 108: South America Bionic Eyes Market Volume (K Unit), by Technology 2025 & 2033
- Figure 109: South America Bionic Eyes Market Revenue Share (%), by Technology 2025 & 2033
- Figure 110: South America Bionic Eyes Market Volume Share (%), by Technology 2025 & 2033
- Figure 111: South America Bionic Eyes Market Revenue (Million), by Indication 2025 & 2033
- Figure 112: South America Bionic Eyes Market Volume (K Unit), by Indication 2025 & 2033
- Figure 113: South America Bionic Eyes Market Revenue Share (%), by Indication 2025 & 2033
- Figure 114: South America Bionic Eyes Market Volume Share (%), by Indication 2025 & 2033
- Figure 115: South America Bionic Eyes Market Revenue (Million), by End User 2025 & 2033
- Figure 116: South America Bionic Eyes Market Volume (K Unit), by End User 2025 & 2033
- Figure 117: South America Bionic Eyes Market Revenue Share (%), by End User 2025 & 2033
- Figure 118: South America Bionic Eyes Market Volume Share (%), by End User 2025 & 2033
- Figure 119: South America Bionic Eyes Market Revenue (Million), by Country 2025 & 2033
- Figure 120: South America Bionic Eyes Market Volume (K Unit), by Country 2025 & 2033
- Figure 121: South America Bionic Eyes Market Revenue Share (%), by Country 2025 & 2033
- Figure 122: South America Bionic Eyes Market Volume Share (%), by Country 2025 & 2033
List of Tables
- Table 1: Global Bionic Eyes Market Revenue Million Forecast, by Region 2020 & 2033
- Table 2: Global Bionic Eyes Market Volume K Unit Forecast, by Region 2020 & 2033
- Table 3: Global Bionic Eyes Market Revenue Million Forecast, by Type 2020 & 2033
- Table 4: Global Bionic Eyes Market Volume K Unit Forecast, by Type 2020 & 2033
- Table 5: Global Bionic Eyes Market Revenue Million Forecast, by Technology 2020 & 2033
- Table 6: Global Bionic Eyes Market Volume K Unit Forecast, by Technology 2020 & 2033
- Table 7: Global Bionic Eyes Market Revenue Million Forecast, by Indication 2020 & 2033
- Table 8: Global Bionic Eyes Market Volume K Unit Forecast, by Indication 2020 & 2033
- Table 9: Global Bionic Eyes Market Revenue Million Forecast, by End User 2020 & 2033
- Table 10: Global Bionic Eyes Market Volume K Unit Forecast, by End User 2020 & 2033
- Table 11: Global Bionic Eyes Market Revenue Million Forecast, by Region 2020 & 2033
- Table 12: Global Bionic Eyes Market Volume K Unit Forecast, by Region 2020 & 2033
- Table 13: Global Bionic Eyes Market Revenue Million Forecast, by Country 2020 & 2033
- Table 14: Global Bionic Eyes Market Volume K Unit Forecast, by Country 2020 & 2033
- Table 15: United States Bionic Eyes Market Revenue (Million) Forecast, by Application 2020 & 2033
- Table 16: United States Bionic Eyes Market Volume (K Unit) Forecast, by Application 2020 & 2033
- Table 17: Canada Bionic Eyes Market Revenue (Million) Forecast, by Application 2020 & 2033
- Table 18: Canada Bionic Eyes Market Volume (K Unit) Forecast, by Application 2020 & 2033
- Table 19: Mexico Bionic Eyes Market Revenue (Million) Forecast, by Application 2020 & 2033
- Table 20: Mexico Bionic Eyes Market Volume (K Unit) Forecast, by Application 2020 & 2033
- Table 21: Global Bionic Eyes Market Revenue Million Forecast, by Country 2020 & 2033
- Table 22: Global Bionic Eyes Market Volume K Unit Forecast, by Country 2020 & 2033
- Table 23: United Kingdom Bionic Eyes Market Revenue (Million) Forecast, by Application 2020 & 2033
- Table 24: United Kingdom Bionic Eyes Market Volume (K Unit) Forecast, by Application 2020 & 2033
- Table 25: France Bionic Eyes Market Revenue (Million) Forecast, by Application 2020 & 2033
- Table 26: France Bionic Eyes Market Volume (K Unit) Forecast, by Application 2020 & 2033
- Table 27: Germany Bionic Eyes Market Revenue (Million) Forecast, by Application 2020 & 2033
- Table 28: Germany Bionic Eyes Market Volume (K Unit) Forecast, by Application 2020 & 2033
- Table 29: Italy Bionic Eyes Market Revenue (Million) Forecast, by Application 2020 & 2033
- Table 30: Italy Bionic Eyes Market Volume (K Unit) Forecast, by Application 2020 & 2033
- Table 31: Spain Bionic Eyes Market Revenue (Million) Forecast, by Application 2020 & 2033
- Table 32: Spain Bionic Eyes Market Volume (K Unit) Forecast, by Application 2020 & 2033
- Table 33: Rest of Europe Bionic Eyes Market Revenue (Million) Forecast, by Application 2020 & 2033
- Table 34: Rest of Europe Bionic Eyes Market Volume (K Unit) Forecast, by Application 2020 & 2033
- Table 35: Global Bionic Eyes Market Revenue Million Forecast, by Country 2020 & 2033
- Table 36: Global Bionic Eyes Market Volume K Unit Forecast, by Country 2020 & 2033
- Table 37: India Bionic Eyes Market Revenue (Million) Forecast, by Application 2020 & 2033
- Table 38: India Bionic Eyes Market Volume (K Unit) Forecast, by Application 2020 & 2033
- Table 39: China Bionic Eyes Market Revenue (Million) Forecast, by Application 2020 & 2033
- Table 40: China Bionic Eyes Market Volume (K Unit) Forecast, by Application 2020 & 2033
- Table 41: Japan Bionic Eyes Market Revenue (Million) Forecast, by Application 2020 & 2033
- Table 42: Japan Bionic Eyes Market Volume (K Unit) Forecast, by Application 2020 & 2033
- Table 43: Australia Bionic Eyes Market Revenue (Million) Forecast, by Application 2020 & 2033
- Table 44: Australia Bionic Eyes Market Volume (K Unit) Forecast, by Application 2020 & 2033
- Table 45: South Korea Bionic Eyes Market Revenue (Million) Forecast, by Application 2020 & 2033
- Table 46: South Korea Bionic Eyes Market Volume (K Unit) Forecast, by Application 2020 & 2033
- Table 47: Rest of Asia Pacific Bionic Eyes Market Revenue (Million) Forecast, by Application 2020 & 2033
- Table 48: Rest of Asia Pacific Bionic Eyes Market Volume (K Unit) Forecast, by Application 2020 & 2033
- Table 49: Global Bionic Eyes Market Revenue Million Forecast, by Country 2020 & 2033
- Table 50: Global Bionic Eyes Market Volume K Unit Forecast, by Country 2020 & 2033
- Table 51: GCC Bionic Eyes Market Revenue (Million) Forecast, by Application 2020 & 2033
- Table 52: GCC Bionic Eyes Market Volume (K Unit) Forecast, by Application 2020 & 2033
- Table 53: South Africa Bionic Eyes Market Revenue (Million) Forecast, by Application 2020 & 2033
- Table 54: South Africa Bionic Eyes Market Volume (K Unit) Forecast, by Application 2020 & 2033
- Table 55: Rest of Middle East and Africa Bionic Eyes Market Revenue (Million) Forecast, by Application 2020 & 2033
- Table 56: Rest of Middle East and Africa Bionic Eyes Market Volume (K Unit) Forecast, by Application 2020 & 2033
- Table 57: Global Bionic Eyes Market Revenue Million Forecast, by Country 2020 & 2033
- Table 58: Global Bionic Eyes Market Volume K Unit Forecast, by Country 2020 & 2033
- Table 59: Brazil Bionic Eyes Market Revenue (Million) Forecast, by Application 2020 & 2033
- Table 60: Brazil Bionic Eyes Market Volume (K Unit) Forecast, by Application 2020 & 2033
- Table 61: Argentina Bionic Eyes Market Revenue (Million) Forecast, by Application 2020 & 2033
- Table 62: Argentina Bionic Eyes Market Volume (K Unit) Forecast, by Application 2020 & 2033
- Table 63: Rest of South America Bionic Eyes Market Revenue (Million) Forecast, by Application 2020 & 2033
- Table 64: Rest of South America Bionic Eyes Market Volume (K Unit) Forecast, by Application 2020 & 2033
- Table 65: Global Bionic Eyes Market Revenue Million Forecast, by Type 2020 & 2033
- Table 66: Global Bionic Eyes Market Volume K Unit Forecast, by Type 2020 & 2033
- Table 67: Global Bionic Eyes Market Revenue Million Forecast, by Technology 2020 & 2033
- Table 68: Global Bionic Eyes Market Volume K Unit Forecast, by Technology 2020 & 2033
- Table 69: Global Bionic Eyes Market Revenue Million Forecast, by Indication 2020 & 2033
- Table 70: Global Bionic Eyes Market Volume K Unit Forecast, by Indication 2020 & 2033
- Table 71: Global Bionic Eyes Market Revenue Million Forecast, by End User 2020 & 2033
- Table 72: Global Bionic Eyes Market Volume K Unit Forecast, by End User 2020 & 2033
- Table 73: Global Bionic Eyes Market Revenue Million Forecast, by Country 2020 & 2033
- Table 74: Global Bionic Eyes Market Volume K Unit Forecast, by Country 2020 & 2033
- Table 75: United States Bionic Eyes Market Revenue (Million) Forecast, by Application 2020 & 2033
- Table 76: United States Bionic Eyes Market Volume (K Unit) Forecast, by Application 2020 & 2033
- Table 77: Canada Bionic Eyes Market Revenue (Million) Forecast, by Application 2020 & 2033
- Table 78: Canada Bionic Eyes Market Volume (K Unit) Forecast, by Application 2020 & 2033
- Table 79: Mexico Bionic Eyes Market Revenue (Million) Forecast, by Application 2020 & 2033
- Table 80: Mexico Bionic Eyes Market Volume (K Unit) Forecast, by Application 2020 & 2033
- Table 81: Global Bionic Eyes Market Revenue Million Forecast, by Type 2020 & 2033
- Table 82: Global Bionic Eyes Market Volume K Unit Forecast, by Type 2020 & 2033
- Table 83: Global Bionic Eyes Market Revenue Million Forecast, by Technology 2020 & 2033
- Table 84: Global Bionic Eyes Market Volume K Unit Forecast, by Technology 2020 & 2033
- Table 85: Global Bionic Eyes Market Revenue Million Forecast, by Indication 2020 & 2033
- Table 86: Global Bionic Eyes Market Volume K Unit Forecast, by Indication 2020 & 2033
- Table 87: Global Bionic Eyes Market Revenue Million Forecast, by End User 2020 & 2033
- Table 88: Global Bionic Eyes Market Volume K Unit Forecast, by End User 2020 & 2033
- Table 89: Global Bionic Eyes Market Revenue Million Forecast, by Country 2020 & 2033
- Table 90: Global Bionic Eyes Market Volume K Unit Forecast, by Country 2020 & 2033
- Table 91: United Kingdom Bionic Eyes Market Revenue (Million) Forecast, by Application 2020 & 2033
- Table 92: United Kingdom Bionic Eyes Market Volume (K Unit) Forecast, by Application 2020 & 2033
- Table 93: France Bionic Eyes Market Revenue (Million) Forecast, by Application 2020 & 2033
- Table 94: France Bionic Eyes Market Volume (K Unit) Forecast, by Application 2020 & 2033
- Table 95: Germany Bionic Eyes Market Revenue (Million) Forecast, by Application 2020 & 2033
- Table 96: Germany Bionic Eyes Market Volume (K Unit) Forecast, by Application 2020 & 2033
- Table 97: Italy Bionic Eyes Market Revenue (Million) Forecast, by Application 2020 & 2033
- Table 98: Italy Bionic Eyes Market Volume (K Unit) Forecast, by Application 2020 & 2033
- Table 99: Spain Bionic Eyes Market Revenue (Million) Forecast, by Application 2020 & 2033
- Table 100: Spain Bionic Eyes Market Volume (K Unit) Forecast, by Application 2020 & 2033
- Table 101: Rest of Europe Bionic Eyes Market Revenue (Million) Forecast, by Application 2020 & 2033
- Table 102: Rest of Europe Bionic Eyes Market Volume (K Unit) Forecast, by Application 2020 & 2033
- Table 103: Global Bionic Eyes Market Revenue Million Forecast, by Type 2020 & 2033
- Table 104: Global Bionic Eyes Market Volume K Unit Forecast, by Type 2020 & 2033
- Table 105: Global Bionic Eyes Market Revenue Million Forecast, by Technology 2020 & 2033
- Table 106: Global Bionic Eyes Market Volume K Unit Forecast, by Technology 2020 & 2033
- Table 107: Global Bionic Eyes Market Revenue Million Forecast, by Indication 2020 & 2033
- Table 108: Global Bionic Eyes Market Volume K Unit Forecast, by Indication 2020 & 2033
- Table 109: Global Bionic Eyes Market Revenue Million Forecast, by End User 2020 & 2033
- Table 110: Global Bionic Eyes Market Volume K Unit Forecast, by End User 2020 & 2033
- Table 111: Global Bionic Eyes Market Revenue Million Forecast, by Country 2020 & 2033
- Table 112: Global Bionic Eyes Market Volume K Unit Forecast, by Country 2020 & 2033
- Table 113: India Bionic Eyes Market Revenue (Million) Forecast, by Application 2020 & 2033
- Table 114: India Bionic Eyes Market Volume (K Unit) Forecast, by Application 2020 & 2033
- Table 115: China Bionic Eyes Market Revenue (Million) Forecast, by Application 2020 & 2033
- Table 116: China Bionic Eyes Market Volume (K Unit) Forecast, by Application 2020 & 2033
- Table 117: Japan Bionic Eyes Market Revenue (Million) Forecast, by Application 2020 & 2033
- Table 118: Japan Bionic Eyes Market Volume (K Unit) Forecast, by Application 2020 & 2033
- Table 119: Australia Bionic Eyes Market Revenue (Million) Forecast, by Application 2020 & 2033
- Table 120: Australia Bionic Eyes Market Volume (K Unit) Forecast, by Application 2020 & 2033
- Table 121: South Korea Bionic Eyes Market Revenue (Million) Forecast, by Application 2020 & 2033
- Table 122: South Korea Bionic Eyes Market Volume (K Unit) Forecast, by Application 2020 & 2033
- Table 123: Rest of Asia Pacific Bionic Eyes Market Revenue (Million) Forecast, by Application 2020 & 2033
- Table 124: Rest of Asia Pacific Bionic Eyes Market Volume (K Unit) Forecast, by Application 2020 & 2033
- Table 125: Global Bionic Eyes Market Revenue Million Forecast, by Type 2020 & 2033
- Table 126: Global Bionic Eyes Market Volume K Unit Forecast, by Type 2020 & 2033
- Table 127: Global Bionic Eyes Market Revenue Million Forecast, by Technology 2020 & 2033
- Table 128: Global Bionic Eyes Market Volume K Unit Forecast, by Technology 2020 & 2033
- Table 129: Global Bionic Eyes Market Revenue Million Forecast, by Indication 2020 & 2033
- Table 130: Global Bionic Eyes Market Volume K Unit Forecast, by Indication 2020 & 2033
- Table 131: Global Bionic Eyes Market Revenue Million Forecast, by End User 2020 & 2033
- Table 132: Global Bionic Eyes Market Volume K Unit Forecast, by End User 2020 & 2033
- Table 133: Global Bionic Eyes Market Revenue Million Forecast, by Country 2020 & 2033
- Table 134: Global Bionic Eyes Market Volume K Unit Forecast, by Country 2020 & 2033
- Table 135: GCC Bionic Eyes Market Revenue (Million) Forecast, by Application 2020 & 2033
- Table 136: GCC Bionic Eyes Market Volume (K Unit) Forecast, by Application 2020 & 2033
- Table 137: South Africa Bionic Eyes Market Revenue (Million) Forecast, by Application 2020 & 2033
- Table 138: South Africa Bionic Eyes Market Volume (K Unit) Forecast, by Application 2020 & 2033
- Table 139: Rest of Middle East and Africa Bionic Eyes Market Revenue (Million) Forecast, by Application 2020 & 2033
- Table 140: Rest of Middle East and Africa Bionic Eyes Market Volume (K Unit) Forecast, by Application 2020 & 2033
- Table 141: Global Bionic Eyes Market Revenue Million Forecast, by Type 2020 & 2033
- Table 142: Global Bionic Eyes Market Volume K Unit Forecast, by Type 2020 & 2033
- Table 143: Global Bionic Eyes Market Revenue Million Forecast, by Technology 2020 & 2033
- Table 144: Global Bionic Eyes Market Volume K Unit Forecast, by Technology 2020 & 2033
- Table 145: Global Bionic Eyes Market Revenue Million Forecast, by Indication 2020 & 2033
- Table 146: Global Bionic Eyes Market Volume K Unit Forecast, by Indication 2020 & 2033
- Table 147: Global Bionic Eyes Market Revenue Million Forecast, by End User 2020 & 2033
- Table 148: Global Bionic Eyes Market Volume K Unit Forecast, by End User 2020 & 2033
- Table 149: Global Bionic Eyes Market Revenue Million Forecast, by Country 2020 & 2033
- Table 150: Global Bionic Eyes Market Volume K Unit Forecast, by Country 2020 & 2033
- Table 151: Brazil Bionic Eyes Market Revenue (Million) Forecast, by Application 2020 & 2033
- Table 152: Brazil Bionic Eyes Market Volume (K Unit) Forecast, by Application 2020 & 2033
- Table 153: Argentina Bionic Eyes Market Revenue (Million) Forecast, by Application 2020 & 2033
- Table 154: Argentina Bionic Eyes Market Volume (K Unit) Forecast, by Application 2020 & 2033
- Table 155: Rest of South America Bionic Eyes Market Revenue (Million) Forecast, by Application 2020 & 2033
- Table 156: Rest of South America Bionic Eyes Market Volume (K Unit) Forecast, by Application 2020 & 2033
Frequently Asked Questions
1. What is the projected Compound Annual Growth Rate (CAGR) of the Bionic Eyes Market?
The projected CAGR is approximately 12.97%.
2. Which companies are prominent players in the Bionic Eyes Market?
Key companies in the market include Pixium Vision S A, Nidek Co Ltd, iBionics, Monash Vision Group, Bionic Vision Technologies, Vivani Medical Inc, Nano Retina Ltd, Optobionics Corporation.
3. What are the main segments of the Bionic Eyes Market?
The market segments include Type, Technology, Indication, End User.
4. Can you provide details about the market size?
The market size is estimated to be USD XX Million as of 2022.
5. What are some drivers contributing to market growth?
Growing Prevalence of Vision Loss and Other Chronic Eye Diseases; Increasing Funding by Private and Public Organizations; Rapid Advancements in Technological Developments.
6. What are the notable trends driving market growth?
Implanted Eye Segment is Predicted to Grow Significantly Over the Forecast Period.
7. Are there any restraints impacting market growth?
High Research and Development Costs; Low Awareness Among Target Population Regarding Available Products.
8. Can you provide examples of recent developments in the market?
July 2022: Pixium Vision SA, a bioelectronics company focused on developing bionic vision systems, reported the successful implantation of the first patient in the Netherlands in the PRIMAvera pivotal trial in atrophic dry age-related macular degeneration (dry AMD) following approval of the PRIMAvera study by the Dutch Ministry of Health, Welfare, and Sport and the opening of the first PRIMAvera clinical site in the Netherlands at the Rotterdam Eye Hospital.
9. What pricing options are available for accessing the report?
Pricing options include single-user, multi-user, and enterprise licenses priced at USD 4750, USD 5250, and USD 8750 respectively.
10. Is the market size provided in terms of value or volume?
The market size is provided in terms of value, measured in Million and volume, measured in K Unit.
11. Are there any specific market keywords associated with the report?
Yes, the market keyword associated with the report is "Bionic Eyes Market," which aids in identifying and referencing the specific market segment covered.
12. How do I determine which pricing option suits my needs best?
The pricing options vary based on user requirements and access needs. Individual users may opt for single-user licenses, while businesses requiring broader access may choose multi-user or enterprise licenses for cost-effective access to the report.
13. Are there any additional resources or data provided in the Bionic Eyes Market report?
While the report offers comprehensive insights, it's advisable to review the specific contents or supplementary materials provided to ascertain if additional resources or data are available.
14. How can I stay updated on further developments or reports in the Bionic Eyes Market?
To stay informed about further developments, trends, and reports in the Bionic Eyes Market, consider subscribing to industry newsletters, following relevant companies and organizations, or regularly checking reputable industry news sources and publications.
Methodology
Step 1 - Identification of Relevant Samples Size from Population Database


Step 2 - Approaches for Defining Global Market Size (Value, Volume* & Price*)

Note*: In applicable scenarios
Step 3 - Data Sources
Primary Research
- Web Analytics
- Survey Reports
- Research Institute
- Latest Research Reports
- Opinion Leaders
Secondary Research
- Annual Reports
- White Paper
- Latest Press Release
- Industry Association
- Paid Database
- Investor Presentations

Step 4 - Data Triangulation
Involves using different sources of information in order to increase the validity of a study
These sources are likely to be stakeholders in a program - participants, other researchers, program staff, other community members, and so on.
Then we put all data in single framework & apply various statistical tools to find out the dynamic on the market.
During the analysis stage, feedback from the stakeholder groups would be compared to determine areas of agreement as well as areas of divergence
