

Key Insights
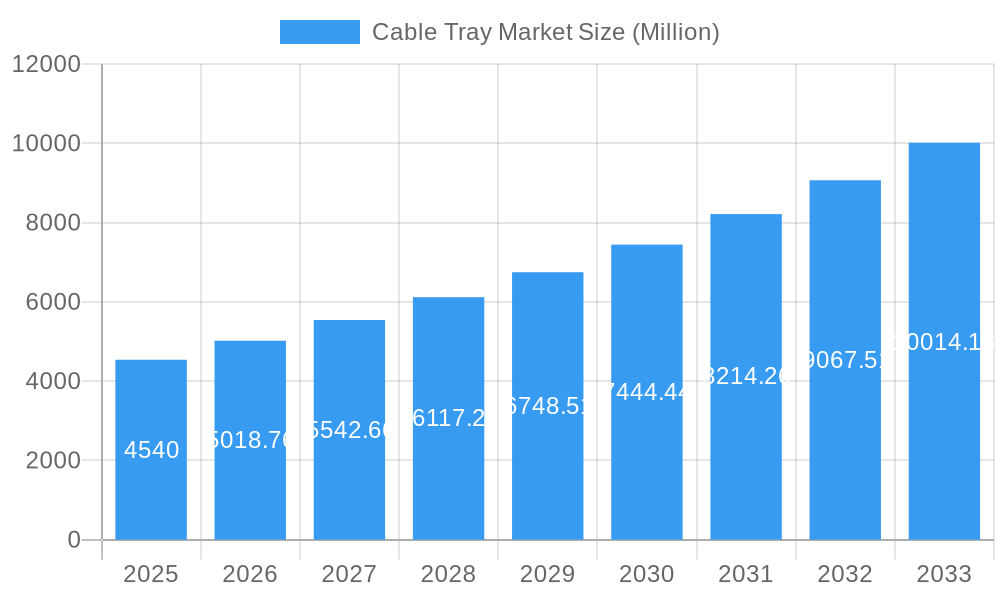
The global cable tray market, valued at $297.35 million in 2025, is poised for substantial expansion. This growth is propelled by increasing infrastructure development across diverse sectors, including industrial automation, smart city initiatives, and the escalating need for reliable power distribution. The market is projected to grow at a compound annual growth rate (CAGR) of 7% from 2025 to 2033, signifying a dynamic market opportunity. Technological advancements are enhancing cable tray systems with improved efficiency, safety, and installation flexibility. The adoption of lightweight, durable materials and modular, pre-fabricated systems is streamlining installations and reducing project costs, further contributing to market growth. Despite potential challenges like fluctuating raw material prices and intense competition, the sustained demand from construction, energy, and telecommunications sectors ensures a positive market outlook. Key market segments likely include variations in tray materials (e.g., steel, aluminum, fiberglass), types (e.g., ladder, trough, channel), and applications (industrial, commercial, residential). Leading players such as Atkore International Group Inc. and Legrand SA are strategically investing in R&D and global expansion to leverage market opportunities.
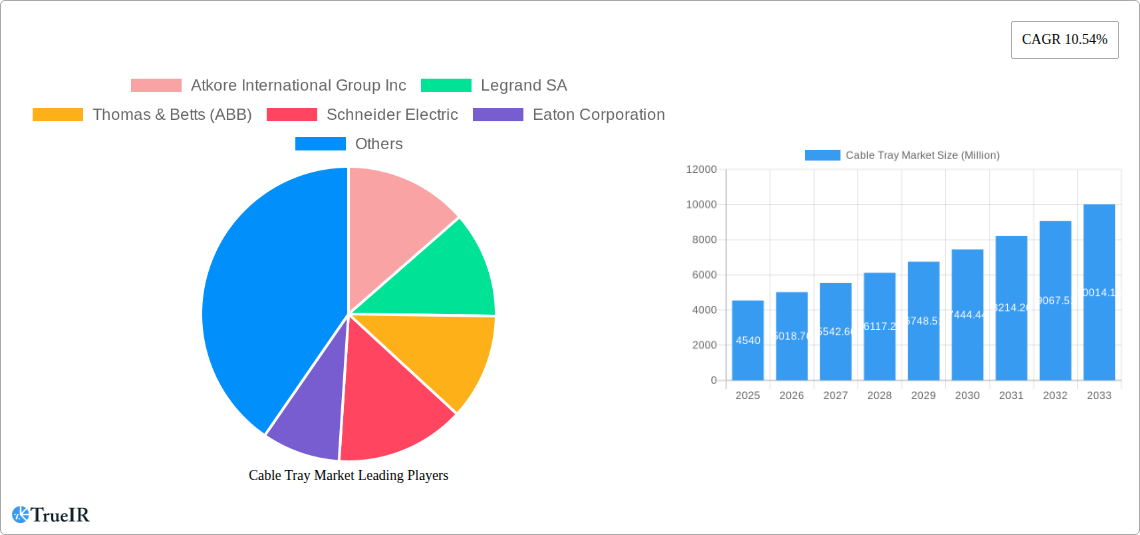
Cable Tray Market Market Size (In Million)
The 2025-2033 forecast period presents ample opportunities for market participants to refine their product portfolios and increase market share. Continuous innovation in cable tray design and manufacturing is essential for competitive advantage. A strategic emphasis on sustainable materials and smart cable tray management systems, incorporating IoT capabilities, is anticipated. Emerging economies, particularly in the Asia-Pacific and Latin America regions, are expected to be significant growth drivers. Companies offering region-specific solutions and efficient supply chain management will likely achieve a competitive edge. The preceding period (2019-2024) likely witnessed steady growth, establishing a robust foundation for the projected expansion.
Cable Tray Market Company Market Share
Cable Tray Market Report: A Comprehensive Analysis (2019-2033)
This dynamic report provides a detailed analysis of the global Cable Tray Market, offering invaluable insights for industry stakeholders, investors, and researchers. Covering the period 2019-2033, with a focus on the forecast period 2025-2033 and a base year of 2025, this study delves into market structure, competitive dynamics, emerging trends, and future growth prospects. The report incorporates comprehensive data analysis, including market sizing, CAGR projections, and segment-specific growth drivers, to provide a holistic understanding of this vital sector. Expected market value is predicted to reach xx Million by 2033.
Cable Tray Market Market Structure & Competitive Landscape
This section analyzes the Cable Tray Market's competitive landscape, focusing on market concentration, innovation drivers, regulatory influences, and key industry trends. The market is moderately concentrated, with several major players holding significant market share. The Herfindahl-Hirschman Index (HHI) is estimated at xx, indicating a moderately consolidated market.
Key Aspects Analyzed:
- Market Concentration: We examine the market share distribution among key players, calculating concentration ratios (e.g., CR4, CR8) to assess the degree of market competition.
- Innovation Drivers: The report explores technological advancements, such as the development of lighter, more durable materials and improved cable management solutions, driving market growth.
- Regulatory Impacts: We analyze the influence of building codes, safety standards (e.g., UL, IEC), and environmental regulations on market dynamics.
- Product Substitutes: An assessment of alternative cable management systems and their impact on market competition is included.
- End-User Segmentation: The report segments the market by end-user industries (e.g., construction, manufacturing, energy) to pinpoint growth opportunities.
- M&A Trends: Analysis of recent mergers, acquisitions, and joint ventures, including their impact on market consolidation and competitive dynamics. Recent activity indicates a yearly M&A volume averaging xx Million in the last five years.
Cable Tray Market Market Trends & Opportunities
This section explores the key trends and opportunities shaping the Cable Tray Market. We analyze market size growth, technological advancements, evolving consumer preferences, and competitive landscape dynamics. The market is projected to witness a robust CAGR of xx% during the forecast period. This growth is fueled by several factors, including increased urbanization, infrastructure development, and rising demand for efficient cable management solutions.
The increasing adoption of smart technologies in buildings and industrial facilities will drive demand for advanced cable tray systems. The shift towards sustainable and eco-friendly materials is another key trend impacting the market.
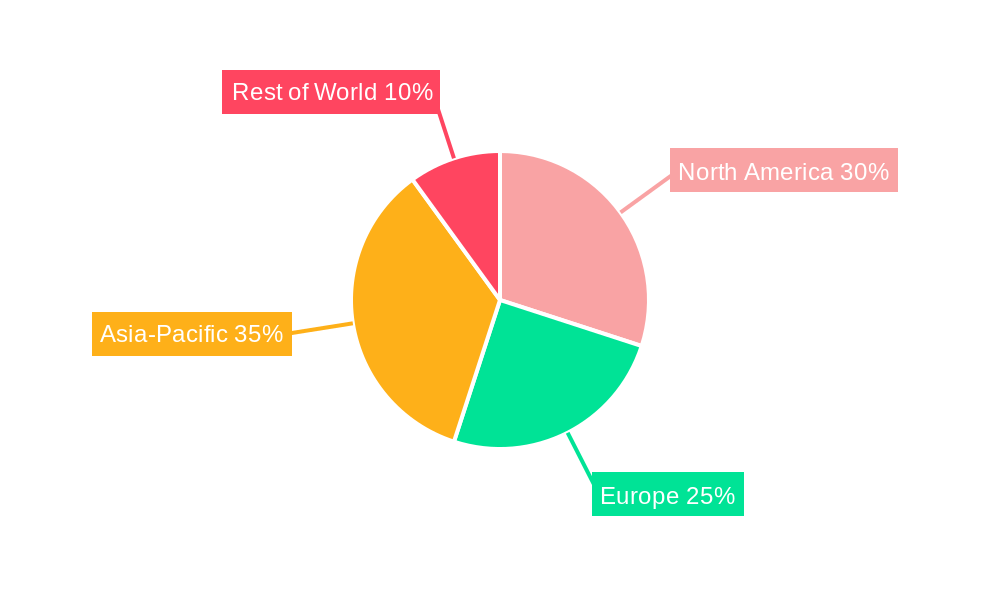
Dominant Markets & Segments in Cable Tray Market
This section identifies the leading regions, countries, and segments within the Cable Tray Market, providing a detailed analysis of their market dominance and growth drivers. The North American region currently holds the largest market share, driven by robust construction activity and infrastructure development.
Key Growth Drivers:
- Infrastructure Development: Significant investments in infrastructure projects, particularly in developing economies, are fueling market growth.
- Government Policies and Regulations: Supportive government policies and regulations promoting infrastructure development and energy efficiency are creating favorable market conditions.
- Industrialization and Urbanization: Rapid urbanization and industrialization in emerging markets are driving demand for cable tray systems.
Cable Tray Market Product Analysis
This section summarizes recent product innovations in cable tray technology. Advancements include lighter weight designs, improved corrosion resistance, and increased cable capacity. These innovations cater to various applications, ensuring better integration into diverse infrastructure projects. Companies are focusing on developing modular and customizable systems to cater to specific project needs, offering a competitive edge in the market.
Key Drivers, Barriers & Challenges in Cable Tray Market
Key Drivers:
- Growth in Infrastructure Spending: Increased investment in infrastructure projects globally fuels demand for cable trays.
- Technological Advancements: Innovations in materials and design enhance efficiency and durability.
- Stringent Safety Regulations: Growing awareness of safety standards drives adoption of robust cable management solutions.
Key Challenges:
- Fluctuating Raw Material Prices: Price volatility impacts production costs and profitability.
- Intense Competition: Presence of numerous established and emerging players leads to fierce competition.
- Supply Chain Disruptions: Global supply chain issues can affect production and delivery timelines.
Growth Drivers in the Cable Tray Market Market
The Cable Tray Market is experiencing growth primarily driven by the expansion of the construction sector globally and increasing adoption of advanced cable management systems in data centers and industrial facilities. Government initiatives promoting energy efficiency and infrastructure upgrades further contribute to this growth. Technological innovations, particularly in lighter and more sustainable materials, are also key drivers.
Challenges Impacting Cable Tray Market Growth
Despite the positive growth outlook, challenges such as fluctuating raw material prices, intense competition from established and emerging players, and potential supply chain disruptions pose threats to the Cable Tray Market. Stringent regulatory compliance requirements also add complexity to the market's operating environment.
Key Players Shaping the Cable Tray Market Market
- Atkore International Group Inc
- Legrand SA
- Thomas & Betts (ABB)
- Schneider Electric
- Eaton Corporation
- Chalfant Manufacturing Co
- OBO Bettermann GmbH & Co KG
- Hubbell Inc
- Panduit Corporation
- OGLAEND Group Holding AS (Hilti)
- Prysmian Grou
Significant Cable Tray Market Industry Milestones
- May 2024: ABB and Niedax Group announced a 50/50 joint venture for North American cable tray businesses, set to launch in Q4 2024. This merger significantly impacts market consolidation.
- February 2024: igus launched the UL-listed motor cable CF33.UL for cable trays and e-chains, marking a significant product innovation enhancing versatility and safety.
Future Outlook for Cable Tray Market Market
The Cable Tray Market is poised for continued growth, driven by sustained infrastructure development, increasing adoption of advanced technologies, and ongoing investments in renewable energy projects. Strategic partnerships, product innovation, and expansion into new markets present significant opportunities for market players. The market's potential for growth remains strong, promising significant returns for investors and stakeholders.
Cable Tray Market Segmentation
-
1. Mater
- 1.1. Aluminum
- 1.2. Steel
- 1.3. Fiber-reinforced Polymers (FRP)
-
2. End-u
- 2.1. Power and Utilities
- 2.2. Construction
- 2.3. Industrial
- 2.4. Other En
Cable Tray Market Segmentation By Geography
-
1. North America
- 1.1. United States
- 1.2. Canada
- 1.3. Mexico
-
2. South America
- 2.1. Brazil
- 2.2. Argentina
- 2.3. Rest of South America
-
3. Europe
- 3.1. United Kingdom
- 3.2. Germany
- 3.3. France
- 3.4. Italy
- 3.5. Spain
- 3.6. Russia
- 3.7. Benelux
- 3.8. Nordics
- 3.9. Rest of Europe
-
4. Middle East & Africa
- 4.1. Turkey
- 4.2. Israel
- 4.3. GCC
- 4.4. North Africa
- 4.5. South Africa
- 4.6. Rest of Middle East & Africa
-
5. Asia Pacific
- 5.1. China
- 5.2. India
- 5.3. Japan
- 5.4. South Korea
- 5.5. ASEAN
- 5.6. Oceania
- 5.7. Rest of Asia Pacific
Cable Tray Market Regional Market Share
Geographic Coverage of Cable Tray Market
Cable Tray Market REPORT HIGHLIGHTS
| Aspects | Details |
|---|---|
| Study Period | 2020-2034 |
| Base Year | 2025 |
| Estimated Year | 2026 |
| Forecast Period | 2026-2034 |
| Historical Period | 2020-2025 |
| Growth Rate | CAGR of 7% from 2020-2034 |
| Segmentation |
|
Table of Contents
- 1. Introduction
- 1.1. Research Scope
- 1.2. Market Segmentation
- 1.3. Research Methodology
- 1.4. Definitions and Assumptions
- 2. Executive Summary
- 2.1. Introduction
- 3. Market Dynamics
- 3.1. Introduction
- 3.2. Market Drivers
- 3.2.1. Ongoing Demand for Construction-based Activity in Emerging Regions; Demand in Renewable Energy Commercialization; Growth in Data Centers and Telecommunications Infrastructure; Emphasis on Workplace Safety and Compliance
- 3.3. Market Restrains
- 3.3.1. Ongoing Demand for Construction-based Activity in Emerging Regions; Demand in Renewable Energy Commercialization; Growth in Data Centers and Telecommunications Infrastructure; Emphasis on Workplace Safety and Compliance
- 3.4. Market Trends
- 3.4.1. Construction Segment Holds a Major Share
- 4. Market Factor Analysis
- 4.1. Porters Five Forces
- 4.2. Supply/Value Chain
- 4.3. PESTEL analysis
- 4.4. Market Entropy
- 4.5. Patent/Trademark Analysis
- 5. Global Cable Tray Market Analysis, Insights and Forecast, 2020-2032
- 5.1. Market Analysis, Insights and Forecast - by Mater
- 5.1.1. Aluminum
- 5.1.2. Steel
- 5.1.3. Fiber-reinforced Polymers (FRP)
- 5.2. Market Analysis, Insights and Forecast - by End-u
- 5.2.1. Power and Utilities
- 5.2.2. Construction
- 5.2.3. Industrial
- 5.2.4. Other En
- 5.3. Market Analysis, Insights and Forecast - by Region
- 5.3.1. North America
- 5.3.2. South America
- 5.3.3. Europe
- 5.3.4. Middle East & Africa
- 5.3.5. Asia Pacific
- 5.1. Market Analysis, Insights and Forecast - by Mater
- 6. North America Cable Tray Market Analysis, Insights and Forecast, 2020-2032
- 6.1. Market Analysis, Insights and Forecast - by Mater
- 6.1.1. Aluminum
- 6.1.2. Steel
- 6.1.3. Fiber-reinforced Polymers (FRP)
- 6.2. Market Analysis, Insights and Forecast - by End-u
- 6.2.1. Power and Utilities
- 6.2.2. Construction
- 6.2.3. Industrial
- 6.2.4. Other En
- 6.1. Market Analysis, Insights and Forecast - by Mater
- 7. South America Cable Tray Market Analysis, Insights and Forecast, 2020-2032
- 7.1. Market Analysis, Insights and Forecast - by Mater
- 7.1.1. Aluminum
- 7.1.2. Steel
- 7.1.3. Fiber-reinforced Polymers (FRP)
- 7.2. Market Analysis, Insights and Forecast - by End-u
- 7.2.1. Power and Utilities
- 7.2.2. Construction
- 7.2.3. Industrial
- 7.2.4. Other En
- 7.1. Market Analysis, Insights and Forecast - by Mater
- 8. Europe Cable Tray Market Analysis, Insights and Forecast, 2020-2032
- 8.1. Market Analysis, Insights and Forecast - by Mater
- 8.1.1. Aluminum
- 8.1.2. Steel
- 8.1.3. Fiber-reinforced Polymers (FRP)
- 8.2. Market Analysis, Insights and Forecast - by End-u
- 8.2.1. Power and Utilities
- 8.2.2. Construction
- 8.2.3. Industrial
- 8.2.4. Other En
- 8.1. Market Analysis, Insights and Forecast - by Mater
- 9. Middle East & Africa Cable Tray Market Analysis, Insights and Forecast, 2020-2032
- 9.1. Market Analysis, Insights and Forecast - by Mater
- 9.1.1. Aluminum
- 9.1.2. Steel
- 9.1.3. Fiber-reinforced Polymers (FRP)
- 9.2. Market Analysis, Insights and Forecast - by End-u
- 9.2.1. Power and Utilities
- 9.2.2. Construction
- 9.2.3. Industrial
- 9.2.4. Other En
- 9.1. Market Analysis, Insights and Forecast - by Mater
- 10. Asia Pacific Cable Tray Market Analysis, Insights and Forecast, 2020-2032
- 10.1. Market Analysis, Insights and Forecast - by Mater
- 10.1.1. Aluminum
- 10.1.2. Steel
- 10.1.3. Fiber-reinforced Polymers (FRP)
- 10.2. Market Analysis, Insights and Forecast - by End-u
- 10.2.1. Power and Utilities
- 10.2.2. Construction
- 10.2.3. Industrial
- 10.2.4. Other En
- 10.1. Market Analysis, Insights and Forecast - by Mater
- 11. Competitive Analysis
- 11.1. Global Market Share Analysis 2025
- 11.2. Company Profiles
- 11.2.1 Atkore International Group Inc
- 11.2.1.1. Overview
- 11.2.1.2. Products
- 11.2.1.3. SWOT Analysis
- 11.2.1.4. Recent Developments
- 11.2.1.5. Financials (Based on Availability)
- 11.2.2 Legrand SA
- 11.2.2.1. Overview
- 11.2.2.2. Products
- 11.2.2.3. SWOT Analysis
- 11.2.2.4. Recent Developments
- 11.2.2.5. Financials (Based on Availability)
- 11.2.3 Thomas & Betts (ABB)
- 11.2.3.1. Overview
- 11.2.3.2. Products
- 11.2.3.3. SWOT Analysis
- 11.2.3.4. Recent Developments
- 11.2.3.5. Financials (Based on Availability)
- 11.2.4 Schneider Electric
- 11.2.4.1. Overview
- 11.2.4.2. Products
- 11.2.4.3. SWOT Analysis
- 11.2.4.4. Recent Developments
- 11.2.4.5. Financials (Based on Availability)
- 11.2.5 Eaton Corporation
- 11.2.5.1. Overview
- 11.2.5.2. Products
- 11.2.5.3. SWOT Analysis
- 11.2.5.4. Recent Developments
- 11.2.5.5. Financials (Based on Availability)
- 11.2.6 Chalfant Manufacturing Co
- 11.2.6.1. Overview
- 11.2.6.2. Products
- 11.2.6.3. SWOT Analysis
- 11.2.6.4. Recent Developments
- 11.2.6.5. Financials (Based on Availability)
- 11.2.7 OBO Bettermann GmbH & Co KG
- 11.2.7.1. Overview
- 11.2.7.2. Products
- 11.2.7.3. SWOT Analysis
- 11.2.7.4. Recent Developments
- 11.2.7.5. Financials (Based on Availability)
- 11.2.8 Hubbell Inc
- 11.2.8.1. Overview
- 11.2.8.2. Products
- 11.2.8.3. SWOT Analysis
- 11.2.8.4. Recent Developments
- 11.2.8.5. Financials (Based on Availability)
- 11.2.9 Panduit Corporation
- 11.2.9.1. Overview
- 11.2.9.2. Products
- 11.2.9.3. SWOT Analysis
- 11.2.9.4. Recent Developments
- 11.2.9.5. Financials (Based on Availability)
- 11.2.10 OGLAEND Group Holding AS (Hilti)
- 11.2.10.1. Overview
- 11.2.10.2. Products
- 11.2.10.3. SWOT Analysis
- 11.2.10.4. Recent Developments
- 11.2.10.5. Financials (Based on Availability)
- 11.2.11 Prysmian Grou
- 11.2.11.1. Overview
- 11.2.11.2. Products
- 11.2.11.3. SWOT Analysis
- 11.2.11.4. Recent Developments
- 11.2.11.5. Financials (Based on Availability)
- 11.2.1 Atkore International Group Inc
List of Figures
- Figure 1: Global Cable Tray Market Revenue Breakdown (million, %) by Region 2025 & 2033
- Figure 2: Global Cable Tray Market Volume Breakdown (Billion, %) by Region 2025 & 2033
- Figure 3: North America Cable Tray Market Revenue (million), by Mater 2025 & 2033
- Figure 4: North America Cable Tray Market Volume (Billion), by Mater 2025 & 2033
- Figure 5: North America Cable Tray Market Revenue Share (%), by Mater 2025 & 2033
- Figure 6: North America Cable Tray Market Volume Share (%), by Mater 2025 & 2033
- Figure 7: North America Cable Tray Market Revenue (million), by End-u 2025 & 2033
- Figure 8: North America Cable Tray Market Volume (Billion), by End-u 2025 & 2033
- Figure 9: North America Cable Tray Market Revenue Share (%), by End-u 2025 & 2033
- Figure 10: North America Cable Tray Market Volume Share (%), by End-u 2025 & 2033
- Figure 11: North America Cable Tray Market Revenue (million), by Country 2025 & 2033
- Figure 12: North America Cable Tray Market Volume (Billion), by Country 2025 & 2033
- Figure 13: North America Cable Tray Market Revenue Share (%), by Country 2025 & 2033
- Figure 14: North America Cable Tray Market Volume Share (%), by Country 2025 & 2033
- Figure 15: South America Cable Tray Market Revenue (million), by Mater 2025 & 2033
- Figure 16: South America Cable Tray Market Volume (Billion), by Mater 2025 & 2033
- Figure 17: South America Cable Tray Market Revenue Share (%), by Mater 2025 & 2033
- Figure 18: South America Cable Tray Market Volume Share (%), by Mater 2025 & 2033
- Figure 19: South America Cable Tray Market Revenue (million), by End-u 2025 & 2033
- Figure 20: South America Cable Tray Market Volume (Billion), by End-u 2025 & 2033
- Figure 21: South America Cable Tray Market Revenue Share (%), by End-u 2025 & 2033
- Figure 22: South America Cable Tray Market Volume Share (%), by End-u 2025 & 2033
- Figure 23: South America Cable Tray Market Revenue (million), by Country 2025 & 2033
- Figure 24: South America Cable Tray Market Volume (Billion), by Country 2025 & 2033
- Figure 25: South America Cable Tray Market Revenue Share (%), by Country 2025 & 2033
- Figure 26: South America Cable Tray Market Volume Share (%), by Country 2025 & 2033
- Figure 27: Europe Cable Tray Market Revenue (million), by Mater 2025 & 2033
- Figure 28: Europe Cable Tray Market Volume (Billion), by Mater 2025 & 2033
- Figure 29: Europe Cable Tray Market Revenue Share (%), by Mater 2025 & 2033
- Figure 30: Europe Cable Tray Market Volume Share (%), by Mater 2025 & 2033
- Figure 31: Europe Cable Tray Market Revenue (million), by End-u 2025 & 2033
- Figure 32: Europe Cable Tray Market Volume (Billion), by End-u 2025 & 2033
- Figure 33: Europe Cable Tray Market Revenue Share (%), by End-u 2025 & 2033
- Figure 34: Europe Cable Tray Market Volume Share (%), by End-u 2025 & 2033
- Figure 35: Europe Cable Tray Market Revenue (million), by Country 2025 & 2033
- Figure 36: Europe Cable Tray Market Volume (Billion), by Country 2025 & 2033
- Figure 37: Europe Cable Tray Market Revenue Share (%), by Country 2025 & 2033
- Figure 38: Europe Cable Tray Market Volume Share (%), by Country 2025 & 2033
- Figure 39: Middle East & Africa Cable Tray Market Revenue (million), by Mater 2025 & 2033
- Figure 40: Middle East & Africa Cable Tray Market Volume (Billion), by Mater 2025 & 2033
- Figure 41: Middle East & Africa Cable Tray Market Revenue Share (%), by Mater 2025 & 2033
- Figure 42: Middle East & Africa Cable Tray Market Volume Share (%), by Mater 2025 & 2033
- Figure 43: Middle East & Africa Cable Tray Market Revenue (million), by End-u 2025 & 2033
- Figure 44: Middle East & Africa Cable Tray Market Volume (Billion), by End-u 2025 & 2033
- Figure 45: Middle East & Africa Cable Tray Market Revenue Share (%), by End-u 2025 & 2033
- Figure 46: Middle East & Africa Cable Tray Market Volume Share (%), by End-u 2025 & 2033
- Figure 47: Middle East & Africa Cable Tray Market Revenue (million), by Country 2025 & 2033
- Figure 48: Middle East & Africa Cable Tray Market Volume (Billion), by Country 2025 & 2033
- Figure 49: Middle East & Africa Cable Tray Market Revenue Share (%), by Country 2025 & 2033
- Figure 50: Middle East & Africa Cable Tray Market Volume Share (%), by Country 2025 & 2033
- Figure 51: Asia Pacific Cable Tray Market Revenue (million), by Mater 2025 & 2033
- Figure 52: Asia Pacific Cable Tray Market Volume (Billion), by Mater 2025 & 2033
- Figure 53: Asia Pacific Cable Tray Market Revenue Share (%), by Mater 2025 & 2033
- Figure 54: Asia Pacific Cable Tray Market Volume Share (%), by Mater 2025 & 2033
- Figure 55: Asia Pacific Cable Tray Market Revenue (million), by End-u 2025 & 2033
- Figure 56: Asia Pacific Cable Tray Market Volume (Billion), by End-u 2025 & 2033
- Figure 57: Asia Pacific Cable Tray Market Revenue Share (%), by End-u 2025 & 2033
- Figure 58: Asia Pacific Cable Tray Market Volume Share (%), by End-u 2025 & 2033
- Figure 59: Asia Pacific Cable Tray Market Revenue (million), by Country 2025 & 2033
- Figure 60: Asia Pacific Cable Tray Market Volume (Billion), by Country 2025 & 2033
- Figure 61: Asia Pacific Cable Tray Market Revenue Share (%), by Country 2025 & 2033
- Figure 62: Asia Pacific Cable Tray Market Volume Share (%), by Country 2025 & 2033
List of Tables
- Table 1: Global Cable Tray Market Revenue million Forecast, by Mater 2020 & 2033
- Table 2: Global Cable Tray Market Volume Billion Forecast, by Mater 2020 & 2033
- Table 3: Global Cable Tray Market Revenue million Forecast, by End-u 2020 & 2033
- Table 4: Global Cable Tray Market Volume Billion Forecast, by End-u 2020 & 2033
- Table 5: Global Cable Tray Market Revenue million Forecast, by Region 2020 & 2033
- Table 6: Global Cable Tray Market Volume Billion Forecast, by Region 2020 & 2033
- Table 7: Global Cable Tray Market Revenue million Forecast, by Mater 2020 & 2033
- Table 8: Global Cable Tray Market Volume Billion Forecast, by Mater 2020 & 2033
- Table 9: Global Cable Tray Market Revenue million Forecast, by End-u 2020 & 2033
- Table 10: Global Cable Tray Market Volume Billion Forecast, by End-u 2020 & 2033
- Table 11: Global Cable Tray Market Revenue million Forecast, by Country 2020 & 2033
- Table 12: Global Cable Tray Market Volume Billion Forecast, by Country 2020 & 2033
- Table 13: United States Cable Tray Market Revenue (million) Forecast, by Application 2020 & 2033
- Table 14: United States Cable Tray Market Volume (Billion) Forecast, by Application 2020 & 2033
- Table 15: Canada Cable Tray Market Revenue (million) Forecast, by Application 2020 & 2033
- Table 16: Canada Cable Tray Market Volume (Billion) Forecast, by Application 2020 & 2033
- Table 17: Mexico Cable Tray Market Revenue (million) Forecast, by Application 2020 & 2033
- Table 18: Mexico Cable Tray Market Volume (Billion) Forecast, by Application 2020 & 2033
- Table 19: Global Cable Tray Market Revenue million Forecast, by Mater 2020 & 2033
- Table 20: Global Cable Tray Market Volume Billion Forecast, by Mater 2020 & 2033
- Table 21: Global Cable Tray Market Revenue million Forecast, by End-u 2020 & 2033
- Table 22: Global Cable Tray Market Volume Billion Forecast, by End-u 2020 & 2033
- Table 23: Global Cable Tray Market Revenue million Forecast, by Country 2020 & 2033
- Table 24: Global Cable Tray Market Volume Billion Forecast, by Country 2020 & 2033
- Table 25: Brazil Cable Tray Market Revenue (million) Forecast, by Application 2020 & 2033
- Table 26: Brazil Cable Tray Market Volume (Billion) Forecast, by Application 2020 & 2033
- Table 27: Argentina Cable Tray Market Revenue (million) Forecast, by Application 2020 & 2033
- Table 28: Argentina Cable Tray Market Volume (Billion) Forecast, by Application 2020 & 2033
- Table 29: Rest of South America Cable Tray Market Revenue (million) Forecast, by Application 2020 & 2033
- Table 30: Rest of South America Cable Tray Market Volume (Billion) Forecast, by Application 2020 & 2033
- Table 31: Global Cable Tray Market Revenue million Forecast, by Mater 2020 & 2033
- Table 32: Global Cable Tray Market Volume Billion Forecast, by Mater 2020 & 2033
- Table 33: Global Cable Tray Market Revenue million Forecast, by End-u 2020 & 2033
- Table 34: Global Cable Tray Market Volume Billion Forecast, by End-u 2020 & 2033
- Table 35: Global Cable Tray Market Revenue million Forecast, by Country 2020 & 2033
- Table 36: Global Cable Tray Market Volume Billion Forecast, by Country 2020 & 2033
- Table 37: United Kingdom Cable Tray Market Revenue (million) Forecast, by Application 2020 & 2033
- Table 38: United Kingdom Cable Tray Market Volume (Billion) Forecast, by Application 2020 & 2033
- Table 39: Germany Cable Tray Market Revenue (million) Forecast, by Application 2020 & 2033
- Table 40: Germany Cable Tray Market Volume (Billion) Forecast, by Application 2020 & 2033
- Table 41: France Cable Tray Market Revenue (million) Forecast, by Application 2020 & 2033
- Table 42: France Cable Tray Market Volume (Billion) Forecast, by Application 2020 & 2033
- Table 43: Italy Cable Tray Market Revenue (million) Forecast, by Application 2020 & 2033
- Table 44: Italy Cable Tray Market Volume (Billion) Forecast, by Application 2020 & 2033
- Table 45: Spain Cable Tray Market Revenue (million) Forecast, by Application 2020 & 2033
- Table 46: Spain Cable Tray Market Volume (Billion) Forecast, by Application 2020 & 2033
- Table 47: Russia Cable Tray Market Revenue (million) Forecast, by Application 2020 & 2033
- Table 48: Russia Cable Tray Market Volume (Billion) Forecast, by Application 2020 & 2033
- Table 49: Benelux Cable Tray Market Revenue (million) Forecast, by Application 2020 & 2033
- Table 50: Benelux Cable Tray Market Volume (Billion) Forecast, by Application 2020 & 2033
- Table 51: Nordics Cable Tray Market Revenue (million) Forecast, by Application 2020 & 2033
- Table 52: Nordics Cable Tray Market Volume (Billion) Forecast, by Application 2020 & 2033
- Table 53: Rest of Europe Cable Tray Market Revenue (million) Forecast, by Application 2020 & 2033
- Table 54: Rest of Europe Cable Tray Market Volume (Billion) Forecast, by Application 2020 & 2033
- Table 55: Global Cable Tray Market Revenue million Forecast, by Mater 2020 & 2033
- Table 56: Global Cable Tray Market Volume Billion Forecast, by Mater 2020 & 2033
- Table 57: Global Cable Tray Market Revenue million Forecast, by End-u 2020 & 2033
- Table 58: Global Cable Tray Market Volume Billion Forecast, by End-u 2020 & 2033
- Table 59: Global Cable Tray Market Revenue million Forecast, by Country 2020 & 2033
- Table 60: Global Cable Tray Market Volume Billion Forecast, by Country 2020 & 2033
- Table 61: Turkey Cable Tray Market Revenue (million) Forecast, by Application 2020 & 2033
- Table 62: Turkey Cable Tray Market Volume (Billion) Forecast, by Application 2020 & 2033
- Table 63: Israel Cable Tray Market Revenue (million) Forecast, by Application 2020 & 2033
- Table 64: Israel Cable Tray Market Volume (Billion) Forecast, by Application 2020 & 2033
- Table 65: GCC Cable Tray Market Revenue (million) Forecast, by Application 2020 & 2033
- Table 66: GCC Cable Tray Market Volume (Billion) Forecast, by Application 2020 & 2033
- Table 67: North Africa Cable Tray Market Revenue (million) Forecast, by Application 2020 & 2033
- Table 68: North Africa Cable Tray Market Volume (Billion) Forecast, by Application 2020 & 2033
- Table 69: South Africa Cable Tray Market Revenue (million) Forecast, by Application 2020 & 2033
- Table 70: South Africa Cable Tray Market Volume (Billion) Forecast, by Application 2020 & 2033
- Table 71: Rest of Middle East & Africa Cable Tray Market Revenue (million) Forecast, by Application 2020 & 2033
- Table 72: Rest of Middle East & Africa Cable Tray Market Volume (Billion) Forecast, by Application 2020 & 2033
- Table 73: Global Cable Tray Market Revenue million Forecast, by Mater 2020 & 2033
- Table 74: Global Cable Tray Market Volume Billion Forecast, by Mater 2020 & 2033
- Table 75: Global Cable Tray Market Revenue million Forecast, by End-u 2020 & 2033
- Table 76: Global Cable Tray Market Volume Billion Forecast, by End-u 2020 & 2033
- Table 77: Global Cable Tray Market Revenue million Forecast, by Country 2020 & 2033
- Table 78: Global Cable Tray Market Volume Billion Forecast, by Country 2020 & 2033
- Table 79: China Cable Tray Market Revenue (million) Forecast, by Application 2020 & 2033
- Table 80: China Cable Tray Market Volume (Billion) Forecast, by Application 2020 & 2033
- Table 81: India Cable Tray Market Revenue (million) Forecast, by Application 2020 & 2033
- Table 82: India Cable Tray Market Volume (Billion) Forecast, by Application 2020 & 2033
- Table 83: Japan Cable Tray Market Revenue (million) Forecast, by Application 2020 & 2033
- Table 84: Japan Cable Tray Market Volume (Billion) Forecast, by Application 2020 & 2033
- Table 85: South Korea Cable Tray Market Revenue (million) Forecast, by Application 2020 & 2033
- Table 86: South Korea Cable Tray Market Volume (Billion) Forecast, by Application 2020 & 2033
- Table 87: ASEAN Cable Tray Market Revenue (million) Forecast, by Application 2020 & 2033
- Table 88: ASEAN Cable Tray Market Volume (Billion) Forecast, by Application 2020 & 2033
- Table 89: Oceania Cable Tray Market Revenue (million) Forecast, by Application 2020 & 2033
- Table 90: Oceania Cable Tray Market Volume (Billion) Forecast, by Application 2020 & 2033
- Table 91: Rest of Asia Pacific Cable Tray Market Revenue (million) Forecast, by Application 2020 & 2033
- Table 92: Rest of Asia Pacific Cable Tray Market Volume (Billion) Forecast, by Application 2020 & 2033
Frequently Asked Questions
1. What is the projected Compound Annual Growth Rate (CAGR) of the Cable Tray Market?
The projected CAGR is approximately 7%.
2. Which companies are prominent players in the Cable Tray Market?
Key companies in the market include Atkore International Group Inc, Legrand SA, Thomas & Betts (ABB), Schneider Electric, Eaton Corporation, Chalfant Manufacturing Co, OBO Bettermann GmbH & Co KG, Hubbell Inc, Panduit Corporation, OGLAEND Group Holding AS (Hilti), Prysmian Grou.
3. What are the main segments of the Cable Tray Market?
The market segments include Mater, End-u.
4. Can you provide details about the market size?
The market size is estimated to be USD 297.35 million as of 2022.
5. What are some drivers contributing to market growth?
Ongoing Demand for Construction-based Activity in Emerging Regions; Demand in Renewable Energy Commercialization; Growth in Data Centers and Telecommunications Infrastructure; Emphasis on Workplace Safety and Compliance.
6. What are the notable trends driving market growth?
Construction Segment Holds a Major Share.
7. Are there any restraints impacting market growth?
Ongoing Demand for Construction-based Activity in Emerging Regions; Demand in Renewable Energy Commercialization; Growth in Data Centers and Telecommunications Infrastructure; Emphasis on Workplace Safety and Compliance.
8. Can you provide examples of recent developments in the market?
May 2024: ABB, a player in electrification and automation, and Niedax Group, a global player in cable management systems, announced a 50/50 joint venture. The agreement, pending customary closing conditions, is set to be finalized in Q4 2024, marking the commencement of operations. This strategic collaboration will merge the North American cable tray businesses of ABB’s Installation Products Division and Niedax Group under the new joint venture.
9. What pricing options are available for accessing the report?
Pricing options include single-user, multi-user, and enterprise licenses priced at USD 3800, USD 4500, and USD 5800 respectively.
10. Is the market size provided in terms of value or volume?
The market size is provided in terms of value, measured in million and volume, measured in Billion.
11. Are there any specific market keywords associated with the report?
Yes, the market keyword associated with the report is "Cable Tray Market," which aids in identifying and referencing the specific market segment covered.
12. How do I determine which pricing option suits my needs best?
The pricing options vary based on user requirements and access needs. Individual users may opt for single-user licenses, while businesses requiring broader access may choose multi-user or enterprise licenses for cost-effective access to the report.
13. Are there any additional resources or data provided in the Cable Tray Market report?
While the report offers comprehensive insights, it's advisable to review the specific contents or supplementary materials provided to ascertain if additional resources or data are available.
14. How can I stay updated on further developments or reports in the Cable Tray Market?
To stay informed about further developments, trends, and reports in the Cable Tray Market, consider subscribing to industry newsletters, following relevant companies and organizations, or regularly checking reputable industry news sources and publications.
Methodology
Step 1 - Identification of Relevant Samples Size from Population Database


Step 2 - Approaches for Defining Global Market Size (Value, Volume* & Price*)

Note*: In applicable scenarios
Step 3 - Data Sources
Primary Research
- Web Analytics
- Survey Reports
- Research Institute
- Latest Research Reports
- Opinion Leaders
Secondary Research
- Annual Reports
- White Paper
- Latest Press Release
- Industry Association
- Paid Database
- Investor Presentations

Step 4 - Data Triangulation
Involves using different sources of information in order to increase the validity of a study
These sources are likely to be stakeholders in a program - participants, other researchers, program staff, other community members, and so on.
Then we put all data in single framework & apply various statistical tools to find out the dynamic on the market.
During the analysis stage, feedback from the stakeholder groups would be compared to determine areas of agreement as well as areas of divergence