

Key Insights
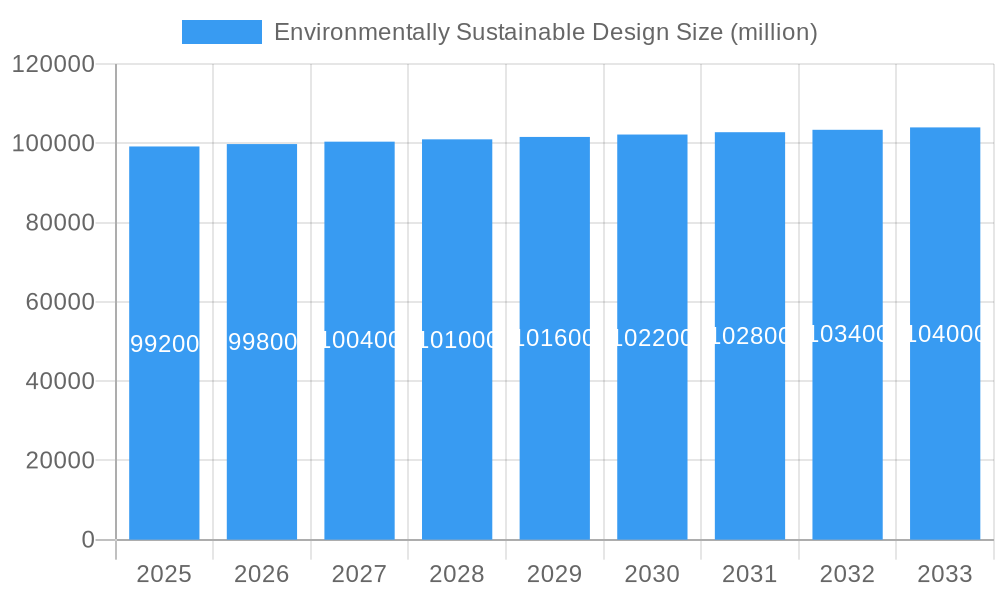
The Environmentally Sustainable Design market is poised for a steady expansion, projected to reach approximately USD 99.2 billion by 2025. This growth, while appearing modest with a Compound Annual Growth Rate (CAGR) of 0.6%, signifies a sustained and incremental adoption of eco-conscious principles across various sectors. The market is driven by a growing global awareness of environmental challenges, including climate change, resource depletion, and biodiversity loss. Regulatory pressures mandating sustainable practices, coupled with increasing corporate social responsibility initiatives, are compelling governments, enterprises, and even individuals to integrate environmentally sound design strategies into their projects. The demand for sustainable urban planning, energy-efficient buildings, and resource-conscious material selection is a key impetus. Furthermore, the increasing need for ecological restoration and landscape planning to mitigate environmental damage and enhance ecological resilience contributes significantly to market demand.
Environmentally Sustainable Design Market Size (In Billion)
The market's trajectory is influenced by a confluence of emerging trends and underlying challenges. Key trends include the integration of smart technologies for optimized resource management in sustainable designs, the rise of circular economy principles in construction and product design, and an increasing focus on biophilic design to improve human well-being and environmental connection. Emerging markets in Asia Pacific and regions with developing economies are anticipated to witness a higher growth rate as they increasingly adopt sustainable development frameworks. However, the market faces restraints such as the perceived higher upfront costs associated with some sustainable materials and technologies, a lack of widespread skilled professionals in specialized eco-design fields, and the inertia of traditional, less sustainable design practices. Overcoming these challenges through education, incentivization, and technological innovation will be crucial for unlocking the full potential of the environmentally sustainable design sector.
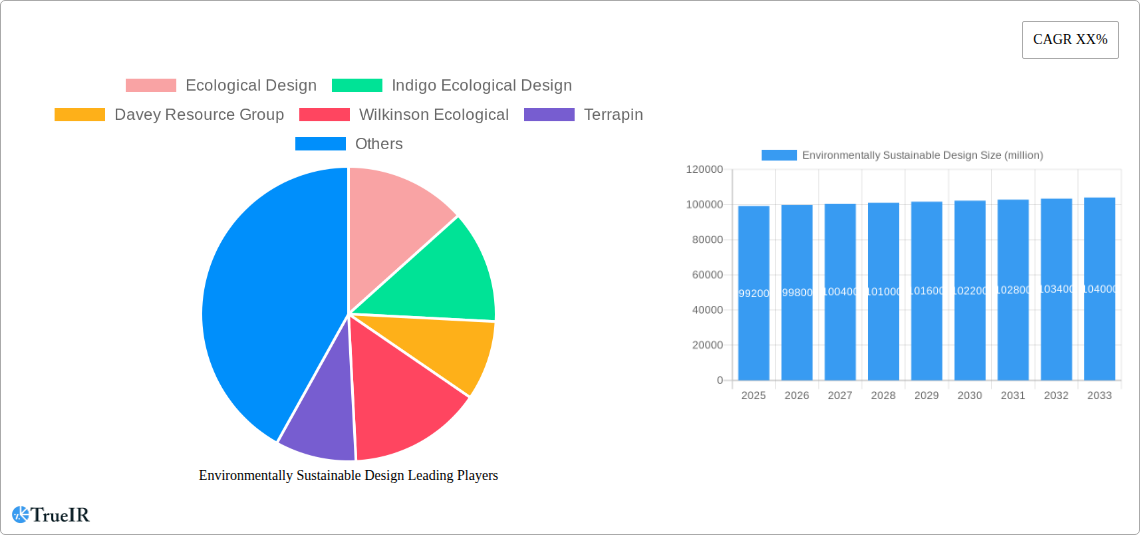
Environmentally Sustainable Design Company Market Share
Environmentally Sustainable Design Market: Comprehensive Industry Analysis & Future Outlook (2019-2033)
Unlock unparalleled insights into the burgeoning Environmentally Sustainable Design market with this definitive industry report. Spanning from 2019 to 2033, this comprehensive analysis delves into market dynamics, key players, and future trajectories. Optimized with high-volume SEO keywords such as "sustainable architecture," "green building design," "ecological restoration," "circular economy principles," and "climate-resilient infrastructure," this report is essential for architects, urban planners, real estate developers, government agencies, and environmental consultants seeking to capitalize on the rapidly expanding global demand for eco-conscious solutions.
Environmentally Sustainable Design Market Structure & Competitive Landscape
The Environmentally Sustainable Design market exhibits a moderately concentrated structure, with a significant presence of specialized firms and a growing number of larger engineering and consulting groups integrating sustainable practices. Innovation drivers are primarily fueled by increasing environmental regulations, growing public awareness of climate change, and the economic benefits of energy-efficient and resource-conserving designs. For instance, government mandates for LEED certification or similar green building standards represent a substantial regulatory impact, pushing companies to adopt sustainable materials and techniques. Product substitutes, while evolving, primarily include traditional design approaches, but the inherent long-term cost savings and improved occupant well-being offered by sustainable designs are increasingly outweighing initial perceived differences. End-user segmentation shows a strong demand from the Enterprise sector, driven by corporate social responsibility initiatives and operational cost reductions, followed by Government for public infrastructure projects and Personal for residential and small-scale developments. Mergers and acquisitions (M&A) activity is on the rise as larger entities seek to acquire specialized expertise and expand their sustainable design portfolios. We anticipate over Billion 100 in M&A transactions within the forecast period. Concentration ratios in key sub-segments are estimated to be between 0.55 and 0.70.
Environmentally Sustainable Design Market Trends & Opportunities
The Environmentally Sustainable Design market is experiencing robust growth, projected to achieve a Compound Annual Growth Rate (CAGR) of xx% from Billion 1,000 in 2025 to an estimated Billion 2,500 by 2033. This expansion is driven by a confluence of technological advancements, shifting consumer preferences, and evolving regulatory landscapes. Technological shifts are paramount, with innovations in materials science leading to the development of bio-based and recycled construction materials, smart building technologies for energy optimization, and advanced lifecycle assessment tools. The integration of Building Information Modeling (BIM) for sustainable design workflows is becoming standard practice, enhancing efficiency and accuracy. Consumer preferences are increasingly leaning towards healthy, energy-efficient, and environmentally responsible buildings, whether for residential, commercial, or public use. This heightened awareness is influencing purchasing decisions and driving demand for certified green buildings.
Competitive dynamics are intensifying, with established design firms, engineering consultancies, and emerging niche players vying for market share. Companies are differentiating themselves through expertise in specific sustainable design typologies, such as net-zero energy buildings, passive house standards, and biophilic design. The opportunity lies not only in new construction but also in the retrofitting of existing infrastructure to meet modern sustainability benchmarks. The market penetration rate for certified sustainable buildings, while varying by region, is steadily increasing, projected to reach xx% by 2033. Furthermore, the growing emphasis on resilience in the face of climate change is opening new avenues for sustainable design in areas such as flood mitigation, heat island effect reduction, and disaster-resistant construction. The global market size for environmentally sustainable design services was valued at approximately Billion 800 in 2024, with significant growth anticipated.
Dominant Markets & Segments in Environmentally Sustainable Design
The Enterprise segment currently dominates the Environmentally Sustainable Design market, driven by a compelling combination of economic advantages and corporate responsibility mandates. Companies are increasingly recognizing the long-term cost savings associated with energy-efficient buildings, reduced operational expenses, and enhanced property values. Furthermore, a strong focus on Environmental, Social, and Governance (ESG) criteria by investors and stakeholders is compelling corporations to invest in sustainable practices and showcase their commitment to environmental stewardship. This translates into substantial demand for Landscape Planning and Repair Consultation services aimed at improving the ecological footprint of existing corporate campuses and new developments.
Key growth drivers within the Enterprise segment include:
- Increasing pressure from investors and stakeholders for ESG compliance.
- The business case for reduced operational costs through energy and water efficiency.
- Enhanced brand reputation and market differentiation through visible sustainability efforts.
- The need to comply with evolving corporate sustainability reporting standards.
The Government segment is a significant and growing contributor, particularly in regions with strong environmental policies and public infrastructure development initiatives. Governments are increasingly prioritizing sustainable solutions for public buildings, transportation networks, and urban planning projects, aiming to reduce their environmental impact and set an example for the private sector. Demand for Landscape Planning for public parks, green infrastructure, and ecological restoration projects is substantial.
Key growth drivers within the Government segment include:
- Implementation of stricter environmental regulations and building codes.
- Government stimulus packages and funding for green infrastructure development.
- The need for climate-resilient infrastructure and adaptation strategies.
- Public demand for healthier and more livable urban environments.
The Personal segment, while smaller in individual project value, represents a growing area of opportunity, fueled by increased environmental awareness among homeowners and individuals seeking healthier living spaces. Demand for Repair Consultation for eco-friendly home renovations and Landscape Planning for sustainable gardens and outdoor spaces is steadily rising.
Key growth drivers within the Personal segment include:
- Growing consumer awareness of climate change and environmental issues.
- Desire for healthier indoor environments and reduced energy bills.
- Increased availability of eco-friendly materials and technologies for residential use.
Geographically, North America and Europe currently lead the market due to established regulatory frameworks and a high level of environmental consciousness. However, the Asia-Pacific region is poised for rapid growth, driven by significant infrastructure development, increasing urbanization, and a growing focus on sustainability in countries like China and India. The market for Landscape Planning is projected to see the highest growth, followed by Repair Consultation as existing building stock is retrofitted for sustainability.
Environmentally Sustainable Design Product Analysis
Environmentally Sustainable Design is characterized by innovative approaches focused on minimizing environmental impact throughout a project's lifecycle. Key product innovations include the development and application of low-carbon concrete alternatives, recycled and bio-based insulation materials, and high-performance fenestration systems designed for energy efficiency. Smart building technologies, such as integrated sensor networks for optimizing energy and water consumption, and advanced HVAC systems that utilize renewable energy sources, are also gaining traction. The competitive advantage for companies lies in their ability to integrate these technologies seamlessly into design solutions, offering clients reduced operational costs, improved occupant health and well-being, and enhanced environmental performance. Applications range from master-planned communities and commercial office buildings to educational institutions and healthcare facilities, demonstrating the versatility and broad applicability of sustainable design principles.
Key Drivers, Barriers & Challenges in Environmentally Sustainable Design
Key Drivers: The Environmentally Sustainable Design market is propelled by a powerful synergy of forces. Technological advancements in materials science and smart building systems are making sustainable options more viable and cost-effective. Economic drivers like long-term operational cost savings through energy and water efficiency, coupled with increasing property values for green buildings, present a compelling financial case. Policy-driven factors, such as stringent building codes, government incentives for green construction, and international climate agreements, are creating a favorable regulatory environment. For example, the widespread adoption of LEED and BREEAM certifications acts as a significant catalyst. The increasing consumer and corporate demand for environmentally responsible solutions, driven by a heightened awareness of climate change and social responsibility, further fuels market growth.
Barriers & Challenges: Despite its growth, the market faces several restraints. Regulatory hurdles, particularly in regions with less developed green building standards, can slow adoption. Supply chain issues for specialized sustainable materials can lead to increased costs and project delays, impacting an estimated xx% of projects. Competitive pressures from traditional, lower-cost design methods remain a challenge, especially in price-sensitive markets. The perceived higher upfront cost of some sustainable solutions, though often offset by long-term savings, can be a significant barrier for some clients. Lack of skilled professionals trained in sustainable design principles and technologies also presents a challenge for widespread implementation. Finally, market fragmentation and the need for greater industry-wide education on the benefits of sustainable design can hinder broader market penetration.
Growth Drivers in the Environmentally Sustainable Design Market
The Environmentally Sustainable Design market is experiencing significant growth driven by several key factors. Technological innovation is at the forefront, with advancements in energy-efficient materials, smart building systems, and renewable energy integration making sustainable designs more practical and cost-effective. Economic incentives, including government subsidies, tax credits for green buildings, and the demonstrable long-term operational cost savings, are making sustainability an attractive investment for both corporate and individual clients. Regulatory mandates and increasingly stringent environmental policies worldwide are creating a favorable landscape, compelling developers and businesses to adopt sustainable practices. Furthermore, a growing societal awareness and demand for healthier, environmentally responsible living and working spaces are directly influencing market expansion.
Challenges Impacting Environmentally Sustainable Design Growth
Despite its positive trajectory, the growth of the Environmentally Sustainable Design market is impacted by several challenges. Regulatory complexities and the lack of standardized green building codes across different jurisdictions can create confusion and slow down adoption. Supply chain disruptions for specialized eco-friendly materials can lead to increased costs and project timelines, affecting the feasibility of some projects. Intense competitive pressure from established traditional design firms, often perceived as offering lower initial costs, remains a significant barrier. The perception of higher upfront investment for sustainable solutions, although often offset by long-term benefits, can deter some clients. Additionally, a shortage of skilled professionals with expertise in sustainable design and green building technologies can hinder widespread implementation and quality assurance.
Key Players Shaping the Environmentally Sustainable Design Market
- Ecological Design
- Indigo Ecological Design
- Davey Resource Group
- Wilkinson Ecological
- Terrapin
- Great Ecology
- Roth Ecological Design International
- Busy Bee Ecological Designs
- UES
- WSP
- Beijing ZEHO Waterfront Ecological Environment Treatment
- Nanjing Puhou
- PB Holding
Significant Environmentally Sustainable Design Industry Milestones
- 2019: Increased global focus on circular economy principles, influencing product design and material sourcing in construction.
- 2020: Launch of the Green Building Council's updated sustainability metrics, driving innovation in energy efficiency and embodied carbon reduction.
- 2021: Growing adoption of life cycle assessment (LCA) tools for evaluating the environmental impact of building materials and designs.
- 2022: Significant rise in smart building technology integration for real-time energy monitoring and optimization.
- 2023: Major advancements in bio-based and recycled construction materials, offering more sustainable alternatives.
- 2024: Increased governmental focus on climate resilience and adaptation, driving demand for sustainable design in infrastructure projects.
Future Outlook for Environmentally Sustainable Design Market
The future outlook for the Environmentally Sustainable Design market is exceptionally strong, driven by continued technological innovation, escalating environmental concerns, and supportive governmental policies. Strategic opportunities lie in the expanding retrofitting market for existing buildings, the development of net-zero and carbon-positive structures, and the integration of nature-based solutions into urban planning. The market is expected to benefit from further advancements in material science, digital design tools, and renewable energy integration, making sustainable buildings more accessible and cost-effective. The increasing demand from emerging economies and the growing emphasis on the health and well-being of occupants will further propel market expansion, positioning environmentally sustainable design as a cornerstone of future development.
Environmentally Sustainable Design Segmentation
-
1. Application
- 1.1. Government
- 1.2. Enterprise
- 1.3. Personal
-
2. Types
- 2.1. Repair Consultation
- 2.2. Landscape Planning
- 2.3. Others
Environmentally Sustainable Design Segmentation By Geography
-
1. North America
- 1.1. United States
- 1.2. Canada
- 1.3. Mexico
-
2. South America
- 2.1. Brazil
- 2.2. Argentina
- 2.3. Rest of South America
-
3. Europe
- 3.1. United Kingdom
- 3.2. Germany
- 3.3. France
- 3.4. Italy
- 3.5. Spain
- 3.6. Russia
- 3.7. Benelux
- 3.8. Nordics
- 3.9. Rest of Europe
-
4. Middle East & Africa
- 4.1. Turkey
- 4.2. Israel
- 4.3. GCC
- 4.4. North Africa
- 4.5. South Africa
- 4.6. Rest of Middle East & Africa
-
5. Asia Pacific
- 5.1. China
- 5.2. India
- 5.3. Japan
- 5.4. South Korea
- 5.5. ASEAN
- 5.6. Oceania
- 5.7. Rest of Asia Pacific
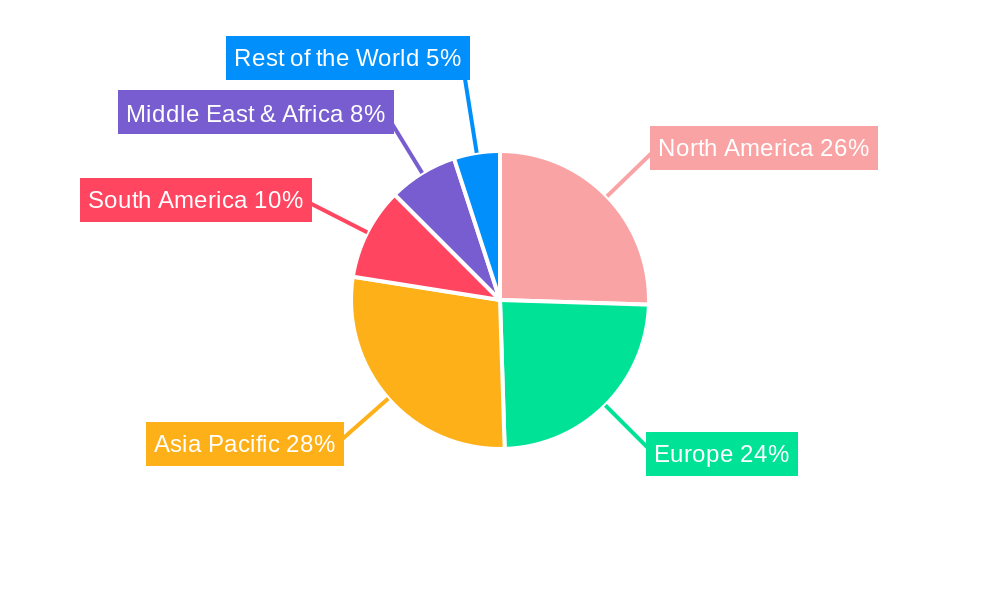
Environmentally Sustainable Design Regional Market Share
Geographic Coverage of Environmentally Sustainable Design
Environmentally Sustainable Design REPORT HIGHLIGHTS
| Aspects | Details |
|---|---|
| Study Period | 2020-2034 |
| Base Year | 2025 |
| Estimated Year | 2026 |
| Forecast Period | 2026-2034 |
| Historical Period | 2020-2025 |
| Growth Rate | CAGR of 0.6% from 2020-2034 |
| Segmentation |
|
Table of Contents
- 1. Introduction
- 1.1. Research Scope
- 1.2. Market Segmentation
- 1.3. Research Methodology
- 1.4. Definitions and Assumptions
- 2. Executive Summary
- 2.1. Introduction
- 3. Market Dynamics
- 3.1. Introduction
- 3.2. Market Drivers
- 3.3. Market Restrains
- 3.4. Market Trends
- 4. Market Factor Analysis
- 4.1. Porters Five Forces
- 4.2. Supply/Value Chain
- 4.3. PESTEL analysis
- 4.4. Market Entropy
- 4.5. Patent/Trademark Analysis
- 5. Global Environmentally Sustainable Design Analysis, Insights and Forecast, 2020-2032
- 5.1. Market Analysis, Insights and Forecast - by Application
- 5.1.1. Government
- 5.1.2. Enterprise
- 5.1.3. Personal
- 5.2. Market Analysis, Insights and Forecast - by Types
- 5.2.1. Repair Consultation
- 5.2.2. Landscape Planning
- 5.2.3. Others
- 5.3. Market Analysis, Insights and Forecast - by Region
- 5.3.1. North America
- 5.3.2. South America
- 5.3.3. Europe
- 5.3.4. Middle East & Africa
- 5.3.5. Asia Pacific
- 5.1. Market Analysis, Insights and Forecast - by Application
- 6. North America Environmentally Sustainable Design Analysis, Insights and Forecast, 2020-2032
- 6.1. Market Analysis, Insights and Forecast - by Application
- 6.1.1. Government
- 6.1.2. Enterprise
- 6.1.3. Personal
- 6.2. Market Analysis, Insights and Forecast - by Types
- 6.2.1. Repair Consultation
- 6.2.2. Landscape Planning
- 6.2.3. Others
- 6.1. Market Analysis, Insights and Forecast - by Application
- 7. South America Environmentally Sustainable Design Analysis, Insights and Forecast, 2020-2032
- 7.1. Market Analysis, Insights and Forecast - by Application
- 7.1.1. Government
- 7.1.2. Enterprise
- 7.1.3. Personal
- 7.2. Market Analysis, Insights and Forecast - by Types
- 7.2.1. Repair Consultation
- 7.2.2. Landscape Planning
- 7.2.3. Others
- 7.1. Market Analysis, Insights and Forecast - by Application
- 8. Europe Environmentally Sustainable Design Analysis, Insights and Forecast, 2020-2032
- 8.1. Market Analysis, Insights and Forecast - by Application
- 8.1.1. Government
- 8.1.2. Enterprise
- 8.1.3. Personal
- 8.2. Market Analysis, Insights and Forecast - by Types
- 8.2.1. Repair Consultation
- 8.2.2. Landscape Planning
- 8.2.3. Others
- 8.1. Market Analysis, Insights and Forecast - by Application
- 9. Middle East & Africa Environmentally Sustainable Design Analysis, Insights and Forecast, 2020-2032
- 9.1. Market Analysis, Insights and Forecast - by Application
- 9.1.1. Government
- 9.1.2. Enterprise
- 9.1.3. Personal
- 9.2. Market Analysis, Insights and Forecast - by Types
- 9.2.1. Repair Consultation
- 9.2.2. Landscape Planning
- 9.2.3. Others
- 9.1. Market Analysis, Insights and Forecast - by Application
- 10. Asia Pacific Environmentally Sustainable Design Analysis, Insights and Forecast, 2020-2032
- 10.1. Market Analysis, Insights and Forecast - by Application
- 10.1.1. Government
- 10.1.2. Enterprise
- 10.1.3. Personal
- 10.2. Market Analysis, Insights and Forecast - by Types
- 10.2.1. Repair Consultation
- 10.2.2. Landscape Planning
- 10.2.3. Others
- 10.1. Market Analysis, Insights and Forecast - by Application
- 11. Competitive Analysis
- 11.1. Global Market Share Analysis 2025
- 11.2. Company Profiles
- 11.2.1 Ecological Design
- 11.2.1.1. Overview
- 11.2.1.2. Products
- 11.2.1.3. SWOT Analysis
- 11.2.1.4. Recent Developments
- 11.2.1.5. Financials (Based on Availability)
- 11.2.2 Indigo Ecological Design
- 11.2.2.1. Overview
- 11.2.2.2. Products
- 11.2.2.3. SWOT Analysis
- 11.2.2.4. Recent Developments
- 11.2.2.5. Financials (Based on Availability)
- 11.2.3 Davey Resource Group
- 11.2.3.1. Overview
- 11.2.3.2. Products
- 11.2.3.3. SWOT Analysis
- 11.2.3.4. Recent Developments
- 11.2.3.5. Financials (Based on Availability)
- 11.2.4 Wilkinson Ecological
- 11.2.4.1. Overview
- 11.2.4.2. Products
- 11.2.4.3. SWOT Analysis
- 11.2.4.4. Recent Developments
- 11.2.4.5. Financials (Based on Availability)
- 11.2.5 Terrapin
- 11.2.5.1. Overview
- 11.2.5.2. Products
- 11.2.5.3. SWOT Analysis
- 11.2.5.4. Recent Developments
- 11.2.5.5. Financials (Based on Availability)
- 11.2.6 Great Ecology
- 11.2.6.1. Overview
- 11.2.6.2. Products
- 11.2.6.3. SWOT Analysis
- 11.2.6.4. Recent Developments
- 11.2.6.5. Financials (Based on Availability)
- 11.2.7 Roth Ecological Design International
- 11.2.7.1. Overview
- 11.2.7.2. Products
- 11.2.7.3. SWOT Analysis
- 11.2.7.4. Recent Developments
- 11.2.7.5. Financials (Based on Availability)
- 11.2.8 Busy Bee Ecological Designs
- 11.2.8.1. Overview
- 11.2.8.2. Products
- 11.2.8.3. SWOT Analysis
- 11.2.8.4. Recent Developments
- 11.2.8.5. Financials (Based on Availability)
- 11.2.9 UES
- 11.2.9.1. Overview
- 11.2.9.2. Products
- 11.2.9.3. SWOT Analysis
- 11.2.9.4. Recent Developments
- 11.2.9.5. Financials (Based on Availability)
- 11.2.10 WSP
- 11.2.10.1. Overview
- 11.2.10.2. Products
- 11.2.10.3. SWOT Analysis
- 11.2.10.4. Recent Developments
- 11.2.10.5. Financials (Based on Availability)
- 11.2.11 Beijing ZEHO Waterfront Ecological Environment Treatment
- 11.2.11.1. Overview
- 11.2.11.2. Products
- 11.2.11.3. SWOT Analysis
- 11.2.11.4. Recent Developments
- 11.2.11.5. Financials (Based on Availability)
- 11.2.12 Nanjing Puhou
- 11.2.12.1. Overview
- 11.2.12.2. Products
- 11.2.12.3. SWOT Analysis
- 11.2.12.4. Recent Developments
- 11.2.12.5. Financials (Based on Availability)
- 11.2.13 PB Holding
- 11.2.13.1. Overview
- 11.2.13.2. Products
- 11.2.13.3. SWOT Analysis
- 11.2.13.4. Recent Developments
- 11.2.13.5. Financials (Based on Availability)
- 11.2.1 Ecological Design
List of Figures
- Figure 1: Global Environmentally Sustainable Design Revenue Breakdown (undefined, %) by Region 2025 & 2033
- Figure 2: North America Environmentally Sustainable Design Revenue (undefined), by Application 2025 & 2033
- Figure 3: North America Environmentally Sustainable Design Revenue Share (%), by Application 2025 & 2033
- Figure 4: North America Environmentally Sustainable Design Revenue (undefined), by Types 2025 & 2033
- Figure 5: North America Environmentally Sustainable Design Revenue Share (%), by Types 2025 & 2033
- Figure 6: North America Environmentally Sustainable Design Revenue (undefined), by Country 2025 & 2033
- Figure 7: North America Environmentally Sustainable Design Revenue Share (%), by Country 2025 & 2033
- Figure 8: South America Environmentally Sustainable Design Revenue (undefined), by Application 2025 & 2033
- Figure 9: South America Environmentally Sustainable Design Revenue Share (%), by Application 2025 & 2033
- Figure 10: South America Environmentally Sustainable Design Revenue (undefined), by Types 2025 & 2033
- Figure 11: South America Environmentally Sustainable Design Revenue Share (%), by Types 2025 & 2033
- Figure 12: South America Environmentally Sustainable Design Revenue (undefined), by Country 2025 & 2033
- Figure 13: South America Environmentally Sustainable Design Revenue Share (%), by Country 2025 & 2033
- Figure 14: Europe Environmentally Sustainable Design Revenue (undefined), by Application 2025 & 2033
- Figure 15: Europe Environmentally Sustainable Design Revenue Share (%), by Application 2025 & 2033
- Figure 16: Europe Environmentally Sustainable Design Revenue (undefined), by Types 2025 & 2033
- Figure 17: Europe Environmentally Sustainable Design Revenue Share (%), by Types 2025 & 2033
- Figure 18: Europe Environmentally Sustainable Design Revenue (undefined), by Country 2025 & 2033
- Figure 19: Europe Environmentally Sustainable Design Revenue Share (%), by Country 2025 & 2033
- Figure 20: Middle East & Africa Environmentally Sustainable Design Revenue (undefined), by Application 2025 & 2033
- Figure 21: Middle East & Africa Environmentally Sustainable Design Revenue Share (%), by Application 2025 & 2033
- Figure 22: Middle East & Africa Environmentally Sustainable Design Revenue (undefined), by Types 2025 & 2033
- Figure 23: Middle East & Africa Environmentally Sustainable Design Revenue Share (%), by Types 2025 & 2033
- Figure 24: Middle East & Africa Environmentally Sustainable Design Revenue (undefined), by Country 2025 & 2033
- Figure 25: Middle East & Africa Environmentally Sustainable Design Revenue Share (%), by Country 2025 & 2033
- Figure 26: Asia Pacific Environmentally Sustainable Design Revenue (undefined), by Application 2025 & 2033
- Figure 27: Asia Pacific Environmentally Sustainable Design Revenue Share (%), by Application 2025 & 2033
- Figure 28: Asia Pacific Environmentally Sustainable Design Revenue (undefined), by Types 2025 & 2033
- Figure 29: Asia Pacific Environmentally Sustainable Design Revenue Share (%), by Types 2025 & 2033
- Figure 30: Asia Pacific Environmentally Sustainable Design Revenue (undefined), by Country 2025 & 2033
- Figure 31: Asia Pacific Environmentally Sustainable Design Revenue Share (%), by Country 2025 & 2033
List of Tables
- Table 1: Global Environmentally Sustainable Design Revenue undefined Forecast, by Application 2020 & 2033
- Table 2: Global Environmentally Sustainable Design Revenue undefined Forecast, by Types 2020 & 2033
- Table 3: Global Environmentally Sustainable Design Revenue undefined Forecast, by Region 2020 & 2033
- Table 4: Global Environmentally Sustainable Design Revenue undefined Forecast, by Application 2020 & 2033
- Table 5: Global Environmentally Sustainable Design Revenue undefined Forecast, by Types 2020 & 2033
- Table 6: Global Environmentally Sustainable Design Revenue undefined Forecast, by Country 2020 & 2033
- Table 7: United States Environmentally Sustainable Design Revenue (undefined) Forecast, by Application 2020 & 2033
- Table 8: Canada Environmentally Sustainable Design Revenue (undefined) Forecast, by Application 2020 & 2033
- Table 9: Mexico Environmentally Sustainable Design Revenue (undefined) Forecast, by Application 2020 & 2033
- Table 10: Global Environmentally Sustainable Design Revenue undefined Forecast, by Application 2020 & 2033
- Table 11: Global Environmentally Sustainable Design Revenue undefined Forecast, by Types 2020 & 2033
- Table 12: Global Environmentally Sustainable Design Revenue undefined Forecast, by Country 2020 & 2033
- Table 13: Brazil Environmentally Sustainable Design Revenue (undefined) Forecast, by Application 2020 & 2033
- Table 14: Argentina Environmentally Sustainable Design Revenue (undefined) Forecast, by Application 2020 & 2033
- Table 15: Rest of South America Environmentally Sustainable Design Revenue (undefined) Forecast, by Application 2020 & 2033
- Table 16: Global Environmentally Sustainable Design Revenue undefined Forecast, by Application 2020 & 2033
- Table 17: Global Environmentally Sustainable Design Revenue undefined Forecast, by Types 2020 & 2033
- Table 18: Global Environmentally Sustainable Design Revenue undefined Forecast, by Country 2020 & 2033
- Table 19: United Kingdom Environmentally Sustainable Design Revenue (undefined) Forecast, by Application 2020 & 2033
- Table 20: Germany Environmentally Sustainable Design Revenue (undefined) Forecast, by Application 2020 & 2033
- Table 21: France Environmentally Sustainable Design Revenue (undefined) Forecast, by Application 2020 & 2033
- Table 22: Italy Environmentally Sustainable Design Revenue (undefined) Forecast, by Application 2020 & 2033
- Table 23: Spain Environmentally Sustainable Design Revenue (undefined) Forecast, by Application 2020 & 2033
- Table 24: Russia Environmentally Sustainable Design Revenue (undefined) Forecast, by Application 2020 & 2033
- Table 25: Benelux Environmentally Sustainable Design Revenue (undefined) Forecast, by Application 2020 & 2033
- Table 26: Nordics Environmentally Sustainable Design Revenue (undefined) Forecast, by Application 2020 & 2033
- Table 27: Rest of Europe Environmentally Sustainable Design Revenue (undefined) Forecast, by Application 2020 & 2033
- Table 28: Global Environmentally Sustainable Design Revenue undefined Forecast, by Application 2020 & 2033
- Table 29: Global Environmentally Sustainable Design Revenue undefined Forecast, by Types 2020 & 2033
- Table 30: Global Environmentally Sustainable Design Revenue undefined Forecast, by Country 2020 & 2033
- Table 31: Turkey Environmentally Sustainable Design Revenue (undefined) Forecast, by Application 2020 & 2033
- Table 32: Israel Environmentally Sustainable Design Revenue (undefined) Forecast, by Application 2020 & 2033
- Table 33: GCC Environmentally Sustainable Design Revenue (undefined) Forecast, by Application 2020 & 2033
- Table 34: North Africa Environmentally Sustainable Design Revenue (undefined) Forecast, by Application 2020 & 2033
- Table 35: South Africa Environmentally Sustainable Design Revenue (undefined) Forecast, by Application 2020 & 2033
- Table 36: Rest of Middle East & Africa Environmentally Sustainable Design Revenue (undefined) Forecast, by Application 2020 & 2033
- Table 37: Global Environmentally Sustainable Design Revenue undefined Forecast, by Application 2020 & 2033
- Table 38: Global Environmentally Sustainable Design Revenue undefined Forecast, by Types 2020 & 2033
- Table 39: Global Environmentally Sustainable Design Revenue undefined Forecast, by Country 2020 & 2033
- Table 40: China Environmentally Sustainable Design Revenue (undefined) Forecast, by Application 2020 & 2033
- Table 41: India Environmentally Sustainable Design Revenue (undefined) Forecast, by Application 2020 & 2033
- Table 42: Japan Environmentally Sustainable Design Revenue (undefined) Forecast, by Application 2020 & 2033
- Table 43: South Korea Environmentally Sustainable Design Revenue (undefined) Forecast, by Application 2020 & 2033
- Table 44: ASEAN Environmentally Sustainable Design Revenue (undefined) Forecast, by Application 2020 & 2033
- Table 45: Oceania Environmentally Sustainable Design Revenue (undefined) Forecast, by Application 2020 & 2033
- Table 46: Rest of Asia Pacific Environmentally Sustainable Design Revenue (undefined) Forecast, by Application 2020 & 2033
Frequently Asked Questions
1. What is the projected Compound Annual Growth Rate (CAGR) of the Environmentally Sustainable Design?
The projected CAGR is approximately 0.6%.
2. Which companies are prominent players in the Environmentally Sustainable Design?
Key companies in the market include Ecological Design, Indigo Ecological Design, Davey Resource Group, Wilkinson Ecological, Terrapin, Great Ecology, Roth Ecological Design International, Busy Bee Ecological Designs, UES, WSP, Beijing ZEHO Waterfront Ecological Environment Treatment, Nanjing Puhou, PB Holding.
3. What are the main segments of the Environmentally Sustainable Design?
The market segments include Application, Types.
4. Can you provide details about the market size?
The market size is estimated to be USD XXX N/A as of 2022.
5. What are some drivers contributing to market growth?
N/A
6. What are the notable trends driving market growth?
N/A
7. Are there any restraints impacting market growth?
N/A
8. Can you provide examples of recent developments in the market?
N/A
9. What pricing options are available for accessing the report?
Pricing options include single-user, multi-user, and enterprise licenses priced at USD 3950.00, USD 5925.00, and USD 7900.00 respectively.
10. Is the market size provided in terms of value or volume?
The market size is provided in terms of value, measured in N/A.
11. Are there any specific market keywords associated with the report?
Yes, the market keyword associated with the report is "Environmentally Sustainable Design," which aids in identifying and referencing the specific market segment covered.
12. How do I determine which pricing option suits my needs best?
The pricing options vary based on user requirements and access needs. Individual users may opt for single-user licenses, while businesses requiring broader access may choose multi-user or enterprise licenses for cost-effective access to the report.
13. Are there any additional resources or data provided in the Environmentally Sustainable Design report?
While the report offers comprehensive insights, it's advisable to review the specific contents or supplementary materials provided to ascertain if additional resources or data are available.
14. How can I stay updated on further developments or reports in the Environmentally Sustainable Design?
To stay informed about further developments, trends, and reports in the Environmentally Sustainable Design, consider subscribing to industry newsletters, following relevant companies and organizations, or regularly checking reputable industry news sources and publications.
Methodology
Step 1 - Identification of Relevant Samples Size from Population Database


Step 2 - Approaches for Defining Global Market Size (Value, Volume* & Price*)

Note*: In applicable scenarios
Step 3 - Data Sources
Primary Research
- Web Analytics
- Survey Reports
- Research Institute
- Latest Research Reports
- Opinion Leaders
Secondary Research
- Annual Reports
- White Paper
- Latest Press Release
- Industry Association
- Paid Database
- Investor Presentations

Step 4 - Data Triangulation
Involves using different sources of information in order to increase the validity of a study
These sources are likely to be stakeholders in a program - participants, other researchers, program staff, other community members, and so on.
Then we put all data in single framework & apply various statistical tools to find out the dynamic on the market.
During the analysis stage, feedback from the stakeholder groups would be compared to determine areas of agreement as well as areas of divergence