

Key Insights
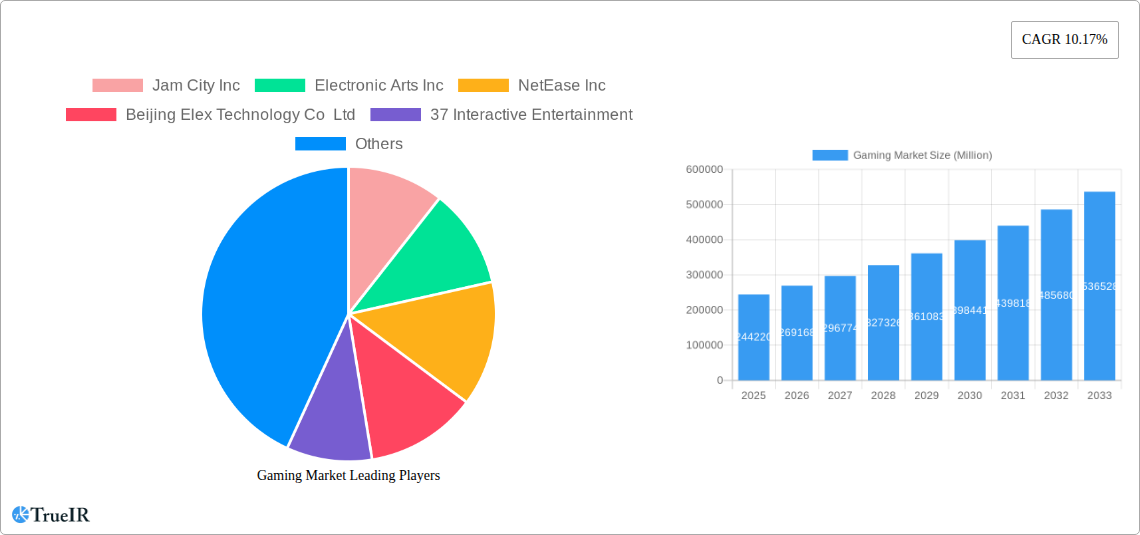
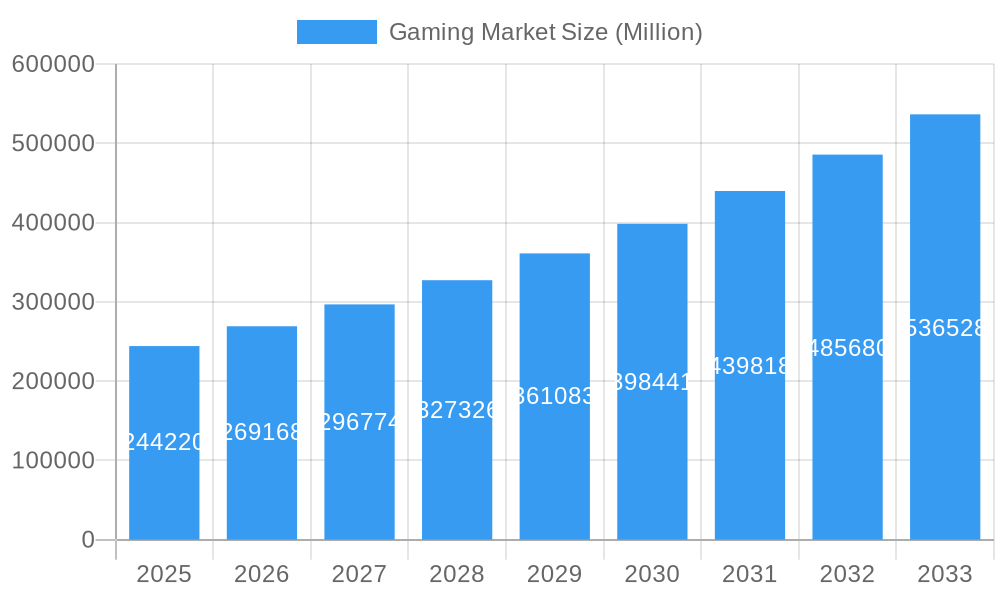
The global gaming market, valued at $244.22 billion in 2025, is projected to experience robust growth, exhibiting a Compound Annual Growth Rate (CAGR) of 10.17% from 2025 to 2033. This expansion is fueled by several key drivers. The increasing affordability and accessibility of gaming hardware, particularly mobile devices, have broadened the player base significantly. Furthermore, the rise of esports as a mainstream spectator sport, coupled with the continuous evolution of game genres and immersive technologies like virtual reality (VR) and augmented reality (AR), are driving significant investment and innovation within the industry. The market's segmentation reflects this diversity, with mobile gaming currently dominating, followed by console and PC gaming. The e-sports segment, however, is exhibiting the fastest growth rate, driven by lucrative sponsorships, prize pools, and a burgeoning viewership. Geographic distribution shows strong growth across all regions, particularly in Asia and Latin America, reflecting rising disposable incomes and increased internet penetration. Challenges remain, however, including concerns about game addiction and the need for responsible gaming practices. Competition among major players like Tencent, Sony, Microsoft, and Nintendo, along with smaller independent developers, fuels innovation and drives the market forward.
Gaming Market Market Size (In Billion)
The sustained growth forecast necessitates a strategic approach from industry players. Companies are increasingly focusing on personalized gaming experiences, cloud gaming services, and cross-platform compatibility. The development of innovative monetization models, including in-app purchases and subscription services, will be crucial for maintaining profitability. The integration of blockchain technology and NFTs represents a potentially disruptive force, though regulatory uncertainty remains a significant factor. Successful companies will adapt quickly to evolving consumer preferences, technological advancements, and regulatory landscapes, strategically positioning themselves within this dynamic and competitive market. This includes focusing on market-specific adaptations and localization strategies to maximize reach and engagement in diverse regions.
Gaming Market Company Market Share
Gaming Market Report: 2019-2033 - A Comprehensive Analysis
This dynamic report provides a comprehensive analysis of the global gaming market from 2019 to 2033, offering invaluable insights for industry stakeholders. Leveraging extensive data and expert analysis, this report unravels market trends, competitive landscapes, and future growth projections, empowering businesses to make informed decisions in this rapidly evolving sector. With a focus on key segments like Mobile Games, Console Games, Downloaded/Box PC games, and Esports, this report is an indispensable resource for understanding the current state and future trajectory of the gaming industry. The market is expected to reach xx Million by 2033.
Gaming Market Market Structure & Competitive Landscape
The global gaming market is characterized by a complex interplay of established giants and emerging players, resulting in a dynamic competitive landscape. Market concentration is relatively high, with a few major players holding significant market share. However, the market also displays a considerable level of fragmentation, especially in the mobile gaming segment. Innovation is a key driver, with continuous advancements in game technology, graphics, and online functionality shaping consumer preferences. Regulatory landscapes vary across different regions, impacting market access and operational strategies. Product substitution is minimal, with the core gaming experience remaining relatively consistent, although there is an increasing demand for more personalized experiences. End-user segmentation encompasses a wide spectrum, from casual mobile gamers to dedicated esports professionals. M&A activity is significant, with large companies acquiring smaller studios and expanding their portfolios. The average annual M&A volume over the historical period (2019-2024) was approximately xx Million deals. Concentration ratios reveal a moderately concentrated market, with the top five players holding roughly xx% of the overall market share in 2024. This concentration is higher in the console gaming segment compared to mobile gaming.
Gaming Market Market Trends & Opportunities
The gaming market exhibits robust growth, fueled by technological advancements, changing consumer preferences, and expanding market access. The market size experienced a CAGR of xx% during the historical period (2019-2024) and is projected to grow at a CAGR of xx% during the forecast period (2025-2033), reaching an estimated value of xx Million by 2033. Technological shifts, such as the rise of cloud gaming and advancements in virtual reality (VR) and augmented reality (AR) technologies, are creating new opportunities for market expansion. Consumer preferences are shifting towards more immersive and interactive gaming experiences, demanding higher-quality graphics and more engaging gameplay. Competitive dynamics are intensifying, with companies investing heavily in research and development to stay ahead of the curve. The market penetration rate for mobile gaming has significantly increased, exceeding xx% in many regions, while the penetration of console gaming remains relatively high in developed markets. The emergence of esports as a mainstream entertainment form presents substantial opportunities for revenue generation and brand building.
Dominant Markets & Segments in Gaming Market
The Asia-Pacific region dominates the global gaming market, accounting for the largest market share in 2024. China and Japan are key contributors to this dominance. Within the gaming types, the mobile gaming segment leads the market in terms of revenue and user base.
Key Growth Drivers:
- Mobile Penetration: High smartphone penetration, particularly in developing economies, fuels mobile gaming growth.
- E-sports Boom: The rising popularity of esports attracts significant investments and viewership.
- Technological Advancements: Improved graphics, VR/AR technologies, and cloud gaming enhance the gaming experience.
- Government Support: Favorable government policies in certain regions encourage industry development.
Analysis of Market Dominance: The Asia-Pacific region's dominance is attributed to a large population base, high smartphone penetration, and a strong gaming culture. Mobile games' dominance stems from their accessibility, affordability, and suitability for casual gaming. Console games maintain a strong position in developed markets due to their advanced graphics and immersive experiences. Downloaded/Box PC gaming experiences consistent growth, driven by the continued popularity of PC gaming.
Gaming Market Product Analysis
Product innovation in the gaming market is characterized by a focus on enhancing user experience, creating more immersive environments, and expanding gaming accessibility across multiple platforms. Technological advancements like improved graphics rendering, realistic physics engines, and cross-platform play capabilities are driving product diversification. The competitive advantages lie in the ability to provide innovative and engaging gameplay, offering unique features and content that capture and retain player attention. The development of new game genres, integration of social features, and the utilization of advanced technologies such as AI are shaping the competitive landscape.
Key Drivers, Barriers & Challenges in Gaming Market
Key Drivers:
Technological advancements, such as improved graphics processing and the rise of cloud gaming, are driving market expansion. Economic factors, such as increased disposable income and the growing popularity of mobile gaming in emerging markets, are also contributing to growth. Supportive government policies in certain regions, encouraging industry development, play a significant role.
Key Challenges and Restraints:
Regulatory hurdles, such as the increasing scrutiny of loot boxes and microtransactions, can hinder market growth. Supply chain disruptions, impacting the availability of hardware components, can cause production delays and affect market supply. Intense competition among existing and emerging players puts downward pressure on profit margins. The estimated impact of these challenges on market growth is approximately xx Million annually.
Growth Drivers in the Gaming Market Market
Technological innovation is a major driver, including cloud gaming, VR/AR integration, and improved graphics. Increased disposable income and wider internet access in emerging markets fuels demand. Government support, particularly in regions prioritizing digital economies, fosters growth. The rising popularity of esports expands the market's reach and revenue streams.
Challenges Impacting Gaming Market Growth
Regulatory uncertainty surrounding loot boxes and in-game purchases impacts market growth negatively. Supply chain disruptions affect the availability of gaming hardware. Intense competition necessitates substantial investment in research and development to maintain market share.
Key Players Shaping the Gaming Market Market
- Jam City Inc
- Electronic Arts Inc
- NetEase Inc
- Beijing Elex Technology Co Ltd
- 37 Interactive Entertainment
- Microsoft Corporation
- Sega Sammy Holdings Inc
- Square Enix Holdings Co Ltd
- Ubisoft Entertainment SA
- Tencent Holdings Ltd
- Nintendo Co Ltd
- ZeptoLab UK limited
- Realnetworks LLC (Gamehouse)
- Take-Two Interactive Software Inc
- Apple Inc
- Bandai Namco Holdings Inc
- Nexon Co Ltd
- Sony Corporation
- Capcom Co Ltd
Significant Gaming Market Industry Milestones
- June 2024: Microsoft launched all-digital Xbox Series X and S consoles, alongside new game previews, significantly impacting the digital gaming segment.
- April 2024: Sony's PlayStation 5 Slim launch in India expanded market access and broadened the console's appeal to a wider consumer base.
Future Outlook for Gaming Market Market
The gaming market is poised for continued expansion, driven by technological innovations, growing consumer demand, and the rise of esports. Strategic partnerships, diversification into new platforms, and investment in innovative game development will be crucial for success. The market's potential is vast, with opportunities for growth across various segments and geographies. The market is expected to witness a significant expansion, with a substantial increase in revenue and user base over the forecast period.
Gaming Market Segmentation
-
1. Gaming Type
- 1.1. Mobile Games
- 1.2. Console Games
- 1.3. Downloaded/Box PC
- 1.4. E-sports
Gaming Market Segmentation By Geography
-
1. North America
- 1.1. United States
- 1.2. Canada
-
2. Europe
- 2.1. Germany
- 2.2. United Kingdom
- 2.3. France
- 2.4. Russia
- 2.5. Spain
- 2.6. Italy
-
3. Asia
- 3.1. China
- 3.2. Japan
- 3.3. South Korea
- 4. Australia and New Zealand
-
5. Latin America
- 5.1. Brazil
- 5.2. Argentina
- 5.3. Mexico
-
6. Middle East and Africa
- 6.1. United Arab Emirates
- 6.2. Saudi Arabia
- 6.3. Iran
- 6.4. Egypt
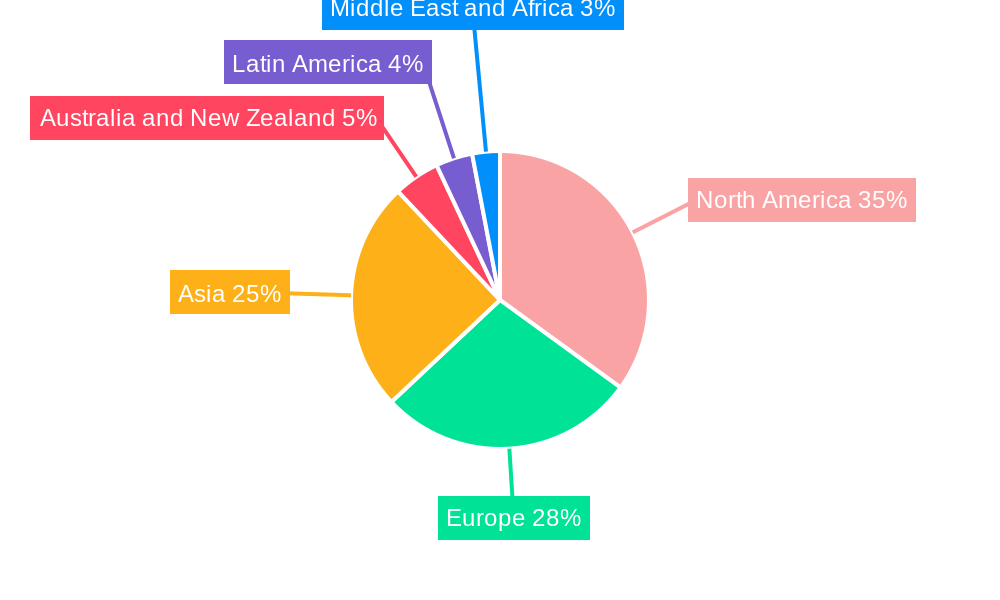
Gaming Market Regional Market Share
Geographic Coverage of Gaming Market
Gaming Market REPORT HIGHLIGHTS
| Aspects | Details |
|---|---|
| Study Period | 2020-2034 |
| Base Year | 2025 |
| Estimated Year | 2026 |
| Forecast Period | 2026-2034 |
| Historical Period | 2020-2025 |
| Growth Rate | CAGR of 10.17% from 2020-2034 |
| Segmentation |
|
Table of Contents
- 1. Introduction
- 1.1. Research Scope
- 1.2. Market Segmentation
- 1.3. Research Objective
- 1.4. Definitions and Assumptions
- 2. Executive Summary
- 2.1. Market Snapshot
- 3. Market Dynamics
- 3.1. Market Drivers
- 3.2. Market Restrains
- 3.3. Market Trends
- 3.4. Market Opportunities
- 4. Market Factor Analysis
- 4.1. Porters Five Forces
- 4.1.1. Bargaining Power of Suppliers
- 4.1.2. Bargaining Power of Buyers
- 4.1.3. Threat of New Entrants
- 4.1.4. Threat of Substitutes
- 4.1.5. Competitive Rivalry
- 4.2. PESTEL analysis
- 4.3. BCG Analysis
- 4.3.1. Stars (High Growth, High Market Share)
- 4.3.2. Cash Cows (Low Growth, High Market Share)
- 4.3.3. Question Mark (High Growth, Low Market Share)
- 4.3.4. Dogs (Low Growth, Low Market Share)
- 4.4. Ansoff Matrix Analysis
- 4.5. Supply Chain Analysis
- 4.6. Regulatory Landscape
- 4.7. Current Market Potential and Opportunity Assessment (TAM–SAM–SOM Framework)
- 4.8. TIR Analyst Note
- 4.1. Porters Five Forces
- 5. Market Analysis, Insights and Forecast 2021-2033
- 5.1. Market Analysis, Insights and Forecast - by Gaming Type
- 5.1.1. Mobile Games
- 5.1.2. Console Games
- 5.1.3. Downloaded/Box PC
- 5.1.4. E-sports
- 5.2. Market Analysis, Insights and Forecast - by Region
- 5.2.1. North America
- 5.2.2. Europe
- 5.2.3. Asia
- 5.2.4. Australia and New Zealand
- 5.2.5. Latin America
- 5.2.6. Middle East and Africa
- 5.1. Market Analysis, Insights and Forecast - by Gaming Type
- 6. Global Gaming Market Analysis, Insights and Forecast, 2021-2033
- 6.1. Market Analysis, Insights and Forecast - by Gaming Type
- 6.1.1. Mobile Games
- 6.1.2. Console Games
- 6.1.3. Downloaded/Box PC
- 6.1.4. E-sports
- 6.1. Market Analysis, Insights and Forecast - by Gaming Type
- 7. North America Gaming Market Analysis, Insights and Forecast, 2020-2032
- 7.1. Market Analysis, Insights and Forecast - by Gaming Type
- 7.1.1. Mobile Games
- 7.1.2. Console Games
- 7.1.3. Downloaded/Box PC
- 7.1.4. E-sports
- 7.1. Market Analysis, Insights and Forecast - by Gaming Type
- 8. Europe Gaming Market Analysis, Insights and Forecast, 2020-2032
- 8.1. Market Analysis, Insights and Forecast - by Gaming Type
- 8.1.1. Mobile Games
- 8.1.2. Console Games
- 8.1.3. Downloaded/Box PC
- 8.1.4. E-sports
- 8.1. Market Analysis, Insights and Forecast - by Gaming Type
- 9. Asia Gaming Market Analysis, Insights and Forecast, 2020-2032
- 9.1. Market Analysis, Insights and Forecast - by Gaming Type
- 9.1.1. Mobile Games
- 9.1.2. Console Games
- 9.1.3. Downloaded/Box PC
- 9.1.4. E-sports
- 9.1. Market Analysis, Insights and Forecast - by Gaming Type
- 10. Australia and New Zealand Gaming Market Analysis, Insights and Forecast, 2020-2032
- 10.1. Market Analysis, Insights and Forecast - by Gaming Type
- 10.1.1. Mobile Games
- 10.1.2. Console Games
- 10.1.3. Downloaded/Box PC
- 10.1.4. E-sports
- 10.1. Market Analysis, Insights and Forecast - by Gaming Type
- 11. Latin America Gaming Market Analysis, Insights and Forecast, 2020-2032
- 11.1. Market Analysis, Insights and Forecast - by Gaming Type
- 11.1.1. Mobile Games
- 11.1.2. Console Games
- 11.1.3. Downloaded/Box PC
- 11.1.4. E-sports
- 11.1. Market Analysis, Insights and Forecast - by Gaming Type
- 12. Middle East and Africa Gaming Market Analysis, Insights and Forecast, 2020-2032
- 12.1. Market Analysis, Insights and Forecast - by Gaming Type
- 12.1.1. Mobile Games
- 12.1.2. Console Games
- 12.1.3. Downloaded/Box PC
- 12.1.4. E-sports
- 12.1. Market Analysis, Insights and Forecast - by Gaming Type
- 13. Competitive Analysis
- 13.1. Company Profiles
- 13.1.1 Jam City Inc
- 13.1.1.1. Company Overview
- 13.1.1.2. Products
- 13.1.1.3. Company Financials
- 13.1.1.4. SWOT Analysis
- 13.1.2 Electronic Arts Inc
- 13.1.2.1. Company Overview
- 13.1.2.2. Products
- 13.1.2.3. Company Financials
- 13.1.2.4. SWOT Analysis
- 13.1.3 NetEase Inc
- 13.1.3.1. Company Overview
- 13.1.3.2. Products
- 13.1.3.3. Company Financials
- 13.1.3.4. SWOT Analysis
- 13.1.4 Beijing Elex Technology Co Ltd
- 13.1.4.1. Company Overview
- 13.1.4.2. Products
- 13.1.4.3. Company Financials
- 13.1.4.4. SWOT Analysis
- 13.1.5 37 Interactive Entertainment
- 13.1.5.1. Company Overview
- 13.1.5.2. Products
- 13.1.5.3. Company Financials
- 13.1.5.4. SWOT Analysis
- 13.1.6 Microsoft Corporation
- 13.1.6.1. Company Overview
- 13.1.6.2. Products
- 13.1.6.3. Company Financials
- 13.1.6.4. SWOT Analysis
- 13.1.7 Sega Sammy Holdings Inc
- 13.1.7.1. Company Overview
- 13.1.7.2. Products
- 13.1.7.3. Company Financials
- 13.1.7.4. SWOT Analysis
- 13.1.8 Square Enix Holdings Co Ltd
- 13.1.8.1. Company Overview
- 13.1.8.2. Products
- 13.1.8.3. Company Financials
- 13.1.8.4. SWOT Analysis
- 13.1.9 Ubisoft Entertainment SA
- 13.1.9.1. Company Overview
- 13.1.9.2. Products
- 13.1.9.3. Company Financials
- 13.1.9.4. SWOT Analysis
- 13.1.10 Tencent Holdings Ltd
- 13.1.10.1. Company Overview
- 13.1.10.2. Products
- 13.1.10.3. Company Financials
- 13.1.10.4. SWOT Analysis
- 13.1.11 Nintendo Co Ltd
- 13.1.11.1. Company Overview
- 13.1.11.2. Products
- 13.1.11.3. Company Financials
- 13.1.11.4. SWOT Analysis
- 13.1.12 ZeptoLab UK limited
- 13.1.12.1. Company Overview
- 13.1.12.2. Products
- 13.1.12.3. Company Financials
- 13.1.12.4. SWOT Analysis
- 13.1.13 Realnetworks LLC (Gamehouse)
- 13.1.13.1. Company Overview
- 13.1.13.2. Products
- 13.1.13.3. Company Financials
- 13.1.13.4. SWOT Analysis
- 13.1.14 Take-Two Interactive Software Inc
- 13.1.14.1. Company Overview
- 13.1.14.2. Products
- 13.1.14.3. Company Financials
- 13.1.14.4. SWOT Analysis
- 13.1.15 Apple Inc
- 13.1.15.1. Company Overview
- 13.1.15.2. Products
- 13.1.15.3. Company Financials
- 13.1.15.4. SWOT Analysis
- 13.1.16 Bandai Namco Holdings Inc
- 13.1.16.1. Company Overview
- 13.1.16.2. Products
- 13.1.16.3. Company Financials
- 13.1.16.4. SWOT Analysis
- 13.1.17 Nexon Co Ltd
- 13.1.17.1. Company Overview
- 13.1.17.2. Products
- 13.1.17.3. Company Financials
- 13.1.17.4. SWOT Analysis
- 13.1.18 Sony Corporation
- 13.1.18.1. Company Overview
- 13.1.18.2. Products
- 13.1.18.3. Company Financials
- 13.1.18.4. SWOT Analysis
- 13.1.19 Capcom Co Ltd
- 13.1.19.1. Company Overview
- 13.1.19.2. Products
- 13.1.19.3. Company Financials
- 13.1.19.4. SWOT Analysis
- 13.1.1 Jam City Inc
- 13.2. Market Entropy
- 13.2.1 Company's Key Areas Served
- 13.2.2 Recent Developments
- 13.3. Company Market Share Analysis 2025
- 13.3.1 Top 5 Companies Market Share Analysis
- 13.3.2 Top 3 Companies Market Share Analysis
- 13.4. List of Potential Customers
- 14. Research Methodology
List of Figures
- Figure 1: Global Gaming Market Revenue Breakdown (Million, %) by Region 2025 & 2033
- Figure 2: North America Gaming Market Revenue (Million), by Gaming Type 2025 & 2033
- Figure 3: North America Gaming Market Revenue Share (%), by Gaming Type 2025 & 2033
- Figure 4: North America Gaming Market Revenue (Million), by Country 2025 & 2033
- Figure 5: North America Gaming Market Revenue Share (%), by Country 2025 & 2033
- Figure 6: Europe Gaming Market Revenue (Million), by Gaming Type 2025 & 2033
- Figure 7: Europe Gaming Market Revenue Share (%), by Gaming Type 2025 & 2033
- Figure 8: Europe Gaming Market Revenue (Million), by Country 2025 & 2033
- Figure 9: Europe Gaming Market Revenue Share (%), by Country 2025 & 2033
- Figure 10: Asia Gaming Market Revenue (Million), by Gaming Type 2025 & 2033
- Figure 11: Asia Gaming Market Revenue Share (%), by Gaming Type 2025 & 2033
- Figure 12: Asia Gaming Market Revenue (Million), by Country 2025 & 2033
- Figure 13: Asia Gaming Market Revenue Share (%), by Country 2025 & 2033
- Figure 14: Australia and New Zealand Gaming Market Revenue (Million), by Gaming Type 2025 & 2033
- Figure 15: Australia and New Zealand Gaming Market Revenue Share (%), by Gaming Type 2025 & 2033
- Figure 16: Australia and New Zealand Gaming Market Revenue (Million), by Country 2025 & 2033
- Figure 17: Australia and New Zealand Gaming Market Revenue Share (%), by Country 2025 & 2033
- Figure 18: Latin America Gaming Market Revenue (Million), by Gaming Type 2025 & 2033
- Figure 19: Latin America Gaming Market Revenue Share (%), by Gaming Type 2025 & 2033
- Figure 20: Latin America Gaming Market Revenue (Million), by Country 2025 & 2033
- Figure 21: Latin America Gaming Market Revenue Share (%), by Country 2025 & 2033
- Figure 22: Middle East and Africa Gaming Market Revenue (Million), by Gaming Type 2025 & 2033
- Figure 23: Middle East and Africa Gaming Market Revenue Share (%), by Gaming Type 2025 & 2033
- Figure 24: Middle East and Africa Gaming Market Revenue (Million), by Country 2025 & 2033
- Figure 25: Middle East and Africa Gaming Market Revenue Share (%), by Country 2025 & 2033
List of Tables
- Table 1: Global Gaming Market Revenue Million Forecast, by Gaming Type 2020 & 2033
- Table 2: Global Gaming Market Revenue Million Forecast, by Region 2020 & 2033
- Table 3: Global Gaming Market Revenue Million Forecast, by Gaming Type 2020 & 2033
- Table 4: Global Gaming Market Revenue Million Forecast, by Country 2020 & 2033
- Table 5: United States Gaming Market Revenue (Million) Forecast, by Application 2020 & 2033
- Table 6: Canada Gaming Market Revenue (Million) Forecast, by Application 2020 & 2033
- Table 7: Global Gaming Market Revenue Million Forecast, by Gaming Type 2020 & 2033
- Table 8: Global Gaming Market Revenue Million Forecast, by Country 2020 & 2033
- Table 9: Germany Gaming Market Revenue (Million) Forecast, by Application 2020 & 2033
- Table 10: United Kingdom Gaming Market Revenue (Million) Forecast, by Application 2020 & 2033
- Table 11: France Gaming Market Revenue (Million) Forecast, by Application 2020 & 2033
- Table 12: Russia Gaming Market Revenue (Million) Forecast, by Application 2020 & 2033
- Table 13: Spain Gaming Market Revenue (Million) Forecast, by Application 2020 & 2033
- Table 14: Italy Gaming Market Revenue (Million) Forecast, by Application 2020 & 2033
- Table 15: Global Gaming Market Revenue Million Forecast, by Gaming Type 2020 & 2033
- Table 16: Global Gaming Market Revenue Million Forecast, by Country 2020 & 2033
- Table 17: China Gaming Market Revenue (Million) Forecast, by Application 2020 & 2033
- Table 18: Japan Gaming Market Revenue (Million) Forecast, by Application 2020 & 2033
- Table 19: South Korea Gaming Market Revenue (Million) Forecast, by Application 2020 & 2033
- Table 20: Global Gaming Market Revenue Million Forecast, by Gaming Type 2020 & 2033
- Table 21: Global Gaming Market Revenue Million Forecast, by Country 2020 & 2033
- Table 22: Global Gaming Market Revenue Million Forecast, by Gaming Type 2020 & 2033
- Table 23: Global Gaming Market Revenue Million Forecast, by Country 2020 & 2033
- Table 24: Brazil Gaming Market Revenue (Million) Forecast, by Application 2020 & 2033
- Table 25: Argentina Gaming Market Revenue (Million) Forecast, by Application 2020 & 2033
- Table 26: Mexico Gaming Market Revenue (Million) Forecast, by Application 2020 & 2033
- Table 27: Global Gaming Market Revenue Million Forecast, by Gaming Type 2020 & 2033
- Table 28: Global Gaming Market Revenue Million Forecast, by Country 2020 & 2033
- Table 29: United Arab Emirates Gaming Market Revenue (Million) Forecast, by Application 2020 & 2033
- Table 30: Saudi Arabia Gaming Market Revenue (Million) Forecast, by Application 2020 & 2033
- Table 31: Iran Gaming Market Revenue (Million) Forecast, by Application 2020 & 2033
- Table 32: Egypt Gaming Market Revenue (Million) Forecast, by Application 2020 & 2033
Frequently Asked Questions
1. What is the projected Compound Annual Growth Rate (CAGR) of the Gaming Market?
The projected CAGR is approximately 10.17%.
2. Which companies are prominent players in the Gaming Market?
Key companies in the market include Jam City Inc, Electronic Arts Inc, NetEase Inc, Beijing Elex Technology Co Ltd, 37 Interactive Entertainment, Microsoft Corporation, Sega Sammy Holdings Inc, Square Enix Holdings Co Ltd, Ubisoft Entertainment SA, Tencent Holdings Ltd, Nintendo Co Ltd, ZeptoLab UK limited, Realnetworks LLC (Gamehouse), Take-Two Interactive Software Inc, Apple Inc, Bandai Namco Holdings Inc, Nexon Co Ltd, Sony Corporation, Capcom Co Ltd.
3. What are the main segments of the Gaming Market?
The market segments include Gaming Type.
4. Can you provide details about the market size?
The market size is estimated to be USD 244.22 Million as of 2022.
5. What are some drivers contributing to market growth?
Rising Internet Penetration; Emergence of Cloud Gaming; Adoption of Gaming Platforms. such as E-sports Betting and Fantasy Sites.
6. What are the notable trends driving market growth?
Console Games Gaming Type Segment Holds Significant Market Share.
7. Are there any restraints impacting market growth?
Issues such as Piracy. Laws and Regulations. and Concerns Relating to Fraud During Gaming Transactions.
8. Can you provide examples of recent developments in the market?
June 2024: Microsoft unveiled an all-digital variant of its Xbox Series X and S consoles alongside previews for over a dozen games, notably the next "Call of Duty" installment. The tech giant showcased not just one but three consoles: a disc-less iteration of the Xbox Series X and S and a premium Series X model boasting a capacious 2-terabyte storage.
9. What pricing options are available for accessing the report?
Pricing options include single-user, multi-user, and enterprise licenses priced at USD 4750, USD 5250, and USD 8750 respectively.
10. Is the market size provided in terms of value or volume?
The market size is provided in terms of value, measured in Million.
11. Are there any specific market keywords associated with the report?
Yes, the market keyword associated with the report is "Gaming Market," which aids in identifying and referencing the specific market segment covered.
12. How do I determine which pricing option suits my needs best?
The pricing options vary based on user requirements and access needs. Individual users may opt for single-user licenses, while businesses requiring broader access may choose multi-user or enterprise licenses for cost-effective access to the report.
13. Are there any additional resources or data provided in the Gaming Market report?
While the report offers comprehensive insights, it's advisable to review the specific contents or supplementary materials provided to ascertain if additional resources or data are available.
14. How can I stay updated on further developments or reports in the Gaming Market?
To stay informed about further developments, trends, and reports in the Gaming Market, consider subscribing to industry newsletters, following relevant companies and organizations, or regularly checking reputable industry news sources and publications.
Methodology
Step 1 - Identification of Relevant Samples Size from Population Database


Step 2 - Approaches for Defining Global Market Size (Value, Volume* & Price*)

Note*: In applicable scenarios
Step 3 - Data Sources
Primary Research
- Web Analytics
- Survey Reports
- Research Institute
- Latest Research Reports
- Opinion Leaders
Secondary Research
- Annual Reports
- White Paper
- Latest Press Release
- Industry Association
- Paid Database
- Investor Presentations

Step 4 - Data Triangulation
Involves using different sources of information in order to increase the validity of a study
These sources are likely to be stakeholders in a program - participants, other researchers, program staff, other community members, and so on.
Then we put all data in single framework & apply various statistical tools to find out the dynamic on the market.
During the analysis stage, feedback from the stakeholder groups would be compared to determine areas of agreement as well as areas of divergence