

Key Insights
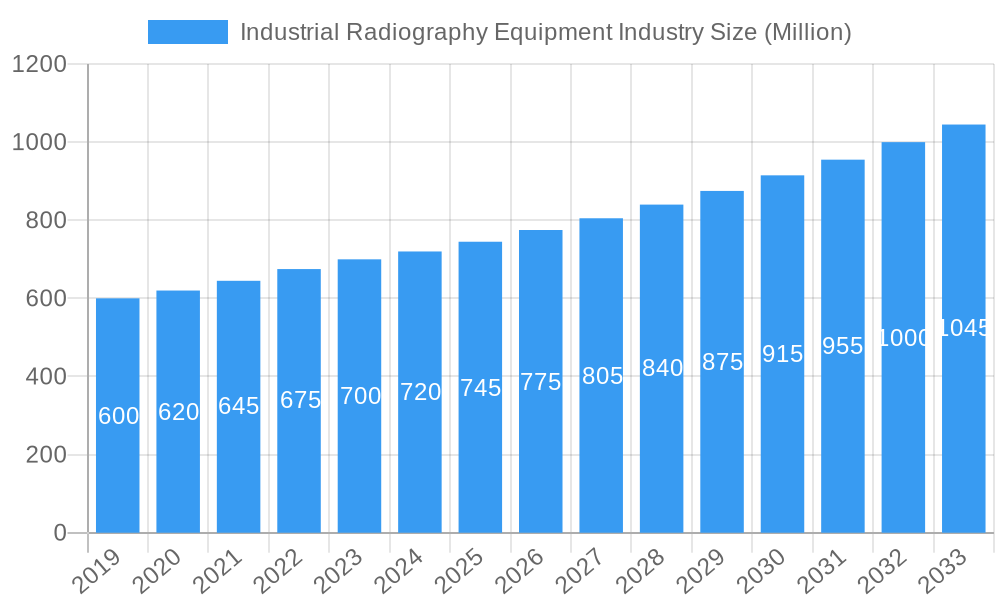
The Industrial Radiography Equipment market, valued at approximately $1.35 billion in the base year 2025, is projected for significant expansion. Anticipated to grow at a Compound Annual Growth Rate (CAGR) of 8.6%, this market's trajectory is shaped by escalating demand for Non-Destructive Testing (NDT) across aerospace, automotive, and energy sectors. Stringent safety regulations and quality control mandates are pivotal drivers, necessitating advanced inspection solutions. Technological innovations, including enhanced digital radiography systems delivering superior image quality and rapid processing, further fuel market momentum. The increasing integration of automation and digitalization in manufacturing presents opportunities for advanced radiography solutions, boosting operational efficiency and reducing costs.
Industrial Radiography Equipment Industry Market Size (In Billion)
Despite notable challenges such as high initial investment for sophisticated equipment and the requirement for skilled operators, the Industrial Radiography Equipment market demonstrates robust growth potential. The increasing complexity of manufacturing processes and the unwavering demand for high-quality products are accelerating the adoption of advanced NDT techniques like computed tomography (CT) and digital radiography. Geographically, North America and Europe currently lead due to concentrated manufacturing and rigorous regulatory environments. However, the Asia-Pacific region is poised for substantial expansion, propelled by rapid industrialization and infrastructure development. The competitive landscape features established global players alongside specialized NDT manufacturers, indicating a dynamic and innovation-driven market. Continuous technological advancements and widening applications across diverse global industries underpin a positive future outlook for the Industrial Radiography Equipment market.
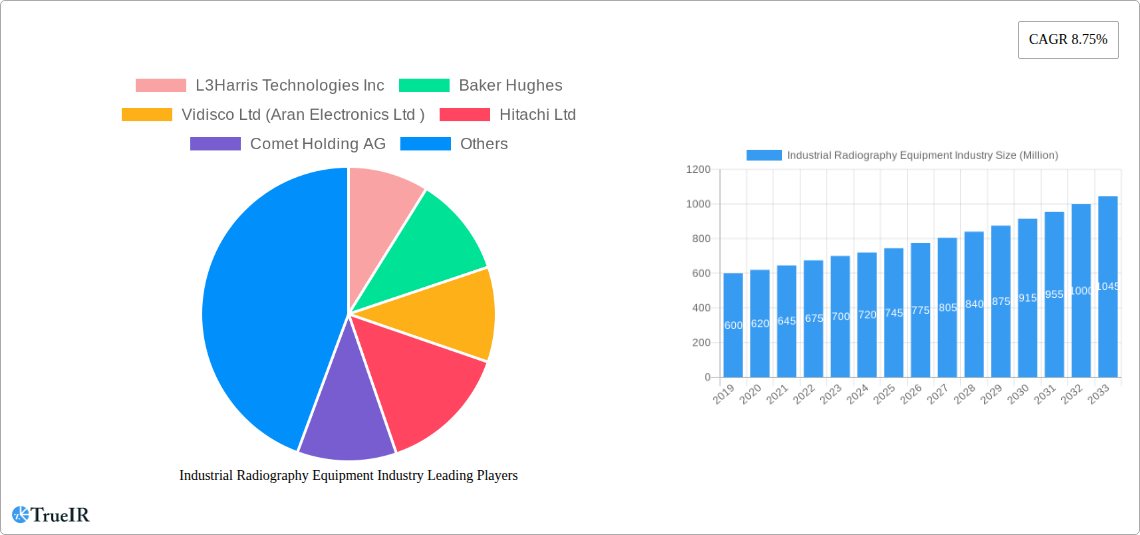
Industrial Radiography Equipment Industry Company Market Share
Industrial Radiography Equipment Market Report: 2019-2033 Forecast
This comprehensive report provides a detailed analysis of the Industrial Radiography Equipment market, offering invaluable insights for businesses, investors, and stakeholders seeking to navigate this dynamic sector. The report covers the period from 2019 to 2033, with a focus on the estimated year 2025 and a forecast extending to 2033. The market is segmented by offering (Equipment, Software), technology (Film Radiography, Computed Radiography, Direct Radiography, Computed Tomography), and end-user industry (Aerospace, Food, Construction, Oil & Gas, Automotive, Energy, Semiconductor, Others). Key players such as Bosello High Technology SRL, Canon Inc, Nikon Corporation, and others are profiled, providing a competitive landscape analysis and market share estimations. The report projects a market valued at XX Million by 2033, showcasing significant growth opportunities within this crucial industry.
Industrial Radiography Equipment Industry Market Structure & Competitive Landscape
The Industrial Radiography Equipment market presents a moderately concentrated competitive landscape, characterized by several key players commanding significant market shares. The Herfindahl-Hirschman Index (HHI) for 2025 is estimated at [Insert Updated HHI Value], indicating a moderately consolidated market. Continuous innovation is a pivotal driver, with ongoing advancements in digital radiography, computed tomography (CT) scanning, and sophisticated AI-powered software solutions propelling market expansion. Strict adherence to regulatory compliance, particularly concerning safety protocols and radiation protection, exerts a substantial influence on market dynamics and strategic decision-making by industry participants. The presence of substitute technologies, such as ultrasonic testing and magnetic particle inspection, introduces competitive pressures and necessitates continuous improvement and differentiation within the radiography equipment sector. Market segmentation is diverse, encompassing a wide range of end-user industries, with the automotive, aerospace, and energy sectors representing the most substantial market segments. The period from 2019 to 2024 witnessed considerable consolidation through mergers and acquisitions (M&A) activities, with an estimated total value of [Insert Updated M&A Value] Million. This M&A activity reflects ongoing industry consolidation and a strategic focus on expanding market reach and enhancing technological capabilities.
- Market Concentration: HHI of [Insert Updated HHI Value] in 2025.
- Innovation Drivers: Advanced digital radiography, cutting-edge CT advancements, and AI-driven software solutions.
- Regulatory Impacts: Stringent safety and radiation regulations significantly influence market growth and strategic planning.
- Product Substitutes: Ultrasonic testing and magnetic particle inspection methods present notable competitive challenges.
- End-User Segmentation: Automotive, aerospace, and energy sectors constitute the largest market segments.
- M&A Trends: [Insert Updated M&A Value] Million in M&A activity observed from 2019 to 2024.
Industrial Radiography Equipment Industry Market Trends & Opportunities
The global Industrial Radiography Equipment market is demonstrating robust growth, fueled by escalating demand across various end-user industries. Market projections indicate a value of [Insert Updated Market Size] Million by 2033, reflecting a Compound Annual Growth Rate (CAGR) of [Insert Updated CAGR]% during the forecast period (2025-2033). This growth trajectory is propelled by several key trends. Significant technological advancements, particularly within digital radiography and computed tomography (CT), deliver superior image quality, faster processing speeds, and increased efficiency. These improvements translate to cost savings and enhanced productivity for end-users. A growing preference for non-destructive testing (NDT) methods that prioritize precision, reliability, and environmental consciousness is driving demand for advanced radiography equipment. The competitive landscape fosters innovation and price competitiveness through the participation of both established industry leaders and emerging companies. Market penetration rates for advanced radiography solutions are steadily increasing, particularly in developing economies experiencing rapid infrastructure expansion.
Dominant Markets & Segments in Industrial Radiography Equipment Industry
North America currently holds the largest market share in the industrial radiography equipment industry, followed by Europe and the Asia-Pacific region. Within these regions, key countries such as the United States, Germany, and China are significant drivers of market growth. The dominant segments, categorized by offering and end-user industry, exhibit variations.
- Offering: The equipment segment commands the largest market share, followed by software solutions.
- Technology: Computed radiography and direct radiography are leading technologies in terms of market share and growth rate.
- End-User Industry: The Aerospace and Automotive industries represent the largest market segments globally.
Key Growth Drivers:
- Aerospace: Stringent quality control and safety standards in aircraft manufacturing are driving demand.
- Automotive: The increasing demand for lightweight, high-strength materials necessitates robust inspection processes.
- Oil & Gas: The imperative for pipeline integrity and safety inspections fuels market growth.
- Energy & Power: Growing demand for quality control in power generation components.
- Infrastructure Development: Expanding construction activity necessitates quality control of building materials.
Industrial Radiography Equipment Industry Product Analysis
The market offers a range of products, from traditional film radiography systems to advanced computed tomography (CT) scanners. Computed radiography (CR) and direct radiography (DR) systems are gaining popularity due to their enhanced image quality, faster processing speeds, and reduced operational costs compared to film-based methods. The latest advancements include AI-powered image analysis software that offers automated defect detection and improved accuracy. These technological advancements translate into improved efficiency, reduced downtime, and better decision-making for end-users, creating a strong market fit.
Key Drivers, Barriers & Challenges in Industrial Radiography Equipment Industry
Key Drivers:
- Rising demand for NDT: Stringent quality control and safety regulations across various industries.
- Technological advancements: Enhanced image quality, faster processing times, and reduced costs.
- Infrastructure development: Growing investment in infrastructure projects globally.
Challenges and Restraints:
- High initial investment costs: Advanced systems require significant capital investment.
- Regulatory compliance: Meeting stringent safety and environmental regulations can be complex.
- Skilled workforce shortage: A lack of trained personnel can limit market expansion. This shortage is estimated to impact the market by xx Million annually.
Growth Drivers in the Industrial Radiography Equipment Industry Market
Several factors are significantly contributing to the growth of this market. Technological innovations resulting in enhanced image quality, speed, and efficiency are paramount. The rising demand for NDT methods across various sectors, notably aerospace and automotive, fuels market expansion. Supportive government policies and initiatives promoting industrial safety and quality control further accelerate market growth.
Challenges Impacting Industrial Radiography Equipment Industry Growth
High capital investment requirements for advanced equipment, stringent regulatory compliance needs, and a shortage of skilled personnel are major obstacles hindering market growth. Competition from alternative NDT methods and potential supply chain disruptions due to geopolitical factors pose additional challenges.
Key Players Shaping the Industrial Radiography Equipment Industry Market
- Bosello High Technology SRL
- Canon Inc
- Nikon Corporation
- L3Harris Security & Detection Systems
- Vidisco Ltd
- Dürr NDT Gmbh & Co KG
- Teledyne Dalsa Inc
- North Star Imaging Inc
- YXLON International
- Hamamatsu Photonics K K
- Carestream Health Inc
- Hitachi Ltd
- General Electric Company
- Olympus Corporation
- Rigaku Corporation
Significant Industrial Radiography Equipment Industry Industry Milestones
- 2020: Several key players launched new digital radiography systems with improved AI capabilities.
- 2021: Increased regulatory scrutiny on radiation safety led to several industry-wide safety upgrades.
- 2022: A major merger between two industry players reshaped the competitive landscape.
- 2023: Significant advancements in CT technology improved speed and image quality.
- 2024: Several new software solutions were introduced, improving image analysis and reporting.
Future Outlook for Industrial Radiography Equipment Industry Market
The Industrial Radiography Equipment market is poised for continued expansion, driven by technological innovation, increasing demand from various industries, and supportive regulatory frameworks. Strategic investments in R&D, expansion into emerging markets, and partnerships are expected to further enhance market growth. The market anticipates strong growth through 2033, driven by technological advancements and growing application across diverse end-user sectors.
Industrial Radiography Equipment Industry Segmentation
-
1. Offering
- 1.1. Equipment
- 1.2. Software
-
2. Technology
- 2.1. Film Radiography
- 2.2. Computed Radiography
- 2.3. Direct Radiography
- 2.4. Computed Tomography
-
3. End-user Industry
- 3.1. Aerospace
- 3.2. Food Industry
- 3.3. Construction
- 3.4. Oil and Gas
- 3.5. Automotive and Manufacturing
- 3.6. Energy and Power
- 3.7. Semiconductor and Electronics
- 3.8. Other End-user Industries
Industrial Radiography Equipment Industry Segmentation By Geography
- 1. North America
- 2. Europe
- 3. Asia Pacific
- 4. Latin America
- 5. Middle East and Africa
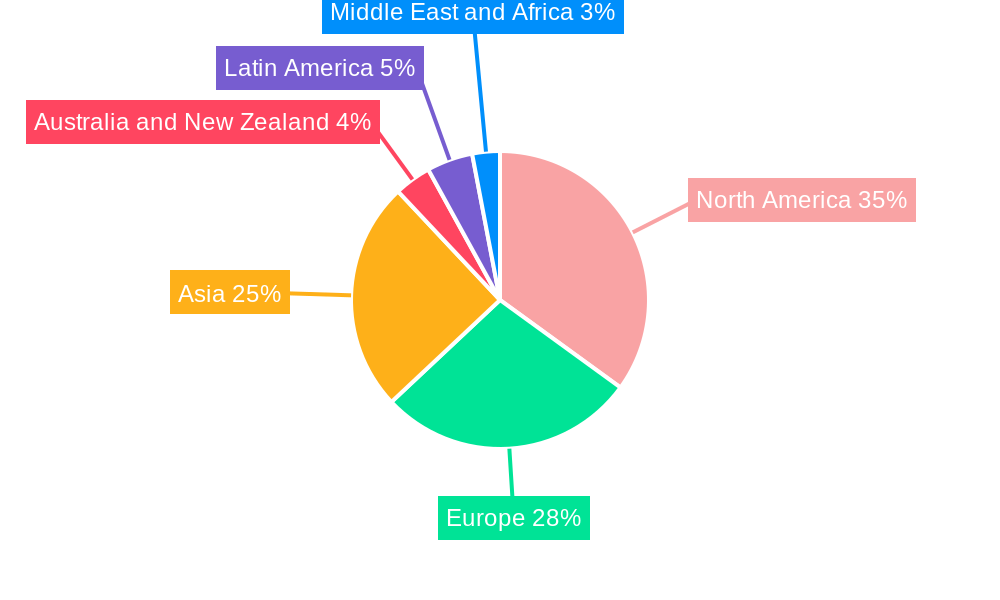
Industrial Radiography Equipment Industry Regional Market Share
Geographic Coverage of Industrial Radiography Equipment Industry
Industrial Radiography Equipment Industry REPORT HIGHLIGHTS
| Aspects | Details |
|---|---|
| Study Period | 2020-2034 |
| Base Year | 2025 |
| Estimated Year | 2026 |
| Forecast Period | 2026-2034 |
| Historical Period | 2020-2025 |
| Growth Rate | CAGR of 8.6% from 2020-2034 |
| Segmentation |
|
Table of Contents
- 1. Introduction
- 1.1. Research Scope
- 1.2. Market Segmentation
- 1.3. Research Objective
- 1.4. Definitions and Assumptions
- 2. Executive Summary
- 2.1. Market Snapshot
- 3. Market Dynamics
- 3.1. Market Drivers
- 3.2. Market Restrains
- 3.3. Market Trends
- 3.4. Market Opportunities
- 4. Market Factor Analysis
- 4.1. Porters Five Forces
- 4.1.1. Bargaining Power of Suppliers
- 4.1.2. Bargaining Power of Buyers
- 4.1.3. Threat of New Entrants
- 4.1.4. Threat of Substitutes
- 4.1.5. Competitive Rivalry
- 4.2. PESTEL analysis
- 4.3. BCG Analysis
- 4.3.1. Stars (High Growth, High Market Share)
- 4.3.2. Cash Cows (Low Growth, High Market Share)
- 4.3.3. Question Mark (High Growth, Low Market Share)
- 4.3.4. Dogs (Low Growth, Low Market Share)
- 4.4. Ansoff Matrix Analysis
- 4.5. Supply Chain Analysis
- 4.6. Regulatory Landscape
- 4.7. Current Market Potential and Opportunity Assessment (TAM–SAM–SOM Framework)
- 4.8. TIR Analyst Note
- 4.1. Porters Five Forces
- 5. Market Analysis, Insights and Forecast 2021-2033
- 5.1. Market Analysis, Insights and Forecast - by Offering
- 5.1.1. Equipment
- 5.1.2. Software
- 5.2. Market Analysis, Insights and Forecast - by Technology
- 5.2.1. Film Radiography
- 5.2.2. Computed Radiography
- 5.2.3. Direct Radiography
- 5.2.4. Computed Tomography
- 5.3. Market Analysis, Insights and Forecast - by End-user Industry
- 5.3.1. Aerospace
- 5.3.2. Food Industry
- 5.3.3. Construction
- 5.3.4. Oil and Gas
- 5.3.5. Automotive and Manufacturing
- 5.3.6. Energy and Power
- 5.3.7. Semiconductor and Electronics
- 5.3.8. Other End-user Industries
- 5.4. Market Analysis, Insights and Forecast - by Region
- 5.4.1. North America
- 5.4.2. Europe
- 5.4.3. Asia Pacific
- 5.4.4. Latin America
- 5.4.5. Middle East and Africa
- 5.1. Market Analysis, Insights and Forecast - by Offering
- 6. Global Industrial Radiography Equipment Industry Analysis, Insights and Forecast, 2021-2033
- 6.1. Market Analysis, Insights and Forecast - by Offering
- 6.1.1. Equipment
- 6.1.2. Software
- 6.2. Market Analysis, Insights and Forecast - by Technology
- 6.2.1. Film Radiography
- 6.2.2. Computed Radiography
- 6.2.3. Direct Radiography
- 6.2.4. Computed Tomography
- 6.3. Market Analysis, Insights and Forecast - by End-user Industry
- 6.3.1. Aerospace
- 6.3.2. Food Industry
- 6.3.3. Construction
- 6.3.4. Oil and Gas
- 6.3.5. Automotive and Manufacturing
- 6.3.6. Energy and Power
- 6.3.7. Semiconductor and Electronics
- 6.3.8. Other End-user Industries
- 6.1. Market Analysis, Insights and Forecast - by Offering
- 7. North America Industrial Radiography Equipment Industry Analysis, Insights and Forecast, 2020-2032
- 7.1. Market Analysis, Insights and Forecast - by Offering
- 7.1.1. Equipment
- 7.1.2. Software
- 7.2. Market Analysis, Insights and Forecast - by Technology
- 7.2.1. Film Radiography
- 7.2.2. Computed Radiography
- 7.2.3. Direct Radiography
- 7.2.4. Computed Tomography
- 7.3. Market Analysis, Insights and Forecast - by End-user Industry
- 7.3.1. Aerospace
- 7.3.2. Food Industry
- 7.3.3. Construction
- 7.3.4. Oil and Gas
- 7.3.5. Automotive and Manufacturing
- 7.3.6. Energy and Power
- 7.3.7. Semiconductor and Electronics
- 7.3.8. Other End-user Industries
- 7.1. Market Analysis, Insights and Forecast - by Offering
- 8. Europe Industrial Radiography Equipment Industry Analysis, Insights and Forecast, 2020-2032
- 8.1. Market Analysis, Insights and Forecast - by Offering
- 8.1.1. Equipment
- 8.1.2. Software
- 8.2. Market Analysis, Insights and Forecast - by Technology
- 8.2.1. Film Radiography
- 8.2.2. Computed Radiography
- 8.2.3. Direct Radiography
- 8.2.4. Computed Tomography
- 8.3. Market Analysis, Insights and Forecast - by End-user Industry
- 8.3.1. Aerospace
- 8.3.2. Food Industry
- 8.3.3. Construction
- 8.3.4. Oil and Gas
- 8.3.5. Automotive and Manufacturing
- 8.3.6. Energy and Power
- 8.3.7. Semiconductor and Electronics
- 8.3.8. Other End-user Industries
- 8.1. Market Analysis, Insights and Forecast - by Offering
- 9. Asia Pacific Industrial Radiography Equipment Industry Analysis, Insights and Forecast, 2020-2032
- 9.1. Market Analysis, Insights and Forecast - by Offering
- 9.1.1. Equipment
- 9.1.2. Software
- 9.2. Market Analysis, Insights and Forecast - by Technology
- 9.2.1. Film Radiography
- 9.2.2. Computed Radiography
- 9.2.3. Direct Radiography
- 9.2.4. Computed Tomography
- 9.3. Market Analysis, Insights and Forecast - by End-user Industry
- 9.3.1. Aerospace
- 9.3.2. Food Industry
- 9.3.3. Construction
- 9.3.4. Oil and Gas
- 9.3.5. Automotive and Manufacturing
- 9.3.6. Energy and Power
- 9.3.7. Semiconductor and Electronics
- 9.3.8. Other End-user Industries
- 9.1. Market Analysis, Insights and Forecast - by Offering
- 10. Latin America Industrial Radiography Equipment Industry Analysis, Insights and Forecast, 2020-2032
- 10.1. Market Analysis, Insights and Forecast - by Offering
- 10.1.1. Equipment
- 10.1.2. Software
- 10.2. Market Analysis, Insights and Forecast - by Technology
- 10.2.1. Film Radiography
- 10.2.2. Computed Radiography
- 10.2.3. Direct Radiography
- 10.2.4. Computed Tomography
- 10.3. Market Analysis, Insights and Forecast - by End-user Industry
- 10.3.1. Aerospace
- 10.3.2. Food Industry
- 10.3.3. Construction
- 10.3.4. Oil and Gas
- 10.3.5. Automotive and Manufacturing
- 10.3.6. Energy and Power
- 10.3.7. Semiconductor and Electronics
- 10.3.8. Other End-user Industries
- 10.1. Market Analysis, Insights and Forecast - by Offering
- 11. Middle East and Africa Industrial Radiography Equipment Industry Analysis, Insights and Forecast, 2020-2032
- 11.1. Market Analysis, Insights and Forecast - by Offering
- 11.1.1. Equipment
- 11.1.2. Software
- 11.2. Market Analysis, Insights and Forecast - by Technology
- 11.2.1. Film Radiography
- 11.2.2. Computed Radiography
- 11.2.3. Direct Radiography
- 11.2.4. Computed Tomography
- 11.3. Market Analysis, Insights and Forecast - by End-user Industry
- 11.3.1. Aerospace
- 11.3.2. Food Industry
- 11.3.3. Construction
- 11.3.4. Oil and Gas
- 11.3.5. Automotive and Manufacturing
- 11.3.6. Energy and Power
- 11.3.7. Semiconductor and Electronics
- 11.3.8. Other End-user Industries
- 11.1. Market Analysis, Insights and Forecast - by Offering
- 12. Competitive Analysis
- 12.1. Company Profiles
- 12.1.1 Bosello High Technology SRL
- 12.1.1.1. Company Overview
- 12.1.1.2. Products
- 12.1.1.3. Company Financials
- 12.1.1.4. SWOT Analysis
- 12.1.2 Canon Inc
- 12.1.2.1. Company Overview
- 12.1.2.2. Products
- 12.1.2.3. Company Financials
- 12.1.2.4. SWOT Analysis
- 12.1.3 Nikon Corporation
- 12.1.3.1. Company Overview
- 12.1.3.2. Products
- 12.1.3.3. Company Financials
- 12.1.3.4. SWOT Analysis
- 12.1.4 L3Harris Security & Detection Systems
- 12.1.4.1. Company Overview
- 12.1.4.2. Products
- 12.1.4.3. Company Financials
- 12.1.4.4. SWOT Analysis
- 12.1.5 Vidisco Ltd
- 12.1.5.1. Company Overview
- 12.1.5.2. Products
- 12.1.5.3. Company Financials
- 12.1.5.4. SWOT Analysis
- 12.1.6 Dürr NDT Gmbh & Co KG
- 12.1.6.1. Company Overview
- 12.1.6.2. Products
- 12.1.6.3. Company Financials
- 12.1.6.4. SWOT Analysis
- 12.1.7 Teledyne Dalsa Inc
- 12.1.7.1. Company Overview
- 12.1.7.2. Products
- 12.1.7.3. Company Financials
- 12.1.7.4. SWOT Analysis
- 12.1.8 North Star Imaging Inc
- 12.1.8.1. Company Overview
- 12.1.8.2. Products
- 12.1.8.3. Company Financials
- 12.1.8.4. SWOT Analysis
- 12.1.9 YXLON International
- 12.1.9.1. Company Overview
- 12.1.9.2. Products
- 12.1.9.3. Company Financials
- 12.1.9.4. SWOT Analysis
- 12.1.10 Hamamatsu Photonics K K
- 12.1.10.1. Company Overview
- 12.1.10.2. Products
- 12.1.10.3. Company Financials
- 12.1.10.4. SWOT Analysis
- 12.1.11 Carestream Health Inc
- 12.1.11.1. Company Overview
- 12.1.11.2. Products
- 12.1.11.3. Company Financials
- 12.1.11.4. SWOT Analysis
- 12.1.12 Hitachi Ltd
- 12.1.12.1. Company Overview
- 12.1.12.2. Products
- 12.1.12.3. Company Financials
- 12.1.12.4. SWOT Analysis
- 12.1.13 General Electric Company
- 12.1.13.1. Company Overview
- 12.1.13.2. Products
- 12.1.13.3. Company Financials
- 12.1.13.4. SWOT Analysis
- 12.1.14 Olympus Corporation
- 12.1.14.1. Company Overview
- 12.1.14.2. Products
- 12.1.14.3. Company Financials
- 12.1.14.4. SWOT Analysis
- 12.1.15 Rigaku Corporation
- 12.1.15.1. Company Overview
- 12.1.15.2. Products
- 12.1.15.3. Company Financials
- 12.1.15.4. SWOT Analysis
- 12.1.1 Bosello High Technology SRL
- 12.2. Market Entropy
- 12.2.1 Company's Key Areas Served
- 12.2.2 Recent Developments
- 12.3. Company Market Share Analysis 2025
- 12.3.1 Top 5 Companies Market Share Analysis
- 12.3.2 Top 3 Companies Market Share Analysis
- 12.4. List of Potential Customers
- 13. Research Methodology
List of Figures
- Figure 1: Global Industrial Radiography Equipment Industry Revenue Breakdown (billion, %) by Region 2025 & 2033
- Figure 2: Global Industrial Radiography Equipment Industry Volume Breakdown (K Unit, %) by Region 2025 & 2033
- Figure 3: North America Industrial Radiography Equipment Industry Revenue (billion), by Offering 2025 & 2033
- Figure 4: North America Industrial Radiography Equipment Industry Volume (K Unit), by Offering 2025 & 2033
- Figure 5: North America Industrial Radiography Equipment Industry Revenue Share (%), by Offering 2025 & 2033
- Figure 6: North America Industrial Radiography Equipment Industry Volume Share (%), by Offering 2025 & 2033
- Figure 7: North America Industrial Radiography Equipment Industry Revenue (billion), by Technology 2025 & 2033
- Figure 8: North America Industrial Radiography Equipment Industry Volume (K Unit), by Technology 2025 & 2033
- Figure 9: North America Industrial Radiography Equipment Industry Revenue Share (%), by Technology 2025 & 2033
- Figure 10: North America Industrial Radiography Equipment Industry Volume Share (%), by Technology 2025 & 2033
- Figure 11: North America Industrial Radiography Equipment Industry Revenue (billion), by End-user Industry 2025 & 2033
- Figure 12: North America Industrial Radiography Equipment Industry Volume (K Unit), by End-user Industry 2025 & 2033
- Figure 13: North America Industrial Radiography Equipment Industry Revenue Share (%), by End-user Industry 2025 & 2033
- Figure 14: North America Industrial Radiography Equipment Industry Volume Share (%), by End-user Industry 2025 & 2033
- Figure 15: North America Industrial Radiography Equipment Industry Revenue (billion), by Country 2025 & 2033
- Figure 16: North America Industrial Radiography Equipment Industry Volume (K Unit), by Country 2025 & 2033
- Figure 17: North America Industrial Radiography Equipment Industry Revenue Share (%), by Country 2025 & 2033
- Figure 18: North America Industrial Radiography Equipment Industry Volume Share (%), by Country 2025 & 2033
- Figure 19: Europe Industrial Radiography Equipment Industry Revenue (billion), by Offering 2025 & 2033
- Figure 20: Europe Industrial Radiography Equipment Industry Volume (K Unit), by Offering 2025 & 2033
- Figure 21: Europe Industrial Radiography Equipment Industry Revenue Share (%), by Offering 2025 & 2033
- Figure 22: Europe Industrial Radiography Equipment Industry Volume Share (%), by Offering 2025 & 2033
- Figure 23: Europe Industrial Radiography Equipment Industry Revenue (billion), by Technology 2025 & 2033
- Figure 24: Europe Industrial Radiography Equipment Industry Volume (K Unit), by Technology 2025 & 2033
- Figure 25: Europe Industrial Radiography Equipment Industry Revenue Share (%), by Technology 2025 & 2033
- Figure 26: Europe Industrial Radiography Equipment Industry Volume Share (%), by Technology 2025 & 2033
- Figure 27: Europe Industrial Radiography Equipment Industry Revenue (billion), by End-user Industry 2025 & 2033
- Figure 28: Europe Industrial Radiography Equipment Industry Volume (K Unit), by End-user Industry 2025 & 2033
- Figure 29: Europe Industrial Radiography Equipment Industry Revenue Share (%), by End-user Industry 2025 & 2033
- Figure 30: Europe Industrial Radiography Equipment Industry Volume Share (%), by End-user Industry 2025 & 2033
- Figure 31: Europe Industrial Radiography Equipment Industry Revenue (billion), by Country 2025 & 2033
- Figure 32: Europe Industrial Radiography Equipment Industry Volume (K Unit), by Country 2025 & 2033
- Figure 33: Europe Industrial Radiography Equipment Industry Revenue Share (%), by Country 2025 & 2033
- Figure 34: Europe Industrial Radiography Equipment Industry Volume Share (%), by Country 2025 & 2033
- Figure 35: Asia Pacific Industrial Radiography Equipment Industry Revenue (billion), by Offering 2025 & 2033
- Figure 36: Asia Pacific Industrial Radiography Equipment Industry Volume (K Unit), by Offering 2025 & 2033
- Figure 37: Asia Pacific Industrial Radiography Equipment Industry Revenue Share (%), by Offering 2025 & 2033
- Figure 38: Asia Pacific Industrial Radiography Equipment Industry Volume Share (%), by Offering 2025 & 2033
- Figure 39: Asia Pacific Industrial Radiography Equipment Industry Revenue (billion), by Technology 2025 & 2033
- Figure 40: Asia Pacific Industrial Radiography Equipment Industry Volume (K Unit), by Technology 2025 & 2033
- Figure 41: Asia Pacific Industrial Radiography Equipment Industry Revenue Share (%), by Technology 2025 & 2033
- Figure 42: Asia Pacific Industrial Radiography Equipment Industry Volume Share (%), by Technology 2025 & 2033
- Figure 43: Asia Pacific Industrial Radiography Equipment Industry Revenue (billion), by End-user Industry 2025 & 2033
- Figure 44: Asia Pacific Industrial Radiography Equipment Industry Volume (K Unit), by End-user Industry 2025 & 2033
- Figure 45: Asia Pacific Industrial Radiography Equipment Industry Revenue Share (%), by End-user Industry 2025 & 2033
- Figure 46: Asia Pacific Industrial Radiography Equipment Industry Volume Share (%), by End-user Industry 2025 & 2033
- Figure 47: Asia Pacific Industrial Radiography Equipment Industry Revenue (billion), by Country 2025 & 2033
- Figure 48: Asia Pacific Industrial Radiography Equipment Industry Volume (K Unit), by Country 2025 & 2033
- Figure 49: Asia Pacific Industrial Radiography Equipment Industry Revenue Share (%), by Country 2025 & 2033
- Figure 50: Asia Pacific Industrial Radiography Equipment Industry Volume Share (%), by Country 2025 & 2033
- Figure 51: Latin America Industrial Radiography Equipment Industry Revenue (billion), by Offering 2025 & 2033
- Figure 52: Latin America Industrial Radiography Equipment Industry Volume (K Unit), by Offering 2025 & 2033
- Figure 53: Latin America Industrial Radiography Equipment Industry Revenue Share (%), by Offering 2025 & 2033
- Figure 54: Latin America Industrial Radiography Equipment Industry Volume Share (%), by Offering 2025 & 2033
- Figure 55: Latin America Industrial Radiography Equipment Industry Revenue (billion), by Technology 2025 & 2033
- Figure 56: Latin America Industrial Radiography Equipment Industry Volume (K Unit), by Technology 2025 & 2033
- Figure 57: Latin America Industrial Radiography Equipment Industry Revenue Share (%), by Technology 2025 & 2033
- Figure 58: Latin America Industrial Radiography Equipment Industry Volume Share (%), by Technology 2025 & 2033
- Figure 59: Latin America Industrial Radiography Equipment Industry Revenue (billion), by End-user Industry 2025 & 2033
- Figure 60: Latin America Industrial Radiography Equipment Industry Volume (K Unit), by End-user Industry 2025 & 2033
- Figure 61: Latin America Industrial Radiography Equipment Industry Revenue Share (%), by End-user Industry 2025 & 2033
- Figure 62: Latin America Industrial Radiography Equipment Industry Volume Share (%), by End-user Industry 2025 & 2033
- Figure 63: Latin America Industrial Radiography Equipment Industry Revenue (billion), by Country 2025 & 2033
- Figure 64: Latin America Industrial Radiography Equipment Industry Volume (K Unit), by Country 2025 & 2033
- Figure 65: Latin America Industrial Radiography Equipment Industry Revenue Share (%), by Country 2025 & 2033
- Figure 66: Latin America Industrial Radiography Equipment Industry Volume Share (%), by Country 2025 & 2033
- Figure 67: Middle East and Africa Industrial Radiography Equipment Industry Revenue (billion), by Offering 2025 & 2033
- Figure 68: Middle East and Africa Industrial Radiography Equipment Industry Volume (K Unit), by Offering 2025 & 2033
- Figure 69: Middle East and Africa Industrial Radiography Equipment Industry Revenue Share (%), by Offering 2025 & 2033
- Figure 70: Middle East and Africa Industrial Radiography Equipment Industry Volume Share (%), by Offering 2025 & 2033
- Figure 71: Middle East and Africa Industrial Radiography Equipment Industry Revenue (billion), by Technology 2025 & 2033
- Figure 72: Middle East and Africa Industrial Radiography Equipment Industry Volume (K Unit), by Technology 2025 & 2033
- Figure 73: Middle East and Africa Industrial Radiography Equipment Industry Revenue Share (%), by Technology 2025 & 2033
- Figure 74: Middle East and Africa Industrial Radiography Equipment Industry Volume Share (%), by Technology 2025 & 2033
- Figure 75: Middle East and Africa Industrial Radiography Equipment Industry Revenue (billion), by End-user Industry 2025 & 2033
- Figure 76: Middle East and Africa Industrial Radiography Equipment Industry Volume (K Unit), by End-user Industry 2025 & 2033
- Figure 77: Middle East and Africa Industrial Radiography Equipment Industry Revenue Share (%), by End-user Industry 2025 & 2033
- Figure 78: Middle East and Africa Industrial Radiography Equipment Industry Volume Share (%), by End-user Industry 2025 & 2033
- Figure 79: Middle East and Africa Industrial Radiography Equipment Industry Revenue (billion), by Country 2025 & 2033
- Figure 80: Middle East and Africa Industrial Radiography Equipment Industry Volume (K Unit), by Country 2025 & 2033
- Figure 81: Middle East and Africa Industrial Radiography Equipment Industry Revenue Share (%), by Country 2025 & 2033
- Figure 82: Middle East and Africa Industrial Radiography Equipment Industry Volume Share (%), by Country 2025 & 2033
List of Tables
- Table 1: Global Industrial Radiography Equipment Industry Revenue billion Forecast, by Offering 2020 & 2033
- Table 2: Global Industrial Radiography Equipment Industry Volume K Unit Forecast, by Offering 2020 & 2033
- Table 3: Global Industrial Radiography Equipment Industry Revenue billion Forecast, by Technology 2020 & 2033
- Table 4: Global Industrial Radiography Equipment Industry Volume K Unit Forecast, by Technology 2020 & 2033
- Table 5: Global Industrial Radiography Equipment Industry Revenue billion Forecast, by End-user Industry 2020 & 2033
- Table 6: Global Industrial Radiography Equipment Industry Volume K Unit Forecast, by End-user Industry 2020 & 2033
- Table 7: Global Industrial Radiography Equipment Industry Revenue billion Forecast, by Region 2020 & 2033
- Table 8: Global Industrial Radiography Equipment Industry Volume K Unit Forecast, by Region 2020 & 2033
- Table 9: Global Industrial Radiography Equipment Industry Revenue billion Forecast, by Offering 2020 & 2033
- Table 10: Global Industrial Radiography Equipment Industry Volume K Unit Forecast, by Offering 2020 & 2033
- Table 11: Global Industrial Radiography Equipment Industry Revenue billion Forecast, by Technology 2020 & 2033
- Table 12: Global Industrial Radiography Equipment Industry Volume K Unit Forecast, by Technology 2020 & 2033
- Table 13: Global Industrial Radiography Equipment Industry Revenue billion Forecast, by End-user Industry 2020 & 2033
- Table 14: Global Industrial Radiography Equipment Industry Volume K Unit Forecast, by End-user Industry 2020 & 2033
- Table 15: Global Industrial Radiography Equipment Industry Revenue billion Forecast, by Country 2020 & 2033
- Table 16: Global Industrial Radiography Equipment Industry Volume K Unit Forecast, by Country 2020 & 2033
- Table 17: Global Industrial Radiography Equipment Industry Revenue billion Forecast, by Offering 2020 & 2033
- Table 18: Global Industrial Radiography Equipment Industry Volume K Unit Forecast, by Offering 2020 & 2033
- Table 19: Global Industrial Radiography Equipment Industry Revenue billion Forecast, by Technology 2020 & 2033
- Table 20: Global Industrial Radiography Equipment Industry Volume K Unit Forecast, by Technology 2020 & 2033
- Table 21: Global Industrial Radiography Equipment Industry Revenue billion Forecast, by End-user Industry 2020 & 2033
- Table 22: Global Industrial Radiography Equipment Industry Volume K Unit Forecast, by End-user Industry 2020 & 2033
- Table 23: Global Industrial Radiography Equipment Industry Revenue billion Forecast, by Country 2020 & 2033
- Table 24: Global Industrial Radiography Equipment Industry Volume K Unit Forecast, by Country 2020 & 2033
- Table 25: Global Industrial Radiography Equipment Industry Revenue billion Forecast, by Offering 2020 & 2033
- Table 26: Global Industrial Radiography Equipment Industry Volume K Unit Forecast, by Offering 2020 & 2033
- Table 27: Global Industrial Radiography Equipment Industry Revenue billion Forecast, by Technology 2020 & 2033
- Table 28: Global Industrial Radiography Equipment Industry Volume K Unit Forecast, by Technology 2020 & 2033
- Table 29: Global Industrial Radiography Equipment Industry Revenue billion Forecast, by End-user Industry 2020 & 2033
- Table 30: Global Industrial Radiography Equipment Industry Volume K Unit Forecast, by End-user Industry 2020 & 2033
- Table 31: Global Industrial Radiography Equipment Industry Revenue billion Forecast, by Country 2020 & 2033
- Table 32: Global Industrial Radiography Equipment Industry Volume K Unit Forecast, by Country 2020 & 2033
- Table 33: Global Industrial Radiography Equipment Industry Revenue billion Forecast, by Offering 2020 & 2033
- Table 34: Global Industrial Radiography Equipment Industry Volume K Unit Forecast, by Offering 2020 & 2033
- Table 35: Global Industrial Radiography Equipment Industry Revenue billion Forecast, by Technology 2020 & 2033
- Table 36: Global Industrial Radiography Equipment Industry Volume K Unit Forecast, by Technology 2020 & 2033
- Table 37: Global Industrial Radiography Equipment Industry Revenue billion Forecast, by End-user Industry 2020 & 2033
- Table 38: Global Industrial Radiography Equipment Industry Volume K Unit Forecast, by End-user Industry 2020 & 2033
- Table 39: Global Industrial Radiography Equipment Industry Revenue billion Forecast, by Country 2020 & 2033
- Table 40: Global Industrial Radiography Equipment Industry Volume K Unit Forecast, by Country 2020 & 2033
- Table 41: Global Industrial Radiography Equipment Industry Revenue billion Forecast, by Offering 2020 & 2033
- Table 42: Global Industrial Radiography Equipment Industry Volume K Unit Forecast, by Offering 2020 & 2033
- Table 43: Global Industrial Radiography Equipment Industry Revenue billion Forecast, by Technology 2020 & 2033
- Table 44: Global Industrial Radiography Equipment Industry Volume K Unit Forecast, by Technology 2020 & 2033
- Table 45: Global Industrial Radiography Equipment Industry Revenue billion Forecast, by End-user Industry 2020 & 2033
- Table 46: Global Industrial Radiography Equipment Industry Volume K Unit Forecast, by End-user Industry 2020 & 2033
- Table 47: Global Industrial Radiography Equipment Industry Revenue billion Forecast, by Country 2020 & 2033
- Table 48: Global Industrial Radiography Equipment Industry Volume K Unit Forecast, by Country 2020 & 2033
Frequently Asked Questions
1. What is the projected Compound Annual Growth Rate (CAGR) of the Industrial Radiography Equipment Industry?
The projected CAGR is approximately 8.6%.
2. Which companies are prominent players in the Industrial Radiography Equipment Industry?
Key companies in the market include Bosello High Technology SRL, Canon Inc, Nikon Corporation, L3Harris Security & Detection Systems, Vidisco Ltd, Dürr NDT Gmbh & Co KG, Teledyne Dalsa Inc, North Star Imaging Inc, YXLON International, Hamamatsu Photonics K K, Carestream Health Inc, Hitachi Ltd, General Electric Company, Olympus Corporation, Rigaku Corporation.
3. What are the main segments of the Industrial Radiography Equipment Industry?
The market segments include Offering, Technology, End-user Industry.
4. Can you provide details about the market size?
The market size is estimated to be USD 1.35 billion as of 2022.
5. What are some drivers contributing to market growth?
; Growing Demand for Portable and Miniaturized Equipment; Recovering Demand from the Oil and Gas Industry.
6. What are the notable trends driving market growth?
Recovering Demand from Oil and Gas Industry will Drive the Market.
7. Are there any restraints impacting market growth?
Lack in Awareness.
8. Can you provide examples of recent developments in the market?
N/A
9. What pricing options are available for accessing the report?
Pricing options include single-user, multi-user, and enterprise licenses priced at USD 4750, USD 5250, and USD 8750 respectively.
10. Is the market size provided in terms of value or volume?
The market size is provided in terms of value, measured in billion and volume, measured in K Unit.
11. Are there any specific market keywords associated with the report?
Yes, the market keyword associated with the report is "Industrial Radiography Equipment Industry," which aids in identifying and referencing the specific market segment covered.
12. How do I determine which pricing option suits my needs best?
The pricing options vary based on user requirements and access needs. Individual users may opt for single-user licenses, while businesses requiring broader access may choose multi-user or enterprise licenses for cost-effective access to the report.
13. Are there any additional resources or data provided in the Industrial Radiography Equipment Industry report?
While the report offers comprehensive insights, it's advisable to review the specific contents or supplementary materials provided to ascertain if additional resources or data are available.
14. How can I stay updated on further developments or reports in the Industrial Radiography Equipment Industry?
To stay informed about further developments, trends, and reports in the Industrial Radiography Equipment Industry, consider subscribing to industry newsletters, following relevant companies and organizations, or regularly checking reputable industry news sources and publications.
Methodology
Step 1 - Identification of Relevant Samples Size from Population Database


Step 2 - Approaches for Defining Global Market Size (Value, Volume* & Price*)

Note*: In applicable scenarios
Step 3 - Data Sources
Primary Research
- Web Analytics
- Survey Reports
- Research Institute
- Latest Research Reports
- Opinion Leaders
Secondary Research
- Annual Reports
- White Paper
- Latest Press Release
- Industry Association
- Paid Database
- Investor Presentations

Step 4 - Data Triangulation
Involves using different sources of information in order to increase the validity of a study
These sources are likely to be stakeholders in a program - participants, other researchers, program staff, other community members, and so on.
Then we put all data in single framework & apply various statistical tools to find out the dynamic on the market.
During the analysis stage, feedback from the stakeholder groups would be compared to determine areas of agreement as well as areas of divergence