

Key Insights
The Kingdom of Saudi Arabia (KSA) satellite imagery services market is experiencing robust growth, driven by significant investments in infrastructure development, national security initiatives, and the burgeoning agricultural and resource management sectors. A Compound Annual Growth Rate (CAGR) of 12.01% from 2019 to 2024 suggests a market poised for continued expansion. The increasing adoption of advanced technologies like high-resolution imagery and AI-powered analytics is further fueling this growth. Key applications include geospatial data acquisition and mapping for urban planning and infrastructure projects, natural resource management for efficient land utilization and environmental monitoring, and surveillance and security for border protection and crime prevention. The government sector remains a primary driver, with substantial investments in national digital transformation strategies leveraging satellite imagery for various governmental functions. However, data privacy concerns and regulatory hurdles related to data security and usage could pose challenges to market expansion. The market is segmented by application (geospatial data acquisition, natural resource management, surveillance, conservation, disaster management, intelligence) and end-user (government, construction, transportation, military, forestry, agriculture). Major players like Airbus, Thales, and Leonardo S.p.A. are actively participating, offering a diverse range of services and solutions. The continued expansion of Saudi Arabia’s economy and its strategic focus on technological advancement suggests a promising outlook for the KSA satellite imagery services market in the coming years, with significant opportunities for both domestic and international players.
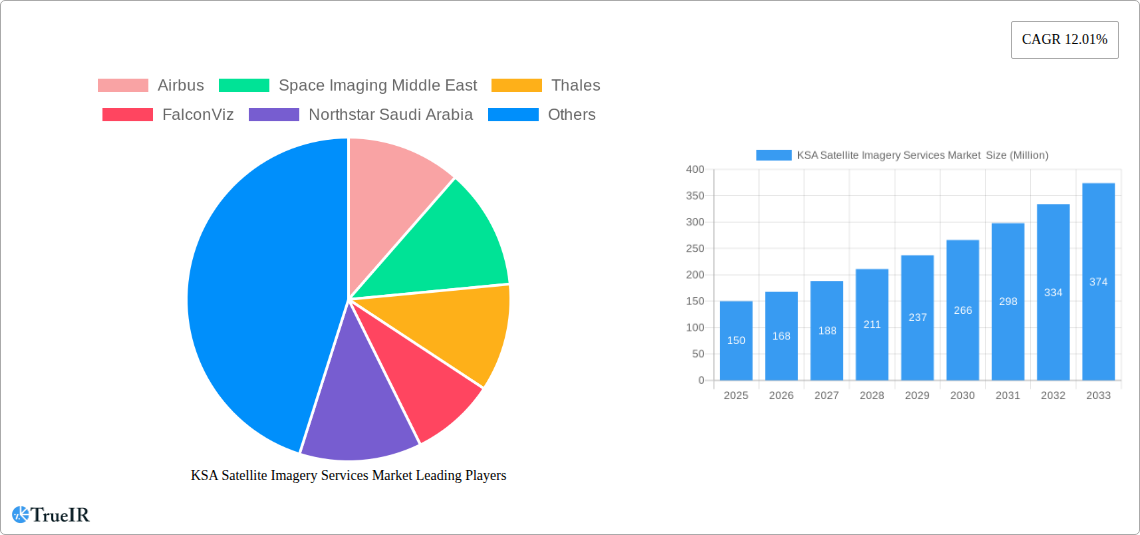
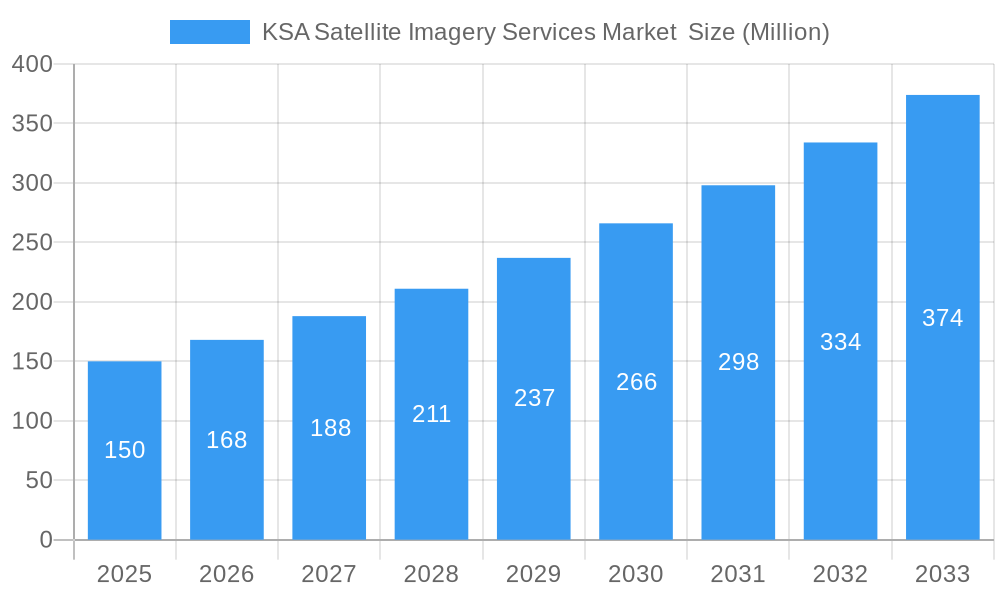
KSA Satellite Imagery Services Market Market Size (In Million)
The forecast period of 2025-2033 is expected to witness an acceleration in market growth, driven by increased government spending on infrastructure and digital transformation initiatives, along with advancements in satellite technology offering higher resolution and more frequent data capture. The private sector's growing reliance on satellite imagery for efficient operations across various sectors such as agriculture, construction, and transportation and logistics will further contribute to this growth. Furthermore, collaborative partnerships between government agencies and private sector companies are likely to emerge, fostering innovation and accelerating the adoption of advanced satellite imagery solutions. The market’s growth, however, will be influenced by factors such as the cost of satellite imagery acquisition and processing, the need for skilled professionals to analyze and interpret the data, and the need for robust data security infrastructure to manage sensitive information. Despite these potential challenges, the long-term prospects for the KSA satellite imagery services market remain positive, propelled by the nation's ambitious economic vision and the increasing demand for accurate and timely geospatial information.
KSA Satellite Imagery Services Market Company Market Share
KSA Satellite Imagery Services Market: A Comprehensive Report (2019-2033)
This dynamic report offers a detailed analysis of the burgeoning Kingdom of Saudi Arabia (KSA) satellite imagery services market, providing invaluable insights for investors, industry professionals, and strategic decision-makers. The study covers the period from 2019 to 2033, with a focus on the 2025-2033 forecast period. Leveraging extensive research and data analysis, this report unravels market trends, identifies key players, and predicts future growth trajectories, making it an essential resource for navigating this rapidly expanding sector. The market is projected to reach xx Million by 2033, demonstrating substantial growth potential.
KSA Satellite Imagery Services Market Market Structure & Competitive Landscape
The KSA satellite imagery services market exhibits a moderately concentrated structure, with a few major players holding significant market share. However, the market is characterized by dynamic competition, driven by technological advancements and increasing demand from diverse sectors. The concentration ratio (CR4) is estimated at approximately 40% in 2025, indicating the presence of both large established players and emerging niche competitors. Innovation is a key driver, with companies continually striving to improve image resolution, data analytics capabilities, and service delivery mechanisms. Regulatory frameworks, particularly those related to data security and privacy, significantly impact market operations. The market witnesses limited product substitution, as satellite imagery offers unique capabilities not easily replicated by alternative technologies.
The end-user segmentation is crucial, with the Government sector dominating the market, followed by Military and Defense, and Construction. Mergers and acquisitions (M&A) activity remains moderate, reflecting strategic moves by established players to expand their service portfolios and geographic reach. In the historical period (2019-2024), the M&A volume averaged approximately xx transactions per year, with larger deals focusing on technology integration and service expansion.
- Market Concentration: CR4 estimated at 40% in 2025.
- Innovation Drivers: Enhanced image resolution, advanced analytics, improved data delivery.
- Regulatory Impacts: Data security, privacy regulations influence market operations.
- Product Substitutes: Limited alternatives to satellite imagery's unique capabilities.
- End-User Segmentation: Government, Military & Defense, Construction are major segments.
- M&A Trends: Moderate activity with focus on technology integration and expansion.
KSA Satellite Imagery Services Market Market Trends & Opportunities
The KSA satellite imagery services market is experiencing robust growth, driven by increasing government spending on infrastructure projects, heightened security concerns, and a rising need for efficient natural resource management. The market size is projected to expand at a Compound Annual Growth Rate (CAGR) of xx% during the forecast period (2025-2033), reaching xx Million by 2033. This growth is fueled by technological advancements, including the development of high-resolution sensors, improved data processing techniques, and the rise of cloud-based platforms for data access and analysis.
Consumer preferences are shifting towards higher-resolution imagery, real-time data delivery, and customized analytics solutions. The market is also witnessing increased adoption of innovative business models, such as subscription-based services and pay-per-use options. Competitive dynamics are characterized by both collaboration and rivalry, with companies forming strategic partnerships to expand their offerings and compete aggressively for market share. The market penetration rate, currently estimated at xx%, is expected to increase significantly during the forecast period, driven by broader industry adoption and government initiatives promoting the use of geospatial data.
Dominant Markets & Segments in KSA Satellite Imagery Services Market
The Government sector is the dominant end-user segment in the KSA satellite imagery services market, driven by significant investments in national security, infrastructure development, and urban planning. The Geospatial Data Acquisition and Mapping application segment also holds a leading position, reflecting the increasing need for precise and up-to-date geographical information.
- Key Growth Drivers for Government Sector: National security initiatives, infrastructure development, smart city projects, environmental monitoring.
- Key Growth Drivers for Geospatial Data Acquisition and Mapping: Urban planning, infrastructure projects, land management, precise mapping needs.
- Key Growth Drivers for Natural Resource Management: Sustainable resource management, environmental monitoring, agricultural planning.
Other segments, including Military and Defense, Construction, and Transportation and Logistics, are also experiencing substantial growth, driven by specific sector-related needs and technological advancements. The market dominance of these segments stems from the high demand for precise location data, efficient resource allocation, and real-time monitoring capabilities. Further growth is expected to be driven by ongoing government investments in infrastructure projects (Vision 2030), the expanding construction sector, and the increasing focus on sustainable resource management.
KSA Satellite Imagery Services Market Product Analysis
The KSA satellite imagery services market offers a diverse range of products, encompassing high-resolution imagery, advanced analytics tools, and customized solutions tailored to specific customer needs. Technological advancements focus on improved image resolution, spectral capabilities, and advanced data processing algorithms, facilitating more detailed analysis and insights. Products are increasingly integrated with cloud-based platforms to enable easier access, faster processing, and enhanced data sharing capabilities. Competitive advantages stem from superior image quality, efficient data processing, cost-effective solutions, and the ability to provide customized analytical services tailored to specific industry needs.
Key Drivers, Barriers & Challenges in KSA Satellite Imagery Services Market
Key Drivers:
The market is propelled by increasing government investments in infrastructure projects, national security initiatives, and sustainable resource management programs. Technological advancements, such as improved satellite technology and advanced analytics capabilities, further fuel market growth. Supportive government policies, including data sharing initiatives and regulations promoting the use of geospatial information, also contribute significantly.
Challenges:
Key challenges include the high cost of satellite imagery acquisition and processing, potential data security and privacy concerns, and the need for skilled professionals to interpret and analyze complex datasets. Competitive pressures from both domestic and international players also impact market growth, along with potential supply chain disruptions related to satellite technology and data processing infrastructure. These challenges, if not addressed effectively, could potentially hinder the market's overall growth potential.
Growth Drivers in the KSA Satellite Imagery Services Market Market
Government initiatives such as Vision 2030, focusing on infrastructure development and diversification, significantly drive market growth. The expansion of the construction and transportation sectors creates robust demand for geospatial data. Technological advancements in high-resolution imagery, advanced analytics, and cloud-based solutions offer enhanced capabilities.
Challenges Impacting KSA Satellite Imagery Services Market Growth
High initial investment costs for satellite technology and data processing infrastructure pose a significant barrier. Data security and privacy concerns require robust regulatory frameworks and technological safeguards. Competition from both established players and emerging firms intensifies market dynamics. Lack of skilled professionals to analyze and interpret complex datasets may limit market potential.
Key Players Shaping the KSA Satellite Imagery Services Market Market
- Airbus
- Space Imaging Middle East
- Thales
- FalconViz
- Northstar Saudi Arabia
- Soar Earth Ltd
- Leonardo S.p.A
- Serco
- NOVAsat
Significant KSA Satellite Imagery Services Market Industry Milestones
- August 2023: Satellogic partnered with Quant Data & Analytics to provide high-resolution satellite imagery for the Saudi real estate and retail sectors. This highlights the growing demand for satellite data in the property technology landscape.
- April 2023: KAUST launched a CubeSat nanosatellite with Spire Global, improving Saudi Arabia's natural resource monitoring capabilities. This signifies increased investment in advanced Earth observation technologies and data analytics.
Future Outlook for KSA Satellite Imagery Services Market Market
The KSA satellite imagery services market is poised for continued strong growth, driven by sustained government investment, technological advancements, and the expanding needs of various sectors. Strategic opportunities exist in developing innovative applications for satellite data, enhancing data analytics capabilities, and establishing robust data security and privacy frameworks. The market's potential is substantial, with significant growth expected across various segments and applications.
KSA Satellite Imagery Services Market Segmentation
-
1. Application
- 1.1. Geospatial Data Acquisition and Mapping
- 1.2. Natural Resource Management
- 1.3. Surveillance and Security
- 1.4. Conservation and Research
- 1.5. Disaster Management
- 1.6. Intelligence
-
2. End-User
- 2.1. Government
- 2.2. Construction
- 2.3. Transportation and Logistics
- 2.4. Military and Defense
- 2.5. Forestry and Agriculture
- 2.6. Others
KSA Satellite Imagery Services Market Segmentation By Geography
-
1. North America
- 1.1. United States
- 1.2. Canada
- 1.3. Mexico
-
2. South America
- 2.1. Brazil
- 2.2. Argentina
- 2.3. Rest of South America
-
3. Europe
- 3.1. United Kingdom
- 3.2. Germany
- 3.3. France
- 3.4. Italy
- 3.5. Spain
- 3.6. Russia
- 3.7. Benelux
- 3.8. Nordics
- 3.9. Rest of Europe
-
4. Middle East & Africa
- 4.1. Turkey
- 4.2. Israel
- 4.3. GCC
- 4.4. North Africa
- 4.5. South Africa
- 4.6. Rest of Middle East & Africa
-
5. Asia Pacific
- 5.1. China
- 5.2. India
- 5.3. Japan
- 5.4. South Korea
- 5.5. ASEAN
- 5.6. Oceania
- 5.7. Rest of Asia Pacific
KSA Satellite Imagery Services Market Regional Market Share
Geographic Coverage of KSA Satellite Imagery Services Market
KSA Satellite Imagery Services Market REPORT HIGHLIGHTS
| Aspects | Details |
|---|---|
| Study Period | 2020-2034 |
| Base Year | 2025 |
| Estimated Year | 2026 |
| Forecast Period | 2026-2034 |
| Historical Period | 2020-2025 |
| Growth Rate | CAGR of 5.6% from 2020-2034 |
| Segmentation |
|
Table of Contents
- 1. Introduction
- 1.1. Research Scope
- 1.2. Market Segmentation
- 1.3. Research Methodology
- 1.4. Definitions and Assumptions
- 2. Executive Summary
- 2.1. Introduction
- 3. Market Dynamics
- 3.1. Introduction
- 3.2. Market Drivers
- 3.2.1. The Growth in the KSA Government's investment in the space sector In Line With Saudi Vision; Adoption of Big Data and Imagery Analytics
- 3.3. Market Restrains
- 3.3.1. High Cost of Satellite Imaging Data Acquisition and Processing
- 3.4. Market Trends
- 3.4.1. Natural Resource Management Segment is Expected to Witness Significant Growth
- 4. Market Factor Analysis
- 4.1. Porters Five Forces
- 4.2. Supply/Value Chain
- 4.3. PESTEL analysis
- 4.4. Market Entropy
- 4.5. Patent/Trademark Analysis
- 5. Global KSA Satellite Imagery Services Market Analysis, Insights and Forecast, 2020-2032
- 5.1. Market Analysis, Insights and Forecast - by Application
- 5.1.1. Geospatial Data Acquisition and Mapping
- 5.1.2. Natural Resource Management
- 5.1.3. Surveillance and Security
- 5.1.4. Conservation and Research
- 5.1.5. Disaster Management
- 5.1.6. Intelligence
- 5.2. Market Analysis, Insights and Forecast - by End-User
- 5.2.1. Government
- 5.2.2. Construction
- 5.2.3. Transportation and Logistics
- 5.2.4. Military and Defense
- 5.2.5. Forestry and Agriculture
- 5.2.6. Others
- 5.3. Market Analysis, Insights and Forecast - by Region
- 5.3.1. North America
- 5.3.2. South America
- 5.3.3. Europe
- 5.3.4. Middle East & Africa
- 5.3.5. Asia Pacific
- 5.1. Market Analysis, Insights and Forecast - by Application
- 6. North America KSA Satellite Imagery Services Market Analysis, Insights and Forecast, 2020-2032
- 6.1. Market Analysis, Insights and Forecast - by Application
- 6.1.1. Geospatial Data Acquisition and Mapping
- 6.1.2. Natural Resource Management
- 6.1.3. Surveillance and Security
- 6.1.4. Conservation and Research
- 6.1.5. Disaster Management
- 6.1.6. Intelligence
- 6.2. Market Analysis, Insights and Forecast - by End-User
- 6.2.1. Government
- 6.2.2. Construction
- 6.2.3. Transportation and Logistics
- 6.2.4. Military and Defense
- 6.2.5. Forestry and Agriculture
- 6.2.6. Others
- 6.1. Market Analysis, Insights and Forecast - by Application
- 7. South America KSA Satellite Imagery Services Market Analysis, Insights and Forecast, 2020-2032
- 7.1. Market Analysis, Insights and Forecast - by Application
- 7.1.1. Geospatial Data Acquisition and Mapping
- 7.1.2. Natural Resource Management
- 7.1.3. Surveillance and Security
- 7.1.4. Conservation and Research
- 7.1.5. Disaster Management
- 7.1.6. Intelligence
- 7.2. Market Analysis, Insights and Forecast - by End-User
- 7.2.1. Government
- 7.2.2. Construction
- 7.2.3. Transportation and Logistics
- 7.2.4. Military and Defense
- 7.2.5. Forestry and Agriculture
- 7.2.6. Others
- 7.1. Market Analysis, Insights and Forecast - by Application
- 8. Europe KSA Satellite Imagery Services Market Analysis, Insights and Forecast, 2020-2032
- 8.1. Market Analysis, Insights and Forecast - by Application
- 8.1.1. Geospatial Data Acquisition and Mapping
- 8.1.2. Natural Resource Management
- 8.1.3. Surveillance and Security
- 8.1.4. Conservation and Research
- 8.1.5. Disaster Management
- 8.1.6. Intelligence
- 8.2. Market Analysis, Insights and Forecast - by End-User
- 8.2.1. Government
- 8.2.2. Construction
- 8.2.3. Transportation and Logistics
- 8.2.4. Military and Defense
- 8.2.5. Forestry and Agriculture
- 8.2.6. Others
- 8.1. Market Analysis, Insights and Forecast - by Application
- 9. Middle East & Africa KSA Satellite Imagery Services Market Analysis, Insights and Forecast, 2020-2032
- 9.1. Market Analysis, Insights and Forecast - by Application
- 9.1.1. Geospatial Data Acquisition and Mapping
- 9.1.2. Natural Resource Management
- 9.1.3. Surveillance and Security
- 9.1.4. Conservation and Research
- 9.1.5. Disaster Management
- 9.1.6. Intelligence
- 9.2. Market Analysis, Insights and Forecast - by End-User
- 9.2.1. Government
- 9.2.2. Construction
- 9.2.3. Transportation and Logistics
- 9.2.4. Military and Defense
- 9.2.5. Forestry and Agriculture
- 9.2.6. Others
- 9.1. Market Analysis, Insights and Forecast - by Application
- 10. Asia Pacific KSA Satellite Imagery Services Market Analysis, Insights and Forecast, 2020-2032
- 10.1. Market Analysis, Insights and Forecast - by Application
- 10.1.1. Geospatial Data Acquisition and Mapping
- 10.1.2. Natural Resource Management
- 10.1.3. Surveillance and Security
- 10.1.4. Conservation and Research
- 10.1.5. Disaster Management
- 10.1.6. Intelligence
- 10.2. Market Analysis, Insights and Forecast - by End-User
- 10.2.1. Government
- 10.2.2. Construction
- 10.2.3. Transportation and Logistics
- 10.2.4. Military and Defense
- 10.2.5. Forestry and Agriculture
- 10.2.6. Others
- 10.1. Market Analysis, Insights and Forecast - by Application
- 11. Competitive Analysis
- 11.1. Global Market Share Analysis 2025
- 11.2. Company Profiles
- 11.2.1 Airbus
- 11.2.1.1. Overview
- 11.2.1.2. Products
- 11.2.1.3. SWOT Analysis
- 11.2.1.4. Recent Developments
- 11.2.1.5. Financials (Based on Availability)
- 11.2.2 Space Imaging Middle East
- 11.2.2.1. Overview
- 11.2.2.2. Products
- 11.2.2.3. SWOT Analysis
- 11.2.2.4. Recent Developments
- 11.2.2.5. Financials (Based on Availability)
- 11.2.3 Thales
- 11.2.3.1. Overview
- 11.2.3.2. Products
- 11.2.3.3. SWOT Analysis
- 11.2.3.4. Recent Developments
- 11.2.3.5. Financials (Based on Availability)
- 11.2.4 FalconViz
- 11.2.4.1. Overview
- 11.2.4.2. Products
- 11.2.4.3. SWOT Analysis
- 11.2.4.4. Recent Developments
- 11.2.4.5. Financials (Based on Availability)
- 11.2.5 Northstar Saudi Arabia
- 11.2.5.1. Overview
- 11.2.5.2. Products
- 11.2.5.3. SWOT Analysis
- 11.2.5.4. Recent Developments
- 11.2.5.5. Financials (Based on Availability)
- 11.2.6 Soar Earth Ltd
- 11.2.6.1. Overview
- 11.2.6.2. Products
- 11.2.6.3. SWOT Analysis
- 11.2.6.4. Recent Developments
- 11.2.6.5. Financials (Based on Availability)
- 11.2.7 Leonardo S p A
- 11.2.7.1. Overview
- 11.2.7.2. Products
- 11.2.7.3. SWOT Analysis
- 11.2.7.4. Recent Developments
- 11.2.7.5. Financials (Based on Availability)
- 11.2.8 Serco
- 11.2.8.1. Overview
- 11.2.8.2. Products
- 11.2.8.3. SWOT Analysis
- 11.2.8.4. Recent Developments
- 11.2.8.5. Financials (Based on Availability)
- 11.2.9 NOVAsat
- 11.2.9.1. Overview
- 11.2.9.2. Products
- 11.2.9.3. SWOT Analysis
- 11.2.9.4. Recent Developments
- 11.2.9.5. Financials (Based on Availability)
- 11.2.1 Airbus
List of Figures
- Figure 1: Global KSA Satellite Imagery Services Market Revenue Breakdown (undefined, %) by Region 2025 & 2033
- Figure 2: Global KSA Satellite Imagery Services Market Volume Breakdown (K Unit, %) by Region 2025 & 2033
- Figure 3: North America KSA Satellite Imagery Services Market Revenue (undefined), by Application 2025 & 2033
- Figure 4: North America KSA Satellite Imagery Services Market Volume (K Unit), by Application 2025 & 2033
- Figure 5: North America KSA Satellite Imagery Services Market Revenue Share (%), by Application 2025 & 2033
- Figure 6: North America KSA Satellite Imagery Services Market Volume Share (%), by Application 2025 & 2033
- Figure 7: North America KSA Satellite Imagery Services Market Revenue (undefined), by End-User 2025 & 2033
- Figure 8: North America KSA Satellite Imagery Services Market Volume (K Unit), by End-User 2025 & 2033
- Figure 9: North America KSA Satellite Imagery Services Market Revenue Share (%), by End-User 2025 & 2033
- Figure 10: North America KSA Satellite Imagery Services Market Volume Share (%), by End-User 2025 & 2033
- Figure 11: North America KSA Satellite Imagery Services Market Revenue (undefined), by Country 2025 & 2033
- Figure 12: North America KSA Satellite Imagery Services Market Volume (K Unit), by Country 2025 & 2033
- Figure 13: North America KSA Satellite Imagery Services Market Revenue Share (%), by Country 2025 & 2033
- Figure 14: North America KSA Satellite Imagery Services Market Volume Share (%), by Country 2025 & 2033
- Figure 15: South America KSA Satellite Imagery Services Market Revenue (undefined), by Application 2025 & 2033
- Figure 16: South America KSA Satellite Imagery Services Market Volume (K Unit), by Application 2025 & 2033
- Figure 17: South America KSA Satellite Imagery Services Market Revenue Share (%), by Application 2025 & 2033
- Figure 18: South America KSA Satellite Imagery Services Market Volume Share (%), by Application 2025 & 2033
- Figure 19: South America KSA Satellite Imagery Services Market Revenue (undefined), by End-User 2025 & 2033
- Figure 20: South America KSA Satellite Imagery Services Market Volume (K Unit), by End-User 2025 & 2033
- Figure 21: South America KSA Satellite Imagery Services Market Revenue Share (%), by End-User 2025 & 2033
- Figure 22: South America KSA Satellite Imagery Services Market Volume Share (%), by End-User 2025 & 2033
- Figure 23: South America KSA Satellite Imagery Services Market Revenue (undefined), by Country 2025 & 2033
- Figure 24: South America KSA Satellite Imagery Services Market Volume (K Unit), by Country 2025 & 2033
- Figure 25: South America KSA Satellite Imagery Services Market Revenue Share (%), by Country 2025 & 2033
- Figure 26: South America KSA Satellite Imagery Services Market Volume Share (%), by Country 2025 & 2033
- Figure 27: Europe KSA Satellite Imagery Services Market Revenue (undefined), by Application 2025 & 2033
- Figure 28: Europe KSA Satellite Imagery Services Market Volume (K Unit), by Application 2025 & 2033
- Figure 29: Europe KSA Satellite Imagery Services Market Revenue Share (%), by Application 2025 & 2033
- Figure 30: Europe KSA Satellite Imagery Services Market Volume Share (%), by Application 2025 & 2033
- Figure 31: Europe KSA Satellite Imagery Services Market Revenue (undefined), by End-User 2025 & 2033
- Figure 32: Europe KSA Satellite Imagery Services Market Volume (K Unit), by End-User 2025 & 2033
- Figure 33: Europe KSA Satellite Imagery Services Market Revenue Share (%), by End-User 2025 & 2033
- Figure 34: Europe KSA Satellite Imagery Services Market Volume Share (%), by End-User 2025 & 2033
- Figure 35: Europe KSA Satellite Imagery Services Market Revenue (undefined), by Country 2025 & 2033
- Figure 36: Europe KSA Satellite Imagery Services Market Volume (K Unit), by Country 2025 & 2033
- Figure 37: Europe KSA Satellite Imagery Services Market Revenue Share (%), by Country 2025 & 2033
- Figure 38: Europe KSA Satellite Imagery Services Market Volume Share (%), by Country 2025 & 2033
- Figure 39: Middle East & Africa KSA Satellite Imagery Services Market Revenue (undefined), by Application 2025 & 2033
- Figure 40: Middle East & Africa KSA Satellite Imagery Services Market Volume (K Unit), by Application 2025 & 2033
- Figure 41: Middle East & Africa KSA Satellite Imagery Services Market Revenue Share (%), by Application 2025 & 2033
- Figure 42: Middle East & Africa KSA Satellite Imagery Services Market Volume Share (%), by Application 2025 & 2033
- Figure 43: Middle East & Africa KSA Satellite Imagery Services Market Revenue (undefined), by End-User 2025 & 2033
- Figure 44: Middle East & Africa KSA Satellite Imagery Services Market Volume (K Unit), by End-User 2025 & 2033
- Figure 45: Middle East & Africa KSA Satellite Imagery Services Market Revenue Share (%), by End-User 2025 & 2033
- Figure 46: Middle East & Africa KSA Satellite Imagery Services Market Volume Share (%), by End-User 2025 & 2033
- Figure 47: Middle East & Africa KSA Satellite Imagery Services Market Revenue (undefined), by Country 2025 & 2033
- Figure 48: Middle East & Africa KSA Satellite Imagery Services Market Volume (K Unit), by Country 2025 & 2033
- Figure 49: Middle East & Africa KSA Satellite Imagery Services Market Revenue Share (%), by Country 2025 & 2033
- Figure 50: Middle East & Africa KSA Satellite Imagery Services Market Volume Share (%), by Country 2025 & 2033
- Figure 51: Asia Pacific KSA Satellite Imagery Services Market Revenue (undefined), by Application 2025 & 2033
- Figure 52: Asia Pacific KSA Satellite Imagery Services Market Volume (K Unit), by Application 2025 & 2033
- Figure 53: Asia Pacific KSA Satellite Imagery Services Market Revenue Share (%), by Application 2025 & 2033
- Figure 54: Asia Pacific KSA Satellite Imagery Services Market Volume Share (%), by Application 2025 & 2033
- Figure 55: Asia Pacific KSA Satellite Imagery Services Market Revenue (undefined), by End-User 2025 & 2033
- Figure 56: Asia Pacific KSA Satellite Imagery Services Market Volume (K Unit), by End-User 2025 & 2033
- Figure 57: Asia Pacific KSA Satellite Imagery Services Market Revenue Share (%), by End-User 2025 & 2033
- Figure 58: Asia Pacific KSA Satellite Imagery Services Market Volume Share (%), by End-User 2025 & 2033
- Figure 59: Asia Pacific KSA Satellite Imagery Services Market Revenue (undefined), by Country 2025 & 2033
- Figure 60: Asia Pacific KSA Satellite Imagery Services Market Volume (K Unit), by Country 2025 & 2033
- Figure 61: Asia Pacific KSA Satellite Imagery Services Market Revenue Share (%), by Country 2025 & 2033
- Figure 62: Asia Pacific KSA Satellite Imagery Services Market Volume Share (%), by Country 2025 & 2033
List of Tables
- Table 1: Global KSA Satellite Imagery Services Market Revenue undefined Forecast, by Application 2020 & 2033
- Table 2: Global KSA Satellite Imagery Services Market Volume K Unit Forecast, by Application 2020 & 2033
- Table 3: Global KSA Satellite Imagery Services Market Revenue undefined Forecast, by End-User 2020 & 2033
- Table 4: Global KSA Satellite Imagery Services Market Volume K Unit Forecast, by End-User 2020 & 2033
- Table 5: Global KSA Satellite Imagery Services Market Revenue undefined Forecast, by Region 2020 & 2033
- Table 6: Global KSA Satellite Imagery Services Market Volume K Unit Forecast, by Region 2020 & 2033
- Table 7: Global KSA Satellite Imagery Services Market Revenue undefined Forecast, by Application 2020 & 2033
- Table 8: Global KSA Satellite Imagery Services Market Volume K Unit Forecast, by Application 2020 & 2033
- Table 9: Global KSA Satellite Imagery Services Market Revenue undefined Forecast, by End-User 2020 & 2033
- Table 10: Global KSA Satellite Imagery Services Market Volume K Unit Forecast, by End-User 2020 & 2033
- Table 11: Global KSA Satellite Imagery Services Market Revenue undefined Forecast, by Country 2020 & 2033
- Table 12: Global KSA Satellite Imagery Services Market Volume K Unit Forecast, by Country 2020 & 2033
- Table 13: United States KSA Satellite Imagery Services Market Revenue (undefined) Forecast, by Application 2020 & 2033
- Table 14: United States KSA Satellite Imagery Services Market Volume (K Unit) Forecast, by Application 2020 & 2033
- Table 15: Canada KSA Satellite Imagery Services Market Revenue (undefined) Forecast, by Application 2020 & 2033
- Table 16: Canada KSA Satellite Imagery Services Market Volume (K Unit) Forecast, by Application 2020 & 2033
- Table 17: Mexico KSA Satellite Imagery Services Market Revenue (undefined) Forecast, by Application 2020 & 2033
- Table 18: Mexico KSA Satellite Imagery Services Market Volume (K Unit) Forecast, by Application 2020 & 2033
- Table 19: Global KSA Satellite Imagery Services Market Revenue undefined Forecast, by Application 2020 & 2033
- Table 20: Global KSA Satellite Imagery Services Market Volume K Unit Forecast, by Application 2020 & 2033
- Table 21: Global KSA Satellite Imagery Services Market Revenue undefined Forecast, by End-User 2020 & 2033
- Table 22: Global KSA Satellite Imagery Services Market Volume K Unit Forecast, by End-User 2020 & 2033
- Table 23: Global KSA Satellite Imagery Services Market Revenue undefined Forecast, by Country 2020 & 2033
- Table 24: Global KSA Satellite Imagery Services Market Volume K Unit Forecast, by Country 2020 & 2033
- Table 25: Brazil KSA Satellite Imagery Services Market Revenue (undefined) Forecast, by Application 2020 & 2033
- Table 26: Brazil KSA Satellite Imagery Services Market Volume (K Unit) Forecast, by Application 2020 & 2033
- Table 27: Argentina KSA Satellite Imagery Services Market Revenue (undefined) Forecast, by Application 2020 & 2033
- Table 28: Argentina KSA Satellite Imagery Services Market Volume (K Unit) Forecast, by Application 2020 & 2033
- Table 29: Rest of South America KSA Satellite Imagery Services Market Revenue (undefined) Forecast, by Application 2020 & 2033
- Table 30: Rest of South America KSA Satellite Imagery Services Market Volume (K Unit) Forecast, by Application 2020 & 2033
- Table 31: Global KSA Satellite Imagery Services Market Revenue undefined Forecast, by Application 2020 & 2033
- Table 32: Global KSA Satellite Imagery Services Market Volume K Unit Forecast, by Application 2020 & 2033
- Table 33: Global KSA Satellite Imagery Services Market Revenue undefined Forecast, by End-User 2020 & 2033
- Table 34: Global KSA Satellite Imagery Services Market Volume K Unit Forecast, by End-User 2020 & 2033
- Table 35: Global KSA Satellite Imagery Services Market Revenue undefined Forecast, by Country 2020 & 2033
- Table 36: Global KSA Satellite Imagery Services Market Volume K Unit Forecast, by Country 2020 & 2033
- Table 37: United Kingdom KSA Satellite Imagery Services Market Revenue (undefined) Forecast, by Application 2020 & 2033
- Table 38: United Kingdom KSA Satellite Imagery Services Market Volume (K Unit) Forecast, by Application 2020 & 2033
- Table 39: Germany KSA Satellite Imagery Services Market Revenue (undefined) Forecast, by Application 2020 & 2033
- Table 40: Germany KSA Satellite Imagery Services Market Volume (K Unit) Forecast, by Application 2020 & 2033
- Table 41: France KSA Satellite Imagery Services Market Revenue (undefined) Forecast, by Application 2020 & 2033
- Table 42: France KSA Satellite Imagery Services Market Volume (K Unit) Forecast, by Application 2020 & 2033
- Table 43: Italy KSA Satellite Imagery Services Market Revenue (undefined) Forecast, by Application 2020 & 2033
- Table 44: Italy KSA Satellite Imagery Services Market Volume (K Unit) Forecast, by Application 2020 & 2033
- Table 45: Spain KSA Satellite Imagery Services Market Revenue (undefined) Forecast, by Application 2020 & 2033
- Table 46: Spain KSA Satellite Imagery Services Market Volume (K Unit) Forecast, by Application 2020 & 2033
- Table 47: Russia KSA Satellite Imagery Services Market Revenue (undefined) Forecast, by Application 2020 & 2033
- Table 48: Russia KSA Satellite Imagery Services Market Volume (K Unit) Forecast, by Application 2020 & 2033
- Table 49: Benelux KSA Satellite Imagery Services Market Revenue (undefined) Forecast, by Application 2020 & 2033
- Table 50: Benelux KSA Satellite Imagery Services Market Volume (K Unit) Forecast, by Application 2020 & 2033
- Table 51: Nordics KSA Satellite Imagery Services Market Revenue (undefined) Forecast, by Application 2020 & 2033
- Table 52: Nordics KSA Satellite Imagery Services Market Volume (K Unit) Forecast, by Application 2020 & 2033
- Table 53: Rest of Europe KSA Satellite Imagery Services Market Revenue (undefined) Forecast, by Application 2020 & 2033
- Table 54: Rest of Europe KSA Satellite Imagery Services Market Volume (K Unit) Forecast, by Application 2020 & 2033
- Table 55: Global KSA Satellite Imagery Services Market Revenue undefined Forecast, by Application 2020 & 2033
- Table 56: Global KSA Satellite Imagery Services Market Volume K Unit Forecast, by Application 2020 & 2033
- Table 57: Global KSA Satellite Imagery Services Market Revenue undefined Forecast, by End-User 2020 & 2033
- Table 58: Global KSA Satellite Imagery Services Market Volume K Unit Forecast, by End-User 2020 & 2033
- Table 59: Global KSA Satellite Imagery Services Market Revenue undefined Forecast, by Country 2020 & 2033
- Table 60: Global KSA Satellite Imagery Services Market Volume K Unit Forecast, by Country 2020 & 2033
- Table 61: Turkey KSA Satellite Imagery Services Market Revenue (undefined) Forecast, by Application 2020 & 2033
- Table 62: Turkey KSA Satellite Imagery Services Market Volume (K Unit) Forecast, by Application 2020 & 2033
- Table 63: Israel KSA Satellite Imagery Services Market Revenue (undefined) Forecast, by Application 2020 & 2033
- Table 64: Israel KSA Satellite Imagery Services Market Volume (K Unit) Forecast, by Application 2020 & 2033
- Table 65: GCC KSA Satellite Imagery Services Market Revenue (undefined) Forecast, by Application 2020 & 2033
- Table 66: GCC KSA Satellite Imagery Services Market Volume (K Unit) Forecast, by Application 2020 & 2033
- Table 67: North Africa KSA Satellite Imagery Services Market Revenue (undefined) Forecast, by Application 2020 & 2033
- Table 68: North Africa KSA Satellite Imagery Services Market Volume (K Unit) Forecast, by Application 2020 & 2033
- Table 69: South Africa KSA Satellite Imagery Services Market Revenue (undefined) Forecast, by Application 2020 & 2033
- Table 70: South Africa KSA Satellite Imagery Services Market Volume (K Unit) Forecast, by Application 2020 & 2033
- Table 71: Rest of Middle East & Africa KSA Satellite Imagery Services Market Revenue (undefined) Forecast, by Application 2020 & 2033
- Table 72: Rest of Middle East & Africa KSA Satellite Imagery Services Market Volume (K Unit) Forecast, by Application 2020 & 2033
- Table 73: Global KSA Satellite Imagery Services Market Revenue undefined Forecast, by Application 2020 & 2033
- Table 74: Global KSA Satellite Imagery Services Market Volume K Unit Forecast, by Application 2020 & 2033
- Table 75: Global KSA Satellite Imagery Services Market Revenue undefined Forecast, by End-User 2020 & 2033
- Table 76: Global KSA Satellite Imagery Services Market Volume K Unit Forecast, by End-User 2020 & 2033
- Table 77: Global KSA Satellite Imagery Services Market Revenue undefined Forecast, by Country 2020 & 2033
- Table 78: Global KSA Satellite Imagery Services Market Volume K Unit Forecast, by Country 2020 & 2033
- Table 79: China KSA Satellite Imagery Services Market Revenue (undefined) Forecast, by Application 2020 & 2033
- Table 80: China KSA Satellite Imagery Services Market Volume (K Unit) Forecast, by Application 2020 & 2033
- Table 81: India KSA Satellite Imagery Services Market Revenue (undefined) Forecast, by Application 2020 & 2033
- Table 82: India KSA Satellite Imagery Services Market Volume (K Unit) Forecast, by Application 2020 & 2033
- Table 83: Japan KSA Satellite Imagery Services Market Revenue (undefined) Forecast, by Application 2020 & 2033
- Table 84: Japan KSA Satellite Imagery Services Market Volume (K Unit) Forecast, by Application 2020 & 2033
- Table 85: South Korea KSA Satellite Imagery Services Market Revenue (undefined) Forecast, by Application 2020 & 2033
- Table 86: South Korea KSA Satellite Imagery Services Market Volume (K Unit) Forecast, by Application 2020 & 2033
- Table 87: ASEAN KSA Satellite Imagery Services Market Revenue (undefined) Forecast, by Application 2020 & 2033
- Table 88: ASEAN KSA Satellite Imagery Services Market Volume (K Unit) Forecast, by Application 2020 & 2033
- Table 89: Oceania KSA Satellite Imagery Services Market Revenue (undefined) Forecast, by Application 2020 & 2033
- Table 90: Oceania KSA Satellite Imagery Services Market Volume (K Unit) Forecast, by Application 2020 & 2033
- Table 91: Rest of Asia Pacific KSA Satellite Imagery Services Market Revenue (undefined) Forecast, by Application 2020 & 2033
- Table 92: Rest of Asia Pacific KSA Satellite Imagery Services Market Volume (K Unit) Forecast, by Application 2020 & 2033
Frequently Asked Questions
1. What is the projected Compound Annual Growth Rate (CAGR) of the KSA Satellite Imagery Services Market ?
The projected CAGR is approximately 5.6%.
2. Which companies are prominent players in the KSA Satellite Imagery Services Market ?
Key companies in the market include Airbus, Space Imaging Middle East, Thales, FalconViz, Northstar Saudi Arabia, Soar Earth Ltd, Leonardo S p A, Serco, NOVAsat.
3. What are the main segments of the KSA Satellite Imagery Services Market ?
The market segments include Application, End-User.
4. Can you provide details about the market size?
The market size is estimated to be USD XXX N/A as of 2022.
5. What are some drivers contributing to market growth?
The Growth in the KSA Government's investment in the space sector In Line With Saudi Vision; Adoption of Big Data and Imagery Analytics.
6. What are the notable trends driving market growth?
Natural Resource Management Segment is Expected to Witness Significant Growth.
7. Are there any restraints impacting market growth?
High Cost of Satellite Imaging Data Acquisition and Processing.
8. Can you provide examples of recent developments in the market?
August 2023 - Satellogic signed an agreement with Quant Data & Analytics, a Saudi data solutions provider for real estate and retail sectors. Quant Data & Analytics plans to use Satellogic's high-resolution satellite imagery to serve the property tech landscape in Saudi Arabia and the Gulf region.
9. What pricing options are available for accessing the report?
Pricing options include single-user, multi-user, and enterprise licenses priced at USD 3800, USD 4500, and USD 5800 respectively.
10. Is the market size provided in terms of value or volume?
The market size is provided in terms of value, measured in N/A and volume, measured in K Unit.
11. Are there any specific market keywords associated with the report?
Yes, the market keyword associated with the report is "KSA Satellite Imagery Services Market ," which aids in identifying and referencing the specific market segment covered.
12. How do I determine which pricing option suits my needs best?
The pricing options vary based on user requirements and access needs. Individual users may opt for single-user licenses, while businesses requiring broader access may choose multi-user or enterprise licenses for cost-effective access to the report.
13. Are there any additional resources or data provided in the KSA Satellite Imagery Services Market report?
While the report offers comprehensive insights, it's advisable to review the specific contents or supplementary materials provided to ascertain if additional resources or data are available.
14. How can I stay updated on further developments or reports in the KSA Satellite Imagery Services Market ?
To stay informed about further developments, trends, and reports in the KSA Satellite Imagery Services Market , consider subscribing to industry newsletters, following relevant companies and organizations, or regularly checking reputable industry news sources and publications.
Methodology
Step 1 - Identification of Relevant Samples Size from Population Database


Step 2 - Approaches for Defining Global Market Size (Value, Volume* & Price*)

Note*: In applicable scenarios
Step 3 - Data Sources
Primary Research
- Web Analytics
- Survey Reports
- Research Institute
- Latest Research Reports
- Opinion Leaders
Secondary Research
- Annual Reports
- White Paper
- Latest Press Release
- Industry Association
- Paid Database
- Investor Presentations

Step 4 - Data Triangulation
Involves using different sources of information in order to increase the validity of a study
These sources are likely to be stakeholders in a program - participants, other researchers, program staff, other community members, and so on.
Then we put all data in single framework & apply various statistical tools to find out the dynamic on the market.
During the analysis stage, feedback from the stakeholder groups would be compared to determine areas of agreement as well as areas of divergence