

Key Insights
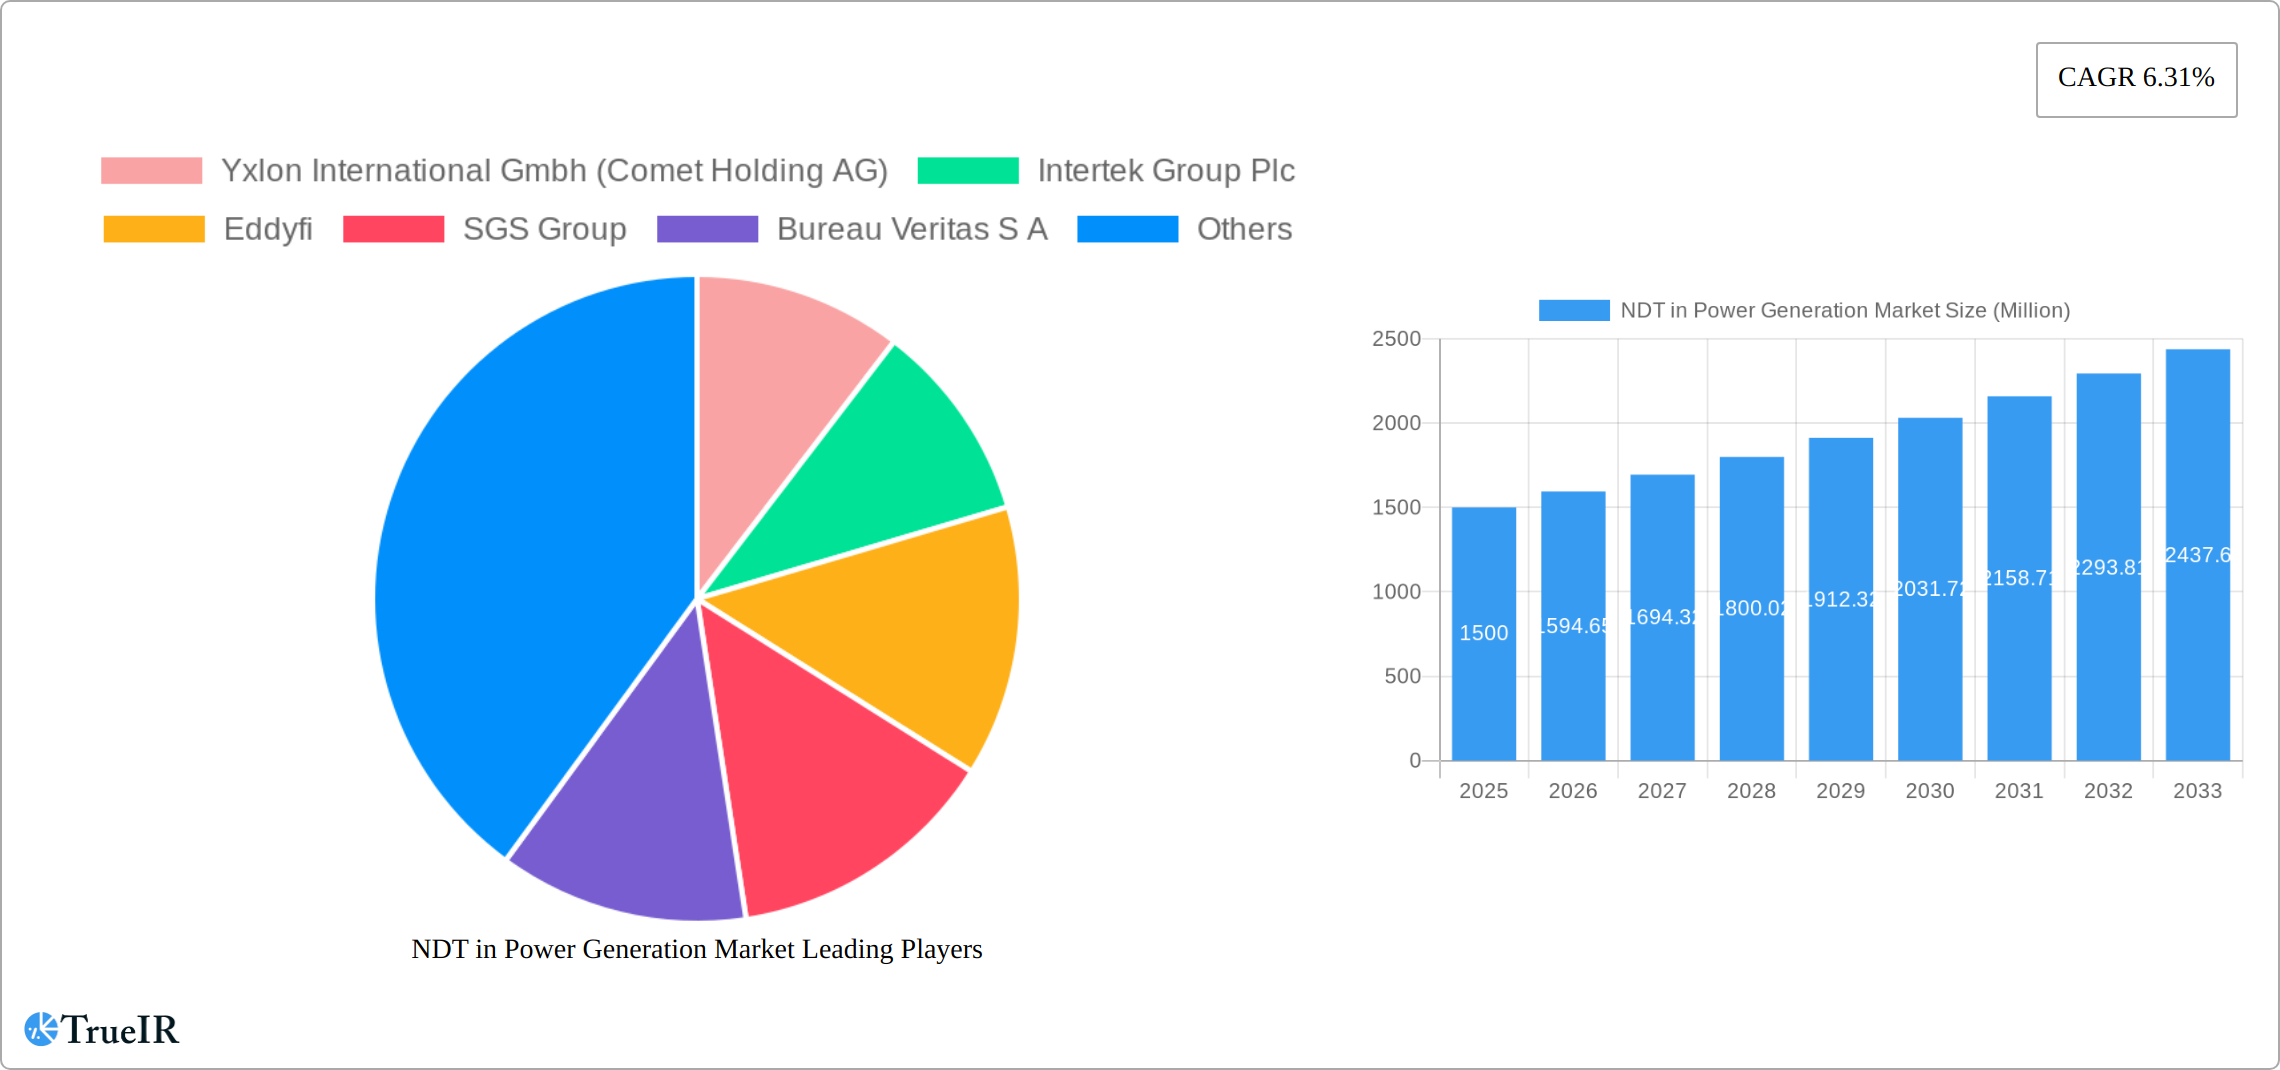
The global Non-Destructive Testing (NDT) market for power generation is poised for significant expansion, driven by the imperative for reliable energy infrastructure and stringent safety compliance. The market is projected to reach an estimated $4.18 billion by 2025, with a Compound Annual Growth Rate (CAGR) of 6.24% from 2025 to 2033. This growth trajectory is underpinned by several critical factors. An aging global power plant fleet necessitates proactive maintenance and inspection, bolstering demand for advanced NDT solutions to prevent operational failures and ensure efficiency. Concurrently, the escalating adoption of renewable energy sources, including wind and solar, requires robust quality assurance throughout their operational lifespan. Enhanced regulatory mandates for periodic NDT inspections across diverse power generation facilities further accelerate market demand. The market is segmented by testing technology, with ultrasonic and radiography testing leading due to their widespread applicability and efficacy in defect detection. Key industry players are actively investing in research and development to innovate testing methodologies and broaden service portfolios, contributing to overall market advancement.
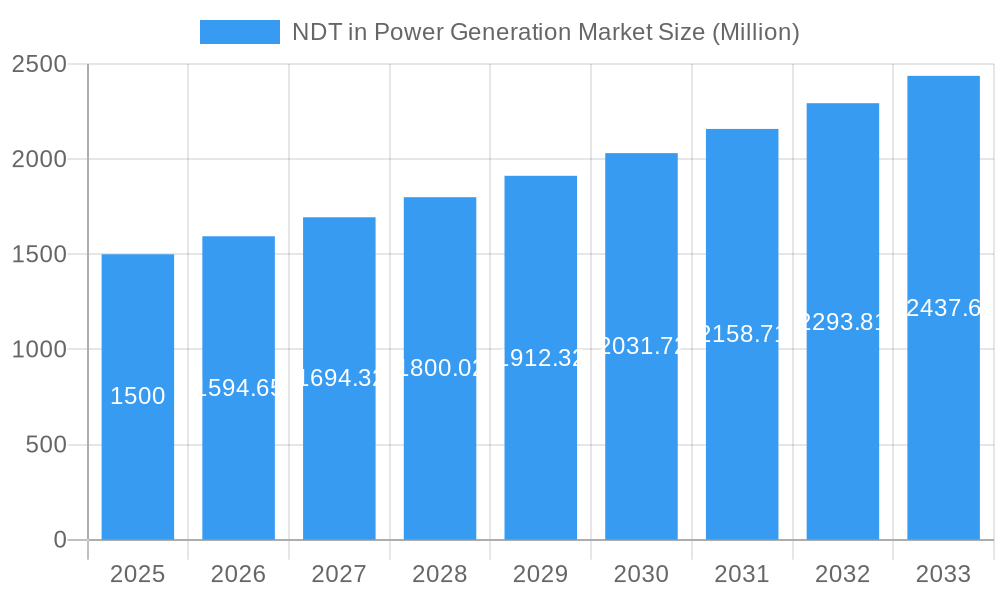
NDT in Power Generation Market Market Size (In Billion)
Geographically, the NDT market in power generation is concentrated in regions with established infrastructure and rigorous regulatory environments, notably North America and Europe. The Asia-Pacific region is anticipated to exhibit accelerated growth, propelled by rapid industrialization and expanding energy production capabilities, which will redefine market dynamics and foster increased competition. While initial capital outlay for sophisticated NDT equipment and a deficit in skilled personnel present growth challenges, these are expected to be offset by technological innovation, enhanced training initiatives, and a rising trend in outsourcing NDT services.
NDT in Power Generation Market Company Market Share
NDT in Power Generation Market: A Comprehensive Report (2019-2033)
This comprehensive report provides a detailed analysis of the Non-Destructive Testing (NDT) market within the power generation sector, covering the period 2019-2033. With a focus on market size, growth drivers, competitive landscape, and future outlook, this report is an essential resource for industry professionals, investors, and strategic decision-makers. The report leverages extensive data analysis and incorporates insights from key industry developments to offer a clear and actionable understanding of this dynamic market. The market is projected to reach xx Million by 2033, exhibiting a CAGR of xx% during the forecast period (2025-2033).
NDT in Power Generation Market Market Structure & Competitive Landscape
The NDT in power generation market exhibits a moderately concentrated structure, with several key players holding significant market share. The market concentration ratio (CR4) is estimated at xx%, indicating the presence of both large multinational corporations and specialized NDT service providers. Innovation is a key driver, particularly in advanced testing technologies like AI-powered inspection systems. Regulatory compliance, particularly concerning safety and environmental standards within the power generation sector, heavily influences market dynamics. Product substitutes are limited, given the critical nature of NDT for ensuring operational safety and asset longevity. End-users are primarily power generation companies, encompassing thermal, nuclear, and renewable energy sources. The market has witnessed notable M&A activity in recent years, with a total estimated transaction value of xx Million between 2019 and 2024. This activity reflects consolidation and expansion efforts by major players.
- Market Concentration: CR4 estimated at xx%
- Key Innovation Drivers: AI-powered inspection, advanced sensor technologies.
- Regulatory Impacts: Stringent safety and environmental standards drive demand for reliable NDT.
- Product Substitutes: Limited due to critical nature of NDT.
- End-User Segmentation: Thermal, nuclear, renewable energy power generators.
- M&A Trends: Significant consolidation and expansion through acquisitions (xx Million in transaction value 2019-2024).
NDT in Power Generation Market Market Trends & Opportunities
The NDT (Non-Destructive Testing) in power generation market is experiencing robust growth, fueled by several converging factors. The aging global power infrastructure, comprising both traditional fossil fuel and increasingly significant renewable energy sources, necessitates rigorous and frequent inspection and maintenance. This demand directly translates into a significant and sustained market for NDT services and equipment. Technological advancements are revolutionizing the field, with the integration of artificial intelligence (AI), machine learning (ML), advanced sensor technologies, and sophisticated data analytics significantly enhancing inspection efficiency, accuracy, and the speed of analysis. This improved efficiency reduces downtime and overall operational costs. The global energy transition, marked by a significant shift towards renewable energy sources like wind turbines, solar farms, and hydroelectric plants, is creating a burgeoning new market segment for NDT. These newer energy sources often present unique challenges that NDT is uniquely positioned to address, for example, the detection of micro-cracks or corrosion in wind turbine blades. Furthermore, the market is observing a growing trend towards outsourcing NDT services, driven by cost optimization strategies employed by power generation companies seeking access to specialized expertise and advanced technologies that they may not possess in-house. Competitive dynamics are robust, characterized by intense competition among established industry leaders and the emergence of agile, innovative startups offering specialized NDT solutions focused on specific niches or technologies. The market is projected to reach significant growth, estimated at xx Million by 2033, propelled by the continued aging of infrastructure and rapid technological innovation. The market penetration rate for advanced NDT technologies is anticipated to increase from xx% in 2025 to xx% by 2033, demonstrating the adoption of sophisticated and increasingly effective NDT technologies.
Dominant Markets & Segments in NDT in Power Generation Market
North America currently commands the largest market share in the NDT in power generation market, followed closely by Europe and the rapidly expanding Asia-Pacific region. Market segmentation by type reveals that services represent the largest share, underscoring the growing trend of outsourcing. Among the various NDT testing technologies employed, ultrasonic testing (UT) and radiographic testing (RT) remain dominant due to their established reliability and wide applicability. However, the adoption of eddy current testing (ECT), phased array ultrasonic testing (PAUT), and other advanced methods is accelerating rapidly, driven by their superior capabilities in detecting specific types of defects and their higher levels of precision. This shift reflects the industry's increasing focus on preventative maintenance and early defect detection.
- Leading Region: North America
- Key Growth Drivers:
- Aging power generation infrastructure mandating regular and thorough inspection.
- Stringent safety regulations and compliance requirements.
- Explosive growth of the renewable energy sector creating new inspection needs.
- Continuous technological advancements enhancing inspection capabilities and efficiency.
- Increasing focus on preventative maintenance to reduce downtime and operational costs.
- Dominant Segment (Type): Services
- Dominant Testing Technologies: Ultrasonic testing, Radiography testing, with increasing adoption of ECT and PAUT.
NDT in Power Generation Market Product Analysis
The NDT product landscape is characterized by a wide range of equipment and services, including advanced ultrasonic testing systems, automated radiography systems, and AI-powered data analysis software. These advancements offer improved accuracy, faster inspection times, and reduced operational costs. Competitive advantages are derived from superior technology, specialized expertise, and efficient service delivery. The market shows a strong trend towards integrating AI and machine learning to improve the speed and accuracy of inspections, especially in complex infrastructure.
Key Drivers, Barriers & Challenges in NDT in Power Generation Market
Key Drivers: The aging global power generation infrastructure, the increasing emphasis on safety regulations, and the growth of the renewable energy sector are driving demand for NDT services and equipment. Technological advancements, such as AI-powered inspection systems, are improving accuracy and efficiency.
Key Challenges: Supply chain disruptions can affect the availability of critical components for NDT equipment, leading to project delays and increased costs. Stringent regulatory frameworks and certification requirements can increase the entry barrier for new players and pose compliance challenges. Intense competition among established players and the emergence of innovative startups can intensify the competitive landscape. Estimated impact on market growth due to supply chain issues: xx% reduction in growth rate.
Growth Drivers in the NDT in Power Generation Market Market
Technological advancements are creating improved accuracy and efficiency of inspections, lowering overall costs. The increasing age of power generation assets globally necessitates increased NDT activities for safety and maintenance. Stringent government regulations for safety and environmental compliance within the power industry are stimulating the market.
Challenges Impacting NDT in Power Generation Market Growth
Several challenges impede the growth of the NDT in power generation market. Regulatory hurdles and stringent certification requirements increase the cost of entry and operation for businesses, potentially limiting market participation, especially for smaller or newer companies. The availability and cost of highly skilled and certified NDT personnel represent a significant bottleneck, impacting the availability of services, particularly in regions with limited training programs. Supply chain disruptions and the increasing cost of specialized NDT equipment can impact project timelines and increase overall operational expenses. The need for continuous professional development to keep abreast of technological advancements also poses a challenge for NDT service providers.
Key Players Shaping the NDT in Power Generation Market Market
Significant NDT in Power Generation Market Industry Milestones
- June 2022: ALEIA and Omexom launch the AUTEND project using AI to accelerate nuclear power plant inspections.
- April 2021: IR Supplies and Services partners with Creative Electron, enhancing NDT capabilities in Canada.
- March 2021: Applus+ acquires Inecosa and Adícora, expanding its power generation NDT services.
Future Outlook for NDT in Power Generation Market Market
The NDT in power generation market is projected to experience sustained and significant growth, driven by a confluence of factors. These include the inevitable aging of existing infrastructure, increasingly stringent regulatory scrutiny emphasizing safety and reliability, and the continued expansion of the renewable energy sector, each demanding robust and reliable NDT solutions. Strategic opportunities abound for companies that focus on developing cutting-edge NDT technologies, broadening their service offerings to address the diverse needs of the market, and expanding into emerging markets. The market holds substantial potential for growth, especially in the adoption of AI, ML, and advanced data analytics to optimize inspection processes, improve predictive maintenance capabilities, and significantly reduce operational costs and downtime. The integration of these advanced technologies will become a key differentiator for NDT service providers.
NDT in Power Generation Market Segmentation
-
1. Type
- 1.1. Services
- 1.2. Equipment
-
2. Testing Technology
- 2.1. Radiography Testing
- 2.2. Ultrasonic Testing
- 2.3. Visual Inspection Testing
- 2.4. Eddy Current Testing
- 2.5. Other Testing Technologies
NDT in Power Generation Market Segmentation By Geography
-
1. North America
- 1.1. United States
- 1.2. Canada
-
2. Europe
- 2.1. United Kingdom
- 2.2. Germany
- 2.3. France
- 2.4. Rest of Europe
-
3. Asia Pacific
- 3.1. China
- 3.2. Japan
- 3.3. India
- 3.4. Rest of Asia Pacific
- 4. Latin America
- 5. Middle East and Africa
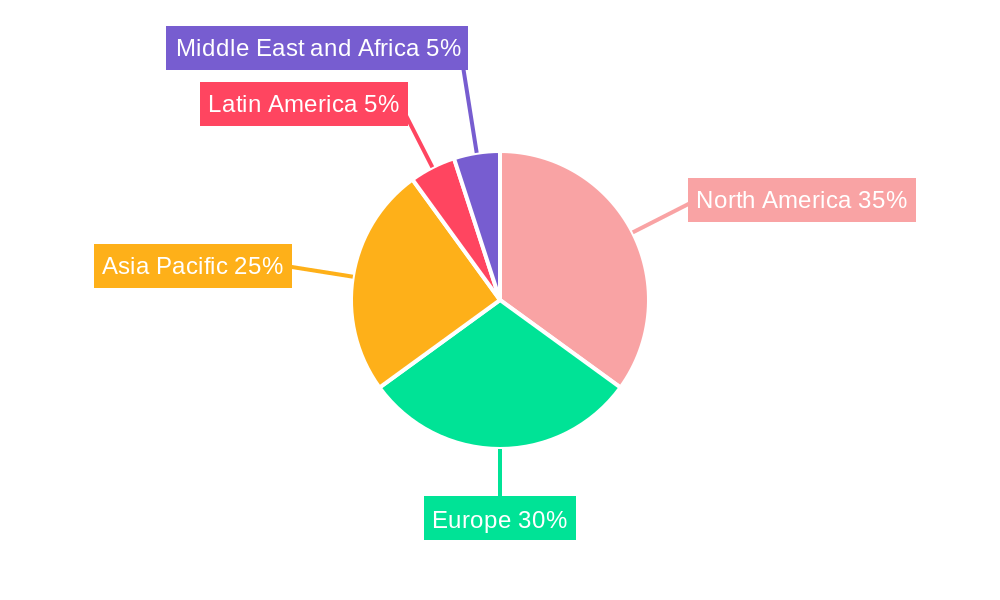
NDT in Power Generation Market Regional Market Share
Geographic Coverage of NDT in Power Generation Market
NDT in Power Generation Market REPORT HIGHLIGHTS
| Aspects | Details |
|---|---|
| Study Period | 2020-2034 |
| Base Year | 2025 |
| Estimated Year | 2026 |
| Forecast Period | 2026-2034 |
| Historical Period | 2020-2025 |
| Growth Rate | CAGR of 6.24% from 2020-2034 |
| Segmentation |
|
Table of Contents
- 1. Introduction
- 1.1. Research Scope
- 1.2. Market Segmentation
- 1.3. Research Methodology
- 1.4. Definitions and Assumptions
- 2. Executive Summary
- 2.1. Introduction
- 3. Market Dynamics
- 3.1. Introduction
- 3.2. Market Drivers
- 3.2.1. Stringent Regulations Mandating Safety Standards; Increase in Demand for Flaw Detection to Reduce Repair Cost; Aging Infrastructure and Increasing Need for Maintenance
- 3.3. Market Restrains
- 3.3.1. Lack of Skilled Workforce and Training Regulations
- 3.4. Market Trends
- 3.4.1. Visual Inspection Testing is Expected to Witness a Significant Growth
- 4. Market Factor Analysis
- 4.1. Porters Five Forces
- 4.2. Supply/Value Chain
- 4.3. PESTEL analysis
- 4.4. Market Entropy
- 4.5. Patent/Trademark Analysis
- 5. Global NDT in Power Generation Market Analysis, Insights and Forecast, 2020-2032
- 5.1. Market Analysis, Insights and Forecast - by Type
- 5.1.1. Services
- 5.1.2. Equipment
- 5.2. Market Analysis, Insights and Forecast - by Testing Technology
- 5.2.1. Radiography Testing
- 5.2.2. Ultrasonic Testing
- 5.2.3. Visual Inspection Testing
- 5.2.4. Eddy Current Testing
- 5.2.5. Other Testing Technologies
- 5.3. Market Analysis, Insights and Forecast - by Region
- 5.3.1. North America
- 5.3.2. Europe
- 5.3.3. Asia Pacific
- 5.3.4. Latin America
- 5.3.5. Middle East and Africa
- 5.1. Market Analysis, Insights and Forecast - by Type
- 6. North America NDT in Power Generation Market Analysis, Insights and Forecast, 2020-2032
- 6.1. Market Analysis, Insights and Forecast - by Type
- 6.1.1. Services
- 6.1.2. Equipment
- 6.2. Market Analysis, Insights and Forecast - by Testing Technology
- 6.2.1. Radiography Testing
- 6.2.2. Ultrasonic Testing
- 6.2.3. Visual Inspection Testing
- 6.2.4. Eddy Current Testing
- 6.2.5. Other Testing Technologies
- 6.1. Market Analysis, Insights and Forecast - by Type
- 7. Europe NDT in Power Generation Market Analysis, Insights and Forecast, 2020-2032
- 7.1. Market Analysis, Insights and Forecast - by Type
- 7.1.1. Services
- 7.1.2. Equipment
- 7.2. Market Analysis, Insights and Forecast - by Testing Technology
- 7.2.1. Radiography Testing
- 7.2.2. Ultrasonic Testing
- 7.2.3. Visual Inspection Testing
- 7.2.4. Eddy Current Testing
- 7.2.5. Other Testing Technologies
- 7.1. Market Analysis, Insights and Forecast - by Type
- 8. Asia Pacific NDT in Power Generation Market Analysis, Insights and Forecast, 2020-2032
- 8.1. Market Analysis, Insights and Forecast - by Type
- 8.1.1. Services
- 8.1.2. Equipment
- 8.2. Market Analysis, Insights and Forecast - by Testing Technology
- 8.2.1. Radiography Testing
- 8.2.2. Ultrasonic Testing
- 8.2.3. Visual Inspection Testing
- 8.2.4. Eddy Current Testing
- 8.2.5. Other Testing Technologies
- 8.1. Market Analysis, Insights and Forecast - by Type
- 9. Latin America NDT in Power Generation Market Analysis, Insights and Forecast, 2020-2032
- 9.1. Market Analysis, Insights and Forecast - by Type
- 9.1.1. Services
- 9.1.2. Equipment
- 9.2. Market Analysis, Insights and Forecast - by Testing Technology
- 9.2.1. Radiography Testing
- 9.2.2. Ultrasonic Testing
- 9.2.3. Visual Inspection Testing
- 9.2.4. Eddy Current Testing
- 9.2.5. Other Testing Technologies
- 9.1. Market Analysis, Insights and Forecast - by Type
- 10. Middle East and Africa NDT in Power Generation Market Analysis, Insights and Forecast, 2020-2032
- 10.1. Market Analysis, Insights and Forecast - by Type
- 10.1.1. Services
- 10.1.2. Equipment
- 10.2. Market Analysis, Insights and Forecast - by Testing Technology
- 10.2.1. Radiography Testing
- 10.2.2. Ultrasonic Testing
- 10.2.3. Visual Inspection Testing
- 10.2.4. Eddy Current Testing
- 10.2.5. Other Testing Technologies
- 10.1. Market Analysis, Insights and Forecast - by Type
- 11. Competitive Analysis
- 11.1. Global Market Share Analysis 2025
- 11.2. Company Profiles
- 11.2.1 Yxlon International Gmbh (Comet Holding AG)
- 11.2.1.1. Overview
- 11.2.1.2. Products
- 11.2.1.3. SWOT Analysis
- 11.2.1.4. Recent Developments
- 11.2.1.5. Financials (Based on Availability)
- 11.2.2 Intertek Group Plc
- 11.2.2.1. Overview
- 11.2.2.2. Products
- 11.2.2.3. SWOT Analysis
- 11.2.2.4. Recent Developments
- 11.2.2.5. Financials (Based on Availability)
- 11.2.3 Eddyfi
- 11.2.3.1. Overview
- 11.2.3.2. Products
- 11.2.3.3. SWOT Analysis
- 11.2.3.4. Recent Developments
- 11.2.3.5. Financials (Based on Availability)
- 11.2.4 SGS Group
- 11.2.4.1. Overview
- 11.2.4.2. Products
- 11.2.4.3. SWOT Analysis
- 11.2.4.4. Recent Developments
- 11.2.4.5. Financials (Based on Availability)
- 11.2.5 Bureau Veritas S A
- 11.2.5.1. Overview
- 11.2.5.2. Products
- 11.2.5.3. SWOT Analysis
- 11.2.5.4. Recent Developments
- 11.2.5.5. Financials (Based on Availability)
- 11.2.6 Fujifilm Corporation
- 11.2.6.1. Overview
- 11.2.6.2. Products
- 11.2.6.3. SWOT Analysis
- 11.2.6.4. Recent Developments
- 11.2.6.5. Financials (Based on Availability)
- 11.2.7 Mistras Group Inc
- 11.2.7.1. Overview
- 11.2.7.2. Products
- 11.2.7.3. SWOT Analysis
- 11.2.7.4. Recent Developments
- 11.2.7.5. Financials (Based on Availability)
- 11.2.8 Zetec Inc
- 11.2.8.1. Overview
- 11.2.8.2. Products
- 11.2.8.3. SWOT Analysis
- 11.2.8.4. Recent Developments
- 11.2.8.5. Financials (Based on Availability)
- 11.2.9 Applus+ Services Technologies S L
- 11.2.9.1. Overview
- 11.2.9.2. Products
- 11.2.9.3. SWOT Analysis
- 11.2.9.4. Recent Developments
- 11.2.9.5. Financials (Based on Availability)
- 11.2.10 Baker Hughes Company
- 11.2.10.1. Overview
- 11.2.10.2. Products
- 11.2.10.3. SWOT Analysis
- 11.2.10.4. Recent Developments
- 11.2.10.5. Financials (Based on Availability)
- 11.2.11 Team Inc *List Not Exhaustive
- 11.2.11.1. Overview
- 11.2.11.2. Products
- 11.2.11.3. SWOT Analysis
- 11.2.11.4. Recent Developments
- 11.2.11.5. Financials (Based on Availability)
- 11.2.12 Olympus Corporation
- 11.2.12.1. Overview
- 11.2.12.2. Products
- 11.2.12.3. SWOT Analysis
- 11.2.12.4. Recent Developments
- 11.2.12.5. Financials (Based on Availability)
- 11.2.1 Yxlon International Gmbh (Comet Holding AG)
List of Figures
- Figure 1: Global NDT in Power Generation Market Revenue Breakdown (billion, %) by Region 2025 & 2033
- Figure 2: North America NDT in Power Generation Market Revenue (billion), by Type 2025 & 2033
- Figure 3: North America NDT in Power Generation Market Revenue Share (%), by Type 2025 & 2033
- Figure 4: North America NDT in Power Generation Market Revenue (billion), by Testing Technology 2025 & 2033
- Figure 5: North America NDT in Power Generation Market Revenue Share (%), by Testing Technology 2025 & 2033
- Figure 6: North America NDT in Power Generation Market Revenue (billion), by Country 2025 & 2033
- Figure 7: North America NDT in Power Generation Market Revenue Share (%), by Country 2025 & 2033
- Figure 8: Europe NDT in Power Generation Market Revenue (billion), by Type 2025 & 2033
- Figure 9: Europe NDT in Power Generation Market Revenue Share (%), by Type 2025 & 2033
- Figure 10: Europe NDT in Power Generation Market Revenue (billion), by Testing Technology 2025 & 2033
- Figure 11: Europe NDT in Power Generation Market Revenue Share (%), by Testing Technology 2025 & 2033
- Figure 12: Europe NDT in Power Generation Market Revenue (billion), by Country 2025 & 2033
- Figure 13: Europe NDT in Power Generation Market Revenue Share (%), by Country 2025 & 2033
- Figure 14: Asia Pacific NDT in Power Generation Market Revenue (billion), by Type 2025 & 2033
- Figure 15: Asia Pacific NDT in Power Generation Market Revenue Share (%), by Type 2025 & 2033
- Figure 16: Asia Pacific NDT in Power Generation Market Revenue (billion), by Testing Technology 2025 & 2033
- Figure 17: Asia Pacific NDT in Power Generation Market Revenue Share (%), by Testing Technology 2025 & 2033
- Figure 18: Asia Pacific NDT in Power Generation Market Revenue (billion), by Country 2025 & 2033
- Figure 19: Asia Pacific NDT in Power Generation Market Revenue Share (%), by Country 2025 & 2033
- Figure 20: Latin America NDT in Power Generation Market Revenue (billion), by Type 2025 & 2033
- Figure 21: Latin America NDT in Power Generation Market Revenue Share (%), by Type 2025 & 2033
- Figure 22: Latin America NDT in Power Generation Market Revenue (billion), by Testing Technology 2025 & 2033
- Figure 23: Latin America NDT in Power Generation Market Revenue Share (%), by Testing Technology 2025 & 2033
- Figure 24: Latin America NDT in Power Generation Market Revenue (billion), by Country 2025 & 2033
- Figure 25: Latin America NDT in Power Generation Market Revenue Share (%), by Country 2025 & 2033
- Figure 26: Middle East and Africa NDT in Power Generation Market Revenue (billion), by Type 2025 & 2033
- Figure 27: Middle East and Africa NDT in Power Generation Market Revenue Share (%), by Type 2025 & 2033
- Figure 28: Middle East and Africa NDT in Power Generation Market Revenue (billion), by Testing Technology 2025 & 2033
- Figure 29: Middle East and Africa NDT in Power Generation Market Revenue Share (%), by Testing Technology 2025 & 2033
- Figure 30: Middle East and Africa NDT in Power Generation Market Revenue (billion), by Country 2025 & 2033
- Figure 31: Middle East and Africa NDT in Power Generation Market Revenue Share (%), by Country 2025 & 2033
List of Tables
- Table 1: Global NDT in Power Generation Market Revenue billion Forecast, by Type 2020 & 2033
- Table 2: Global NDT in Power Generation Market Revenue billion Forecast, by Testing Technology 2020 & 2033
- Table 3: Global NDT in Power Generation Market Revenue billion Forecast, by Region 2020 & 2033
- Table 4: Global NDT in Power Generation Market Revenue billion Forecast, by Type 2020 & 2033
- Table 5: Global NDT in Power Generation Market Revenue billion Forecast, by Testing Technology 2020 & 2033
- Table 6: Global NDT in Power Generation Market Revenue billion Forecast, by Country 2020 & 2033
- Table 7: United States NDT in Power Generation Market Revenue (billion) Forecast, by Application 2020 & 2033
- Table 8: Canada NDT in Power Generation Market Revenue (billion) Forecast, by Application 2020 & 2033
- Table 9: Global NDT in Power Generation Market Revenue billion Forecast, by Type 2020 & 2033
- Table 10: Global NDT in Power Generation Market Revenue billion Forecast, by Testing Technology 2020 & 2033
- Table 11: Global NDT in Power Generation Market Revenue billion Forecast, by Country 2020 & 2033
- Table 12: United Kingdom NDT in Power Generation Market Revenue (billion) Forecast, by Application 2020 & 2033
- Table 13: Germany NDT in Power Generation Market Revenue (billion) Forecast, by Application 2020 & 2033
- Table 14: France NDT in Power Generation Market Revenue (billion) Forecast, by Application 2020 & 2033
- Table 15: Rest of Europe NDT in Power Generation Market Revenue (billion) Forecast, by Application 2020 & 2033
- Table 16: Global NDT in Power Generation Market Revenue billion Forecast, by Type 2020 & 2033
- Table 17: Global NDT in Power Generation Market Revenue billion Forecast, by Testing Technology 2020 & 2033
- Table 18: Global NDT in Power Generation Market Revenue billion Forecast, by Country 2020 & 2033
- Table 19: China NDT in Power Generation Market Revenue (billion) Forecast, by Application 2020 & 2033
- Table 20: Japan NDT in Power Generation Market Revenue (billion) Forecast, by Application 2020 & 2033
- Table 21: India NDT in Power Generation Market Revenue (billion) Forecast, by Application 2020 & 2033
- Table 22: Rest of Asia Pacific NDT in Power Generation Market Revenue (billion) Forecast, by Application 2020 & 2033
- Table 23: Global NDT in Power Generation Market Revenue billion Forecast, by Type 2020 & 2033
- Table 24: Global NDT in Power Generation Market Revenue billion Forecast, by Testing Technology 2020 & 2033
- Table 25: Global NDT in Power Generation Market Revenue billion Forecast, by Country 2020 & 2033
- Table 26: Global NDT in Power Generation Market Revenue billion Forecast, by Type 2020 & 2033
- Table 27: Global NDT in Power Generation Market Revenue billion Forecast, by Testing Technology 2020 & 2033
- Table 28: Global NDT in Power Generation Market Revenue billion Forecast, by Country 2020 & 2033
Frequently Asked Questions
1. What is the projected Compound Annual Growth Rate (CAGR) of the NDT in Power Generation Market?
The projected CAGR is approximately 6.24%.
2. Which companies are prominent players in the NDT in Power Generation Market?
Key companies in the market include Yxlon International Gmbh (Comet Holding AG), Intertek Group Plc, Eddyfi, SGS Group, Bureau Veritas S A, Fujifilm Corporation, Mistras Group Inc, Zetec Inc, Applus+ Services Technologies S L, Baker Hughes Company, Team Inc *List Not Exhaustive, Olympus Corporation.
3. What are the main segments of the NDT in Power Generation Market?
The market segments include Type, Testing Technology.
4. Can you provide details about the market size?
The market size is estimated to be USD 4.18 billion as of 2022.
5. What are some drivers contributing to market growth?
Stringent Regulations Mandating Safety Standards; Increase in Demand for Flaw Detection to Reduce Repair Cost; Aging Infrastructure and Increasing Need for Maintenance.
6. What are the notable trends driving market growth?
Visual Inspection Testing is Expected to Witness a Significant Growth.
7. Are there any restraints impacting market growth?
Lack of Skilled Workforce and Training Regulations.
8. Can you provide examples of recent developments in the market?
June 2022 - ALEIA, a startup specializing in AI, and Omexom NDT Engineering & Services, in collaboration with the Laboratoire d'Acoustique de l'Université du Mans (LAUM) UMR CNRS, have announced the deployment of the AUTEND project. The project is aimed to accelerate the inspection of nuclear power plants through AI. Moreover, the project is presently focusing on Non-Destructive Testing, which is an inspection process for nuclear infrastructures using eddy current or ultrasonic testing methods.
9. What pricing options are available for accessing the report?
Pricing options include single-user, multi-user, and enterprise licenses priced at USD 4750, USD 5250, and USD 8750 respectively.
10. Is the market size provided in terms of value or volume?
The market size is provided in terms of value, measured in billion.
11. Are there any specific market keywords associated with the report?
Yes, the market keyword associated with the report is "NDT in Power Generation Market," which aids in identifying and referencing the specific market segment covered.
12. How do I determine which pricing option suits my needs best?
The pricing options vary based on user requirements and access needs. Individual users may opt for single-user licenses, while businesses requiring broader access may choose multi-user or enterprise licenses for cost-effective access to the report.
13. Are there any additional resources or data provided in the NDT in Power Generation Market report?
While the report offers comprehensive insights, it's advisable to review the specific contents or supplementary materials provided to ascertain if additional resources or data are available.
14. How can I stay updated on further developments or reports in the NDT in Power Generation Market?
To stay informed about further developments, trends, and reports in the NDT in Power Generation Market, consider subscribing to industry newsletters, following relevant companies and organizations, or regularly checking reputable industry news sources and publications.
Methodology
Step 1 - Identification of Relevant Samples Size from Population Database


Step 2 - Approaches for Defining Global Market Size (Value, Volume* & Price*)

Note*: In applicable scenarios
Step 3 - Data Sources
Primary Research
- Web Analytics
- Survey Reports
- Research Institute
- Latest Research Reports
- Opinion Leaders
Secondary Research
- Annual Reports
- White Paper
- Latest Press Release
- Industry Association
- Paid Database
- Investor Presentations

Step 4 - Data Triangulation
Involves using different sources of information in order to increase the validity of a study
These sources are likely to be stakeholders in a program - participants, other researchers, program staff, other community members, and so on.
Then we put all data in single framework & apply various statistical tools to find out the dynamic on the market.
During the analysis stage, feedback from the stakeholder groups would be compared to determine areas of agreement as well as areas of divergence