

Key Insights
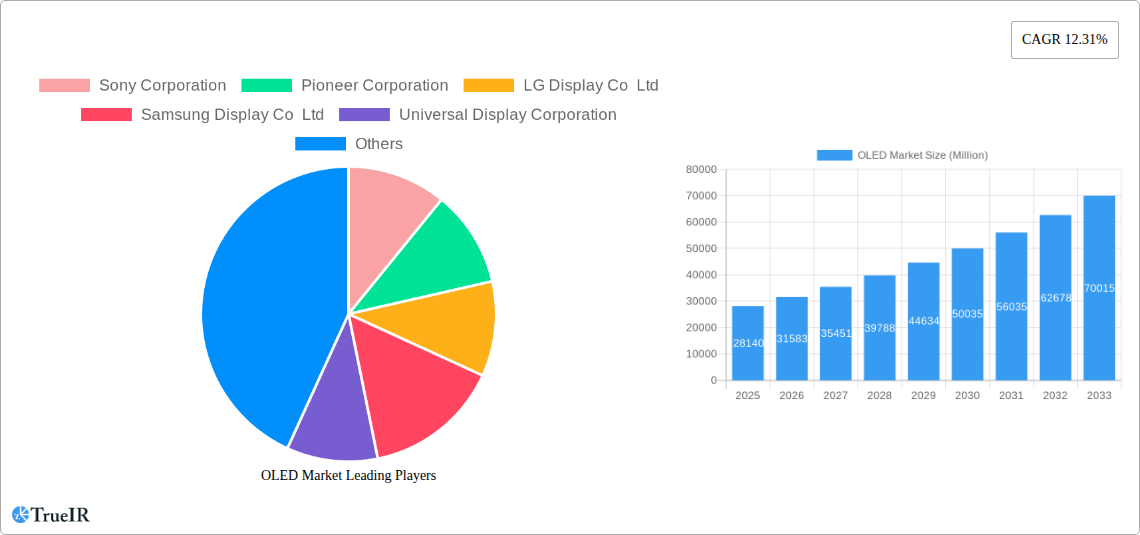
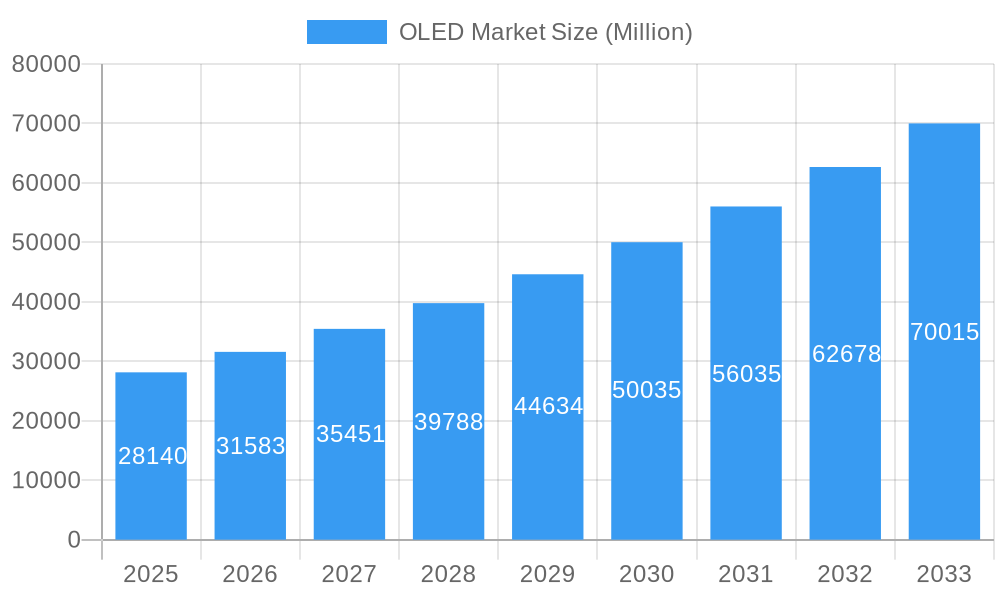
The global OLED market is experiencing robust expansion, projected to reach approximately $28.14 billion in 2025 with a compelling Compound Annual Growth Rate (CAGR) of 12.31% through 2033. This impressive growth trajectory is fueled by a confluence of key drivers, primarily the escalating demand for superior display technologies that offer enhanced color accuracy, deeper blacks, and exceptional energy efficiency. The ubiquitous adoption of OLED in premium smartphones and televisions, coupled with its emerging presence in wearables, automotive displays, and advanced digital signage, significantly propels market penetration. Furthermore, advancements in OLED material science and manufacturing processes are leading to more cost-effective production and the development of innovative form factors, such as flexible and transparent displays, further stimulating consumer and industrial adoption. The increasing investment in research and development by leading players like Samsung Display, LG Display, and Universal Display Corporation is instrumental in pushing the boundaries of OLED capabilities, opening new application frontiers and solidifying its position as a dominant display technology.
OLED Market Market Size (In Billion)
The market's dynamism is further shaped by evolving trends and a few persistent restraints. The shift towards higher resolution and larger screen sizes across consumer electronics, particularly in smartphones, tablets, and televisions, directly translates into higher demand for OLED panels. The integration of OLED into automotive interiors, offering customizable ambient lighting and advanced infotainment systems, represents a significant growth avenue. Emerging applications in augmented reality (AR) and virtual reality (VR) headsets, where OLED's superior contrast ratios and fast response times are crucial for immersive experiences, also contribute to the positive outlook. However, challenges such as the relatively higher manufacturing costs compared to traditional LCD technologies, particularly for large-format displays, and concerns regarding pixel burn-in for static images, though diminishing with technological improvements, remain factors that manufacturers are actively addressing. Nonetheless, the inherent advantages of OLED in terms of picture quality, power efficiency, and design flexibility are expected to continue driving its market dominance and innovation in the coming years.
OLED Market Company Market Share
Unveiling the Future of Visuals: Dynamic OLED Market Report 2019-2033
This comprehensive report delves deep into the rapidly evolving OLED market, exploring its profound impact across display and lighting applications. Leveraging extensive data from the historical period (2019-2024), the base year (2025), and an extended forecast period (2025-2033), this analysis provides unparalleled insights for industry stakeholders. We meticulously examine market dynamics, pinpointing key growth drivers, emerging opportunities, and significant challenges. Discover how OLED technology is revolutionizing everything from mobile and tablet displays to automotive applications and advanced lighting solutions. Our report equips you with the strategic intelligence needed to navigate this burgeoning market.
OLED Market Market Structure & Competitive Landscape
The OLED market exhibits a dynamic and evolving structure, characterized by significant innovation and strategic collaborations. Market concentration is moderately high, driven by the substantial R&D investment and manufacturing expertise required for OLED production. Key players like Samsung Display Co Ltd and LG Display Co Ltd hold considerable market share, but the landscape is constantly being reshaped by advancements from specialized firms such as Universal Display Corporation and emerging Chinese manufacturers. Innovation drivers are multifaceted, encompassing material science breakthroughs, process optimization for higher yields, and the development of novel form factors like flexible OLED and transparent OLED. Regulatory impacts are becoming increasingly significant, particularly concerning environmental standards and intellectual property protection. Product substitutes, while present in the form of LCD and microLED, are steadily losing ground to OLED's superior contrast ratios, faster response times, and energy efficiency. End-user segmentation reveals strong growth in consumer electronics, with significant inroads being made into the automotive displays and smartwatches & wearables sectors. Mergers & Acquisitions (M&A) trends are indicative of consolidation efforts and strategic partnerships aimed at securing intellectual property and expanding manufacturing capabilities, with an estimated 15-20 M&A activities observed within the historical period. The competitive intensity is projected to remain high, fueled by ongoing technological advancements and the pursuit of market dominance in premium product segments.
OLED Market Market Trends & Opportunities
The OLED market is on an upward trajectory, projected to witness substantial growth, with market size estimated to reach USD 150 Billion by 2025 and expand further to USD 250 Billion by 2033. This impressive expansion is underpinned by a Compound Annual Growth Rate (CAGR) of approximately 8.5% from 2025 to 2033. A significant trend is the increasing adoption of Active Matrix OLED (AMOLED) technology, which offers superior performance and power efficiency, making it the preferred choice for high-end devices. The burgeoning demand for immersive visual experiences in smartphones, televisions, and gaming consoles is a primary growth catalyst. Furthermore, the penetration rate of OLED displays in the premium smartphone segment has surpassed 60% and is expected to continue its ascent. The evolving consumer preference for thinner, lighter, and more flexible electronic devices is driving the demand for flexible OLED displays, opening up new design possibilities in wearables and foldable devices. The automotive industry represents a burgeoning opportunity, with the integration of OLED technology in dashboards, infotainment systems, and ambient lighting enhancing vehicle aesthetics and functionality. The development of more energy-efficient OLED materials and manufacturing processes is also a key trend, addressing environmental concerns and reducing operational costs. The competitive dynamics are intensifying, with established players investing heavily in R&D to maintain their technological edge and new entrants vying for market share through cost-effective solutions and innovative product offerings. The increasing integration of OLEDs in medical devices, industrial displays, and augmented reality (AR)/virtual reality (VR) headsets further diversifies market opportunities. The overall market outlook is exceptionally positive, driven by continuous technological advancements and expanding application areas.
Dominant Markets & Segments in OLED Market
The OLED market is witnessing dominance across several key regions and segments. Geographically, Asia Pacific continues to lead the market, driven by the presence of major display manufacturers and a robust consumer electronics ecosystem. Within this region, South Korea and China are pivotal countries, accounting for over 60% of global OLED panel production.
Product Type:
- Display: This segment unequivocally dominates the OLED market, comprising approximately 95% of the total market revenue. The insatiable demand for superior visual quality in consumer electronics fuels this segment's leadership.
- Lighting: While currently a smaller segment, OLED lighting is poised for significant growth, especially in architectural lighting, automotive interior lighting, and specialized applications. Its ability to provide diffuse, glare-free illumination and its design flexibility are key advantages.
Technology:
- Active Matrix OLED (AMOLED): This technology is the undisputed leader, accounting for over 90% of the market. Its pixel-level control, faster refresh rates, and energy efficiency make it indispensable for high-performance displays.
- Passive Matrix OLED (PMOLED): This technology is primarily used in simpler displays like status indicators and control panels, where cost-effectiveness and basic functionality are prioritized. Its market share is considerably smaller compared to AMOLED.
Type:
- Flexible OLED: This segment is experiencing the most rapid growth, driven by the popularity of foldable smartphones and the potential for innovative form factors in wearables and other devices. Its market share is projected to expand significantly.
- Rigid OLED: Currently holding the largest share, rigid OLEDs are prevalent in smartphones, televisions, and monitors. However, the growth rate is expected to be outpaced by flexible OLEDs.
- Transparent OLED: This niche segment offers unique design possibilities for applications like smart windows, digital signage, and head-up displays. Its market share is expected to grow steadily as applications mature.
Application:
- Mobile and Tablet: This remains the largest application segment, consuming the majority of OLED displays produced globally. The continuous upgrade cycles and demand for premium mobile devices ensure its continued dominance.
- Television: OLED televisions have carved out a significant market share in the premium TV segment, lauded for their unparalleled picture quality. Growth in this segment is driven by increasing consumer awareness and falling prices for OLED TVs.
- Automotive Displays: This is a rapidly expanding application, with OLEDs being integrated into dashboards, instrument clusters, and infotainment systems. Growth is fueled by the demand for enhanced in-car user experiences and sophisticated interior designs.
- Smartwatches & Wearables: The compact size, power efficiency, and vibrant displays of OLEDs make them ideal for smartwatches and other wearable devices.
- Digital Signage/Large Format Display: Transparent and flexible OLEDs are opening new avenues in the dynamic digital signage market, offering eye-catching and interactive displays.
- PC Monitors and Laptops: While adoption is slower than in mobile, OLED is gaining traction in high-end laptops and monitors, offering superior color accuracy and contrast for professional and gaming applications.
OLED Market Product Analysis
OLED technology is defined by its self-emissive pixels, delivering unparalleled contrast ratios, true blacks, and vibrant color reproduction. Key product innovations focus on enhancing energy efficiency through advanced materials and optimizing manufacturing processes for higher yields and reduced costs. The competitive advantages lie in the inherent superiority of OLED displays, offering thinner form factors, faster response times, and wider viewing angles compared to traditional LCD technology. Applications are rapidly expanding beyond traditional mobile and television screens to include flexible displays for foldable devices, transparent displays for innovative signage and automotive applications, and emissive lighting solutions for architectural and design purposes.
Key Drivers, Barriers & Challenges in OLED Market
Key Drivers:
- Superior Visual Performance: Unmatched contrast ratios, true blacks, and vibrant colors are primary drivers, appealing to consumers seeking premium display experiences.
- Technological Advancements: Continuous improvements in material science, manufacturing efficiency, and form factors (flexible, transparent) are expanding application possibilities.
- Growing Demand in Key Applications: The robust market for smartphones, televisions, and the emerging automotive display sector are significant growth catalysts.
- Energy Efficiency: Advancements in OLED technology are leading to improved power consumption, making them attractive for portable devices and sustainable lighting.
Barriers & Challenges:
- High Manufacturing Costs: The complex manufacturing processes and specialized materials contribute to higher production costs compared to LCD, particularly for large-format displays.
- Burn-in and Lifespan Concerns: While significantly improved, the potential for image retention (burn-in) and finite lifespan remain concerns for some high-usage applications, though industry efforts are addressing these.
- Supply Chain Dependencies: Reliance on specific raw materials and manufacturing equipment can create supply chain vulnerabilities and price fluctuations.
- Intense Competition: The market is highly competitive, with established players and emerging manufacturers striving for market share, leading to price pressures.
Growth Drivers in the OLED Market Market
The OLED market is propelled by several powerful growth drivers. Technologically, breakthroughs in material science are leading to more efficient, longer-lasting, and cost-effective OLED materials, enabling wider adoption. The increasing demand for immersive and premium visual experiences across consumer electronics, from smartphones to high-end televisions, directly fuels market expansion. Economically, the decreasing cost of manufacturing, driven by economies of scale and process optimizations, is making OLEDs more accessible to a broader consumer base. Policy-driven factors, such as government initiatives supporting advanced display technologies and smart manufacturing, also contribute to market growth. The automotive industry's adoption of OLEDs for advanced infotainment and dashboard displays represents a significant growth avenue, driven by vehicle electrification and the demand for sophisticated in-car user interfaces.
Challenges Impacting OLED Market Growth
Several challenges continue to impact the growth of the OLED market. Regulatory complexities, particularly concerning the sourcing of rare earth materials and environmental compliance in manufacturing, can pose hurdles. Supply chain issues, including the availability and price volatility of key raw materials like rare organic compounds, can disrupt production and impact profitability. Competitive pressures from alternative display technologies, such as microLED and advanced LCD variants, remain a significant factor, especially in price-sensitive market segments. Furthermore, addressing end-user concerns regarding OLED longevity and burn-in, although largely mitigated by advancements, requires continuous education and reassurance. The significant capital investment required for establishing advanced OLED manufacturing facilities also acts as a barrier to entry for smaller players.
Key Players Shaping the OLED Market Market
- Sony Corporation
- Pioneer Corporation
- LG Display Co Ltd
- Samsung Display Co Ltd
- Universal Display Corporation
- OLEDWorks LLC
- TDK Corporation
- OSRAM OLED GmbH
- Winstar Display Co Ltd
- Visionox Co Ltd
- Raystar Optronics Inc
- Ritek Corporation
- WiseChip Semiconductor Inc
- Hella GmbH & KGaA
- Yeolight Technology
- Acuity Brands Inc
- Kopin Corporation
- Pixelligent Technologies
- BOE Technology
- Tianma Microelectronics
Significant OLED Market Industry Milestones
- February 2024: Samsung Display presented robust foldable panels and introduced Flex Magic Pixel OLED technology, which collaborates with AI-enabled smart devices to enhance security measures. The artwork 'Mr. OLEDboy,' created by the esteemed London-based fashion illustrator Mr. Slowboy, imagines the future shaped by OLED technology.
- January 2024: Apple announced the introduction of a new midrange iPhone model. According to a report, the forthcoming iPhone SE 4, which represents the fourth generation of the 'Special Edition' iPhone, is anticipated to include an OLED display produced by a Chinese manufacturer.
Future Outlook for OLED Market Market
The future outlook for the OLED market is exceptionally bright, poised for continued and accelerated growth. Strategic opportunities lie in the expanding application landscape, particularly in the automotive sector, medical devices, and augmented/virtual reality. Continued advancements in material science and manufacturing efficiency will further reduce costs and enhance performance, making OLED technology more accessible and competitive across a wider range of products. The growing consumer demand for superior visual experiences, combined with the inherent design flexibility of OLEDs, will drive innovation in form factors and functionalities. Emerging markets and the increasing adoption of smart devices globally are expected to provide sustained demand. The development of micro-OLED technology is also set to unlock new possibilities in high-resolution displays for wearables and AR/VR devices, further solidifying OLED's position as a leading display technology. The market potential is immense, with ongoing research and development promising even more transformative applications in the coming years.
OLED Market Segmentation
-
1. Product Type
- 1.1. Display
- 1.2. Lighting
-
2. Technology
- 2.1. Passive Matrix OLED (PMOLED)
- 2.2. Active Matrix OLED (AMOLED)
-
3. Type
- 3.1. Flexible
- 3.2. Rigid
- 3.3. Transparent
-
4. Application
- 4.1. Mobile and Tablet
- 4.2. Television
- 4.3. Automotive Displays
- 4.4. Smartwatches & Wearables
- 4.5. Digital Signage/Large Format Display
- 4.6. PC Monitors and Laptops
- 4.7. Other Applications
OLED Market Segmentation By Geography
- 1. North America
- 2. Europe
- 3. Asia
- 4. Australia and New Zealand
- 5. Latin America
- 6. Middle East and Africa
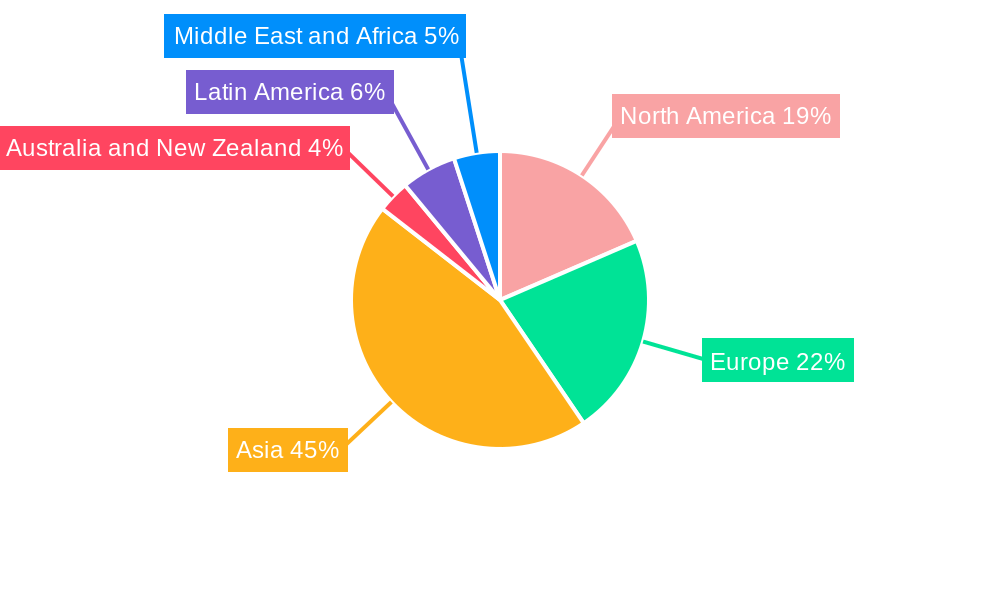
OLED Market Regional Market Share
Geographic Coverage of OLED Market
OLED Market REPORT HIGHLIGHTS
| Aspects | Details |
|---|---|
| Study Period | 2020-2034 |
| Base Year | 2025 |
| Estimated Year | 2026 |
| Forecast Period | 2026-2034 |
| Historical Period | 2020-2025 |
| Growth Rate | CAGR of 12.31% from 2020-2034 |
| Segmentation |
|
Table of Contents
- 1. Introduction
- 1.1. Research Scope
- 1.2. Market Segmentation
- 1.3. Research Objective
- 1.4. Definitions and Assumptions
- 2. Executive Summary
- 2.1. Market Snapshot
- 3. Market Dynamics
- 3.1. Market Drivers
- 3.2. Market Restrains
- 3.3. Market Trends
- 3.4. Market Opportunities
- 4. Market Factor Analysis
- 4.1. Porters Five Forces
- 4.1.1. Bargaining Power of Suppliers
- 4.1.2. Bargaining Power of Buyers
- 4.1.3. Threat of New Entrants
- 4.1.4. Threat of Substitutes
- 4.1.5. Competitive Rivalry
- 4.2. PESTEL analysis
- 4.3. BCG Analysis
- 4.3.1. Stars (High Growth, High Market Share)
- 4.3.2. Cash Cows (Low Growth, High Market Share)
- 4.3.3. Question Mark (High Growth, Low Market Share)
- 4.3.4. Dogs (Low Growth, Low Market Share)
- 4.4. Ansoff Matrix Analysis
- 4.5. Supply Chain Analysis
- 4.6. Regulatory Landscape
- 4.7. Current Market Potential and Opportunity Assessment (TAM–SAM–SOM Framework)
- 4.8. TIR Analyst Note
- 4.1. Porters Five Forces
- 5. Market Analysis, Insights and Forecast 2021-2033
- 5.1. Market Analysis, Insights and Forecast - by Product Type
- 5.1.1. Display
- 5.1.2. Lighting
- 5.2. Market Analysis, Insights and Forecast - by Technology
- 5.2.1. Passive Matrix OLED (PMOLED)
- 5.2.2. Active Matrix OLED (AMOLED)
- 5.3. Market Analysis, Insights and Forecast - by Type
- 5.3.1. Flexible
- 5.3.2. Rigid
- 5.3.3. Transparent
- 5.4. Market Analysis, Insights and Forecast - by Application
- 5.4.1. Mobile and Tablet
- 5.4.2. Television
- 5.4.3. Automotive Displays
- 5.4.4. Smartwatches & Wearables
- 5.4.5. Digital Signage/Large Format Display
- 5.4.6. PC Monitors and Laptops
- 5.4.7. Other Applications
- 5.5. Market Analysis, Insights and Forecast - by Region
- 5.5.1. North America
- 5.5.2. Europe
- 5.5.3. Asia
- 5.5.4. Australia and New Zealand
- 5.5.5. Latin America
- 5.5.6. Middle East and Africa
- 5.1. Market Analysis, Insights and Forecast - by Product Type
- 6. Global OLED Market Analysis, Insights and Forecast, 2021-2033
- 6.1. Market Analysis, Insights and Forecast - by Product Type
- 6.1.1. Display
- 6.1.2. Lighting
- 6.2. Market Analysis, Insights and Forecast - by Technology
- 6.2.1. Passive Matrix OLED (PMOLED)
- 6.2.2. Active Matrix OLED (AMOLED)
- 6.3. Market Analysis, Insights and Forecast - by Type
- 6.3.1. Flexible
- 6.3.2. Rigid
- 6.3.3. Transparent
- 6.4. Market Analysis, Insights and Forecast - by Application
- 6.4.1. Mobile and Tablet
- 6.4.2. Television
- 6.4.3. Automotive Displays
- 6.4.4. Smartwatches & Wearables
- 6.4.5. Digital Signage/Large Format Display
- 6.4.6. PC Monitors and Laptops
- 6.4.7. Other Applications
- 6.1. Market Analysis, Insights and Forecast - by Product Type
- 7. North America OLED Market Analysis, Insights and Forecast, 2020-2032
- 7.1. Market Analysis, Insights and Forecast - by Product Type
- 7.1.1. Display
- 7.1.2. Lighting
- 7.2. Market Analysis, Insights and Forecast - by Technology
- 7.2.1. Passive Matrix OLED (PMOLED)
- 7.2.2. Active Matrix OLED (AMOLED)
- 7.3. Market Analysis, Insights and Forecast - by Type
- 7.3.1. Flexible
- 7.3.2. Rigid
- 7.3.3. Transparent
- 7.4. Market Analysis, Insights and Forecast - by Application
- 7.4.1. Mobile and Tablet
- 7.4.2. Television
- 7.4.3. Automotive Displays
- 7.4.4. Smartwatches & Wearables
- 7.4.5. Digital Signage/Large Format Display
- 7.4.6. PC Monitors and Laptops
- 7.4.7. Other Applications
- 7.1. Market Analysis, Insights and Forecast - by Product Type
- 8. Europe OLED Market Analysis, Insights and Forecast, 2020-2032
- 8.1. Market Analysis, Insights and Forecast - by Product Type
- 8.1.1. Display
- 8.1.2. Lighting
- 8.2. Market Analysis, Insights and Forecast - by Technology
- 8.2.1. Passive Matrix OLED (PMOLED)
- 8.2.2. Active Matrix OLED (AMOLED)
- 8.3. Market Analysis, Insights and Forecast - by Type
- 8.3.1. Flexible
- 8.3.2. Rigid
- 8.3.3. Transparent
- 8.4. Market Analysis, Insights and Forecast - by Application
- 8.4.1. Mobile and Tablet
- 8.4.2. Television
- 8.4.3. Automotive Displays
- 8.4.4. Smartwatches & Wearables
- 8.4.5. Digital Signage/Large Format Display
- 8.4.6. PC Monitors and Laptops
- 8.4.7. Other Applications
- 8.1. Market Analysis, Insights and Forecast - by Product Type
- 9. Asia OLED Market Analysis, Insights and Forecast, 2020-2032
- 9.1. Market Analysis, Insights and Forecast - by Product Type
- 9.1.1. Display
- 9.1.2. Lighting
- 9.2. Market Analysis, Insights and Forecast - by Technology
- 9.2.1. Passive Matrix OLED (PMOLED)
- 9.2.2. Active Matrix OLED (AMOLED)
- 9.3. Market Analysis, Insights and Forecast - by Type
- 9.3.1. Flexible
- 9.3.2. Rigid
- 9.3.3. Transparent
- 9.4. Market Analysis, Insights and Forecast - by Application
- 9.4.1. Mobile and Tablet
- 9.4.2. Television
- 9.4.3. Automotive Displays
- 9.4.4. Smartwatches & Wearables
- 9.4.5. Digital Signage/Large Format Display
- 9.4.6. PC Monitors and Laptops
- 9.4.7. Other Applications
- 9.1. Market Analysis, Insights and Forecast - by Product Type
- 10. Australia and New Zealand OLED Market Analysis, Insights and Forecast, 2020-2032
- 10.1. Market Analysis, Insights and Forecast - by Product Type
- 10.1.1. Display
- 10.1.2. Lighting
- 10.2. Market Analysis, Insights and Forecast - by Technology
- 10.2.1. Passive Matrix OLED (PMOLED)
- 10.2.2. Active Matrix OLED (AMOLED)
- 10.3. Market Analysis, Insights and Forecast - by Type
- 10.3.1. Flexible
- 10.3.2. Rigid
- 10.3.3. Transparent
- 10.4. Market Analysis, Insights and Forecast - by Application
- 10.4.1. Mobile and Tablet
- 10.4.2. Television
- 10.4.3. Automotive Displays
- 10.4.4. Smartwatches & Wearables
- 10.4.5. Digital Signage/Large Format Display
- 10.4.6. PC Monitors and Laptops
- 10.4.7. Other Applications
- 10.1. Market Analysis, Insights and Forecast - by Product Type
- 11. Latin America OLED Market Analysis, Insights and Forecast, 2020-2032
- 11.1. Market Analysis, Insights and Forecast - by Product Type
- 11.1.1. Display
- 11.1.2. Lighting
- 11.2. Market Analysis, Insights and Forecast - by Technology
- 11.2.1. Passive Matrix OLED (PMOLED)
- 11.2.2. Active Matrix OLED (AMOLED)
- 11.3. Market Analysis, Insights and Forecast - by Type
- 11.3.1. Flexible
- 11.3.2. Rigid
- 11.3.3. Transparent
- 11.4. Market Analysis, Insights and Forecast - by Application
- 11.4.1. Mobile and Tablet
- 11.4.2. Television
- 11.4.3. Automotive Displays
- 11.4.4. Smartwatches & Wearables
- 11.4.5. Digital Signage/Large Format Display
- 11.4.6. PC Monitors and Laptops
- 11.4.7. Other Applications
- 11.1. Market Analysis, Insights and Forecast - by Product Type
- 12. Middle East and Africa OLED Market Analysis, Insights and Forecast, 2020-2032
- 12.1. Market Analysis, Insights and Forecast - by Product Type
- 12.1.1. Display
- 12.1.2. Lighting
- 12.2. Market Analysis, Insights and Forecast - by Technology
- 12.2.1. Passive Matrix OLED (PMOLED)
- 12.2.2. Active Matrix OLED (AMOLED)
- 12.3. Market Analysis, Insights and Forecast - by Type
- 12.3.1. Flexible
- 12.3.2. Rigid
- 12.3.3. Transparent
- 12.4. Market Analysis, Insights and Forecast - by Application
- 12.4.1. Mobile and Tablet
- 12.4.2. Television
- 12.4.3. Automotive Displays
- 12.4.4. Smartwatches & Wearables
- 12.4.5. Digital Signage/Large Format Display
- 12.4.6. PC Monitors and Laptops
- 12.4.7. Other Applications
- 12.1. Market Analysis, Insights and Forecast - by Product Type
- 13. Competitive Analysis
- 13.1. Company Profiles
- 13.1.1 Sony Corporation
- 13.1.1.1. Company Overview
- 13.1.1.2. Products
- 13.1.1.3. Company Financials
- 13.1.1.4. SWOT Analysis
- 13.1.2 Pioneer Corporation
- 13.1.2.1. Company Overview
- 13.1.2.2. Products
- 13.1.2.3. Company Financials
- 13.1.2.4. SWOT Analysis
- 13.1.3 LG Display Co Ltd
- 13.1.3.1. Company Overview
- 13.1.3.2. Products
- 13.1.3.3. Company Financials
- 13.1.3.4. SWOT Analysis
- 13.1.4 Samsung Display Co Ltd
- 13.1.4.1. Company Overview
- 13.1.4.2. Products
- 13.1.4.3. Company Financials
- 13.1.4.4. SWOT Analysis
- 13.1.5 Universal Display Corporation
- 13.1.5.1. Company Overview
- 13.1.5.2. Products
- 13.1.5.3. Company Financials
- 13.1.5.4. SWOT Analysis
- 13.1.6 OLEDWorks LLC
- 13.1.6.1. Company Overview
- 13.1.6.2. Products
- 13.1.6.3. Company Financials
- 13.1.6.4. SWOT Analysis
- 13.1.7 TDK Corporation
- 13.1.7.1. Company Overview
- 13.1.7.2. Products
- 13.1.7.3. Company Financials
- 13.1.7.4. SWOT Analysis
- 13.1.8 OSRAM OLED GmbH
- 13.1.8.1. Company Overview
- 13.1.8.2. Products
- 13.1.8.3. Company Financials
- 13.1.8.4. SWOT Analysis
- 13.1.9 Winstar Display Co Ltd
- 13.1.9.1. Company Overview
- 13.1.9.2. Products
- 13.1.9.3. Company Financials
- 13.1.9.4. SWOT Analysis
- 13.1.10 Visionox Co Ltd
- 13.1.10.1. Company Overview
- 13.1.10.2. Products
- 13.1.10.3. Company Financials
- 13.1.10.4. SWOT Analysis
- 13.1.11 Raystar Optronics Inc
- 13.1.11.1. Company Overview
- 13.1.11.2. Products
- 13.1.11.3. Company Financials
- 13.1.11.4. SWOT Analysis
- 13.1.12 Ritek Corporation
- 13.1.12.1. Company Overview
- 13.1.12.2. Products
- 13.1.12.3. Company Financials
- 13.1.12.4. SWOT Analysis
- 13.1.13 WiseChip Semiconductor Inc
- 13.1.13.1. Company Overview
- 13.1.13.2. Products
- 13.1.13.3. Company Financials
- 13.1.13.4. SWOT Analysis
- 13.1.14 Hella GmbH & KGaA
- 13.1.14.1. Company Overview
- 13.1.14.2. Products
- 13.1.14.3. Company Financials
- 13.1.14.4. SWOT Analysis
- 13.1.15 Yeolight Technology
- 13.1.15.1. Company Overview
- 13.1.15.2. Products
- 13.1.15.3. Company Financials
- 13.1.15.4. SWOT Analysis
- 13.1.16 Acuity Brands Inc
- 13.1.16.1. Company Overview
- 13.1.16.2. Products
- 13.1.16.3. Company Financials
- 13.1.16.4. SWOT Analysis
- 13.1.17 Kopin Corporation
- 13.1.17.1. Company Overview
- 13.1.17.2. Products
- 13.1.17.3. Company Financials
- 13.1.17.4. SWOT Analysis
- 13.1.18 Pixelligent Technologies
- 13.1.18.1. Company Overview
- 13.1.18.2. Products
- 13.1.18.3. Company Financials
- 13.1.18.4. SWOT Analysis
- 13.1.19 BOE Technology
- 13.1.19.1. Company Overview
- 13.1.19.2. Products
- 13.1.19.3. Company Financials
- 13.1.19.4. SWOT Analysis
- 13.1.20 Tianma Microelectronics*List Not Exhaustive
- 13.1.20.1. Company Overview
- 13.1.20.2. Products
- 13.1.20.3. Company Financials
- 13.1.20.4. SWOT Analysis
- 13.1.1 Sony Corporation
- 13.2. Market Entropy
- 13.2.1 Company's Key Areas Served
- 13.2.2 Recent Developments
- 13.3. Company Market Share Analysis 2025
- 13.3.1 Top 5 Companies Market Share Analysis
- 13.3.2 Top 3 Companies Market Share Analysis
- 13.4. List of Potential Customers
- 14. Research Methodology
List of Figures
- Figure 1: Global OLED Market Revenue Breakdown (Million, %) by Region 2025 & 2033
- Figure 2: Global OLED Market Volume Breakdown (Billion, %) by Region 2025 & 2033
- Figure 3: North America OLED Market Revenue (Million), by Product Type 2025 & 2033
- Figure 4: North America OLED Market Volume (Billion), by Product Type 2025 & 2033
- Figure 5: North America OLED Market Revenue Share (%), by Product Type 2025 & 2033
- Figure 6: North America OLED Market Volume Share (%), by Product Type 2025 & 2033
- Figure 7: North America OLED Market Revenue (Million), by Technology 2025 & 2033
- Figure 8: North America OLED Market Volume (Billion), by Technology 2025 & 2033
- Figure 9: North America OLED Market Revenue Share (%), by Technology 2025 & 2033
- Figure 10: North America OLED Market Volume Share (%), by Technology 2025 & 2033
- Figure 11: North America OLED Market Revenue (Million), by Type 2025 & 2033
- Figure 12: North America OLED Market Volume (Billion), by Type 2025 & 2033
- Figure 13: North America OLED Market Revenue Share (%), by Type 2025 & 2033
- Figure 14: North America OLED Market Volume Share (%), by Type 2025 & 2033
- Figure 15: North America OLED Market Revenue (Million), by Application 2025 & 2033
- Figure 16: North America OLED Market Volume (Billion), by Application 2025 & 2033
- Figure 17: North America OLED Market Revenue Share (%), by Application 2025 & 2033
- Figure 18: North America OLED Market Volume Share (%), by Application 2025 & 2033
- Figure 19: North America OLED Market Revenue (Million), by Country 2025 & 2033
- Figure 20: North America OLED Market Volume (Billion), by Country 2025 & 2033
- Figure 21: North America OLED Market Revenue Share (%), by Country 2025 & 2033
- Figure 22: North America OLED Market Volume Share (%), by Country 2025 & 2033
- Figure 23: Europe OLED Market Revenue (Million), by Product Type 2025 & 2033
- Figure 24: Europe OLED Market Volume (Billion), by Product Type 2025 & 2033
- Figure 25: Europe OLED Market Revenue Share (%), by Product Type 2025 & 2033
- Figure 26: Europe OLED Market Volume Share (%), by Product Type 2025 & 2033
- Figure 27: Europe OLED Market Revenue (Million), by Technology 2025 & 2033
- Figure 28: Europe OLED Market Volume (Billion), by Technology 2025 & 2033
- Figure 29: Europe OLED Market Revenue Share (%), by Technology 2025 & 2033
- Figure 30: Europe OLED Market Volume Share (%), by Technology 2025 & 2033
- Figure 31: Europe OLED Market Revenue (Million), by Type 2025 & 2033
- Figure 32: Europe OLED Market Volume (Billion), by Type 2025 & 2033
- Figure 33: Europe OLED Market Revenue Share (%), by Type 2025 & 2033
- Figure 34: Europe OLED Market Volume Share (%), by Type 2025 & 2033
- Figure 35: Europe OLED Market Revenue (Million), by Application 2025 & 2033
- Figure 36: Europe OLED Market Volume (Billion), by Application 2025 & 2033
- Figure 37: Europe OLED Market Revenue Share (%), by Application 2025 & 2033
- Figure 38: Europe OLED Market Volume Share (%), by Application 2025 & 2033
- Figure 39: Europe OLED Market Revenue (Million), by Country 2025 & 2033
- Figure 40: Europe OLED Market Volume (Billion), by Country 2025 & 2033
- Figure 41: Europe OLED Market Revenue Share (%), by Country 2025 & 2033
- Figure 42: Europe OLED Market Volume Share (%), by Country 2025 & 2033
- Figure 43: Asia OLED Market Revenue (Million), by Product Type 2025 & 2033
- Figure 44: Asia OLED Market Volume (Billion), by Product Type 2025 & 2033
- Figure 45: Asia OLED Market Revenue Share (%), by Product Type 2025 & 2033
- Figure 46: Asia OLED Market Volume Share (%), by Product Type 2025 & 2033
- Figure 47: Asia OLED Market Revenue (Million), by Technology 2025 & 2033
- Figure 48: Asia OLED Market Volume (Billion), by Technology 2025 & 2033
- Figure 49: Asia OLED Market Revenue Share (%), by Technology 2025 & 2033
- Figure 50: Asia OLED Market Volume Share (%), by Technology 2025 & 2033
- Figure 51: Asia OLED Market Revenue (Million), by Type 2025 & 2033
- Figure 52: Asia OLED Market Volume (Billion), by Type 2025 & 2033
- Figure 53: Asia OLED Market Revenue Share (%), by Type 2025 & 2033
- Figure 54: Asia OLED Market Volume Share (%), by Type 2025 & 2033
- Figure 55: Asia OLED Market Revenue (Million), by Application 2025 & 2033
- Figure 56: Asia OLED Market Volume (Billion), by Application 2025 & 2033
- Figure 57: Asia OLED Market Revenue Share (%), by Application 2025 & 2033
- Figure 58: Asia OLED Market Volume Share (%), by Application 2025 & 2033
- Figure 59: Asia OLED Market Revenue (Million), by Country 2025 & 2033
- Figure 60: Asia OLED Market Volume (Billion), by Country 2025 & 2033
- Figure 61: Asia OLED Market Revenue Share (%), by Country 2025 & 2033
- Figure 62: Asia OLED Market Volume Share (%), by Country 2025 & 2033
- Figure 63: Australia and New Zealand OLED Market Revenue (Million), by Product Type 2025 & 2033
- Figure 64: Australia and New Zealand OLED Market Volume (Billion), by Product Type 2025 & 2033
- Figure 65: Australia and New Zealand OLED Market Revenue Share (%), by Product Type 2025 & 2033
- Figure 66: Australia and New Zealand OLED Market Volume Share (%), by Product Type 2025 & 2033
- Figure 67: Australia and New Zealand OLED Market Revenue (Million), by Technology 2025 & 2033
- Figure 68: Australia and New Zealand OLED Market Volume (Billion), by Technology 2025 & 2033
- Figure 69: Australia and New Zealand OLED Market Revenue Share (%), by Technology 2025 & 2033
- Figure 70: Australia and New Zealand OLED Market Volume Share (%), by Technology 2025 & 2033
- Figure 71: Australia and New Zealand OLED Market Revenue (Million), by Type 2025 & 2033
- Figure 72: Australia and New Zealand OLED Market Volume (Billion), by Type 2025 & 2033
- Figure 73: Australia and New Zealand OLED Market Revenue Share (%), by Type 2025 & 2033
- Figure 74: Australia and New Zealand OLED Market Volume Share (%), by Type 2025 & 2033
- Figure 75: Australia and New Zealand OLED Market Revenue (Million), by Application 2025 & 2033
- Figure 76: Australia and New Zealand OLED Market Volume (Billion), by Application 2025 & 2033
- Figure 77: Australia and New Zealand OLED Market Revenue Share (%), by Application 2025 & 2033
- Figure 78: Australia and New Zealand OLED Market Volume Share (%), by Application 2025 & 2033
- Figure 79: Australia and New Zealand OLED Market Revenue (Million), by Country 2025 & 2033
- Figure 80: Australia and New Zealand OLED Market Volume (Billion), by Country 2025 & 2033
- Figure 81: Australia and New Zealand OLED Market Revenue Share (%), by Country 2025 & 2033
- Figure 82: Australia and New Zealand OLED Market Volume Share (%), by Country 2025 & 2033
- Figure 83: Latin America OLED Market Revenue (Million), by Product Type 2025 & 2033
- Figure 84: Latin America OLED Market Volume (Billion), by Product Type 2025 & 2033
- Figure 85: Latin America OLED Market Revenue Share (%), by Product Type 2025 & 2033
- Figure 86: Latin America OLED Market Volume Share (%), by Product Type 2025 & 2033
- Figure 87: Latin America OLED Market Revenue (Million), by Technology 2025 & 2033
- Figure 88: Latin America OLED Market Volume (Billion), by Technology 2025 & 2033
- Figure 89: Latin America OLED Market Revenue Share (%), by Technology 2025 & 2033
- Figure 90: Latin America OLED Market Volume Share (%), by Technology 2025 & 2033
- Figure 91: Latin America OLED Market Revenue (Million), by Type 2025 & 2033
- Figure 92: Latin America OLED Market Volume (Billion), by Type 2025 & 2033
- Figure 93: Latin America OLED Market Revenue Share (%), by Type 2025 & 2033
- Figure 94: Latin America OLED Market Volume Share (%), by Type 2025 & 2033
- Figure 95: Latin America OLED Market Revenue (Million), by Application 2025 & 2033
- Figure 96: Latin America OLED Market Volume (Billion), by Application 2025 & 2033
- Figure 97: Latin America OLED Market Revenue Share (%), by Application 2025 & 2033
- Figure 98: Latin America OLED Market Volume Share (%), by Application 2025 & 2033
- Figure 99: Latin America OLED Market Revenue (Million), by Country 2025 & 2033
- Figure 100: Latin America OLED Market Volume (Billion), by Country 2025 & 2033
- Figure 101: Latin America OLED Market Revenue Share (%), by Country 2025 & 2033
- Figure 102: Latin America OLED Market Volume Share (%), by Country 2025 & 2033
- Figure 103: Middle East and Africa OLED Market Revenue (Million), by Product Type 2025 & 2033
- Figure 104: Middle East and Africa OLED Market Volume (Billion), by Product Type 2025 & 2033
- Figure 105: Middle East and Africa OLED Market Revenue Share (%), by Product Type 2025 & 2033
- Figure 106: Middle East and Africa OLED Market Volume Share (%), by Product Type 2025 & 2033
- Figure 107: Middle East and Africa OLED Market Revenue (Million), by Technology 2025 & 2033
- Figure 108: Middle East and Africa OLED Market Volume (Billion), by Technology 2025 & 2033
- Figure 109: Middle East and Africa OLED Market Revenue Share (%), by Technology 2025 & 2033
- Figure 110: Middle East and Africa OLED Market Volume Share (%), by Technology 2025 & 2033
- Figure 111: Middle East and Africa OLED Market Revenue (Million), by Type 2025 & 2033
- Figure 112: Middle East and Africa OLED Market Volume (Billion), by Type 2025 & 2033
- Figure 113: Middle East and Africa OLED Market Revenue Share (%), by Type 2025 & 2033
- Figure 114: Middle East and Africa OLED Market Volume Share (%), by Type 2025 & 2033
- Figure 115: Middle East and Africa OLED Market Revenue (Million), by Application 2025 & 2033
- Figure 116: Middle East and Africa OLED Market Volume (Billion), by Application 2025 & 2033
- Figure 117: Middle East and Africa OLED Market Revenue Share (%), by Application 2025 & 2033
- Figure 118: Middle East and Africa OLED Market Volume Share (%), by Application 2025 & 2033
- Figure 119: Middle East and Africa OLED Market Revenue (Million), by Country 2025 & 2033
- Figure 120: Middle East and Africa OLED Market Volume (Billion), by Country 2025 & 2033
- Figure 121: Middle East and Africa OLED Market Revenue Share (%), by Country 2025 & 2033
- Figure 122: Middle East and Africa OLED Market Volume Share (%), by Country 2025 & 2033
List of Tables
- Table 1: Global OLED Market Revenue Million Forecast, by Product Type 2020 & 2033
- Table 2: Global OLED Market Volume Billion Forecast, by Product Type 2020 & 2033
- Table 3: Global OLED Market Revenue Million Forecast, by Technology 2020 & 2033
- Table 4: Global OLED Market Volume Billion Forecast, by Technology 2020 & 2033
- Table 5: Global OLED Market Revenue Million Forecast, by Type 2020 & 2033
- Table 6: Global OLED Market Volume Billion Forecast, by Type 2020 & 2033
- Table 7: Global OLED Market Revenue Million Forecast, by Application 2020 & 2033
- Table 8: Global OLED Market Volume Billion Forecast, by Application 2020 & 2033
- Table 9: Global OLED Market Revenue Million Forecast, by Region 2020 & 2033
- Table 10: Global OLED Market Volume Billion Forecast, by Region 2020 & 2033
- Table 11: Global OLED Market Revenue Million Forecast, by Product Type 2020 & 2033
- Table 12: Global OLED Market Volume Billion Forecast, by Product Type 2020 & 2033
- Table 13: Global OLED Market Revenue Million Forecast, by Technology 2020 & 2033
- Table 14: Global OLED Market Volume Billion Forecast, by Technology 2020 & 2033
- Table 15: Global OLED Market Revenue Million Forecast, by Type 2020 & 2033
- Table 16: Global OLED Market Volume Billion Forecast, by Type 2020 & 2033
- Table 17: Global OLED Market Revenue Million Forecast, by Application 2020 & 2033
- Table 18: Global OLED Market Volume Billion Forecast, by Application 2020 & 2033
- Table 19: Global OLED Market Revenue Million Forecast, by Country 2020 & 2033
- Table 20: Global OLED Market Volume Billion Forecast, by Country 2020 & 2033
- Table 21: Global OLED Market Revenue Million Forecast, by Product Type 2020 & 2033
- Table 22: Global OLED Market Volume Billion Forecast, by Product Type 2020 & 2033
- Table 23: Global OLED Market Revenue Million Forecast, by Technology 2020 & 2033
- Table 24: Global OLED Market Volume Billion Forecast, by Technology 2020 & 2033
- Table 25: Global OLED Market Revenue Million Forecast, by Type 2020 & 2033
- Table 26: Global OLED Market Volume Billion Forecast, by Type 2020 & 2033
- Table 27: Global OLED Market Revenue Million Forecast, by Application 2020 & 2033
- Table 28: Global OLED Market Volume Billion Forecast, by Application 2020 & 2033
- Table 29: Global OLED Market Revenue Million Forecast, by Country 2020 & 2033
- Table 30: Global OLED Market Volume Billion Forecast, by Country 2020 & 2033
- Table 31: Global OLED Market Revenue Million Forecast, by Product Type 2020 & 2033
- Table 32: Global OLED Market Volume Billion Forecast, by Product Type 2020 & 2033
- Table 33: Global OLED Market Revenue Million Forecast, by Technology 2020 & 2033
- Table 34: Global OLED Market Volume Billion Forecast, by Technology 2020 & 2033
- Table 35: Global OLED Market Revenue Million Forecast, by Type 2020 & 2033
- Table 36: Global OLED Market Volume Billion Forecast, by Type 2020 & 2033
- Table 37: Global OLED Market Revenue Million Forecast, by Application 2020 & 2033
- Table 38: Global OLED Market Volume Billion Forecast, by Application 2020 & 2033
- Table 39: Global OLED Market Revenue Million Forecast, by Country 2020 & 2033
- Table 40: Global OLED Market Volume Billion Forecast, by Country 2020 & 2033
- Table 41: Global OLED Market Revenue Million Forecast, by Product Type 2020 & 2033
- Table 42: Global OLED Market Volume Billion Forecast, by Product Type 2020 & 2033
- Table 43: Global OLED Market Revenue Million Forecast, by Technology 2020 & 2033
- Table 44: Global OLED Market Volume Billion Forecast, by Technology 2020 & 2033
- Table 45: Global OLED Market Revenue Million Forecast, by Type 2020 & 2033
- Table 46: Global OLED Market Volume Billion Forecast, by Type 2020 & 2033
- Table 47: Global OLED Market Revenue Million Forecast, by Application 2020 & 2033
- Table 48: Global OLED Market Volume Billion Forecast, by Application 2020 & 2033
- Table 49: Global OLED Market Revenue Million Forecast, by Country 2020 & 2033
- Table 50: Global OLED Market Volume Billion Forecast, by Country 2020 & 2033
- Table 51: Global OLED Market Revenue Million Forecast, by Product Type 2020 & 2033
- Table 52: Global OLED Market Volume Billion Forecast, by Product Type 2020 & 2033
- Table 53: Global OLED Market Revenue Million Forecast, by Technology 2020 & 2033
- Table 54: Global OLED Market Volume Billion Forecast, by Technology 2020 & 2033
- Table 55: Global OLED Market Revenue Million Forecast, by Type 2020 & 2033
- Table 56: Global OLED Market Volume Billion Forecast, by Type 2020 & 2033
- Table 57: Global OLED Market Revenue Million Forecast, by Application 2020 & 2033
- Table 58: Global OLED Market Volume Billion Forecast, by Application 2020 & 2033
- Table 59: Global OLED Market Revenue Million Forecast, by Country 2020 & 2033
- Table 60: Global OLED Market Volume Billion Forecast, by Country 2020 & 2033
- Table 61: Global OLED Market Revenue Million Forecast, by Product Type 2020 & 2033
- Table 62: Global OLED Market Volume Billion Forecast, by Product Type 2020 & 2033
- Table 63: Global OLED Market Revenue Million Forecast, by Technology 2020 & 2033
- Table 64: Global OLED Market Volume Billion Forecast, by Technology 2020 & 2033
- Table 65: Global OLED Market Revenue Million Forecast, by Type 2020 & 2033
- Table 66: Global OLED Market Volume Billion Forecast, by Type 2020 & 2033
- Table 67: Global OLED Market Revenue Million Forecast, by Application 2020 & 2033
- Table 68: Global OLED Market Volume Billion Forecast, by Application 2020 & 2033
- Table 69: Global OLED Market Revenue Million Forecast, by Country 2020 & 2033
- Table 70: Global OLED Market Volume Billion Forecast, by Country 2020 & 2033
Frequently Asked Questions
1. What is the projected Compound Annual Growth Rate (CAGR) of the OLED Market?
The projected CAGR is approximately 12.31%.
2. Which companies are prominent players in the OLED Market?
Key companies in the market include Sony Corporation, Pioneer Corporation, LG Display Co Ltd, Samsung Display Co Ltd, Universal Display Corporation, OLEDWorks LLC, TDK Corporation, OSRAM OLED GmbH, Winstar Display Co Ltd, Visionox Co Ltd, Raystar Optronics Inc, Ritek Corporation, WiseChip Semiconductor Inc, Hella GmbH & KGaA, Yeolight Technology, Acuity Brands Inc, Kopin Corporation, Pixelligent Technologies, BOE Technology, Tianma Microelectronics*List Not Exhaustive.
3. What are the main segments of the OLED Market?
The market segments include Product Type, Technology, Type, Application.
4. Can you provide details about the market size?
The market size is estimated to be USD 28.14 Million as of 2022.
5. What are some drivers contributing to market growth?
Increasing Demand for Enhanced Display Quality in Wearable Devices and Smartphones; Rising Demand for Affordable and Energy-efficient OLED Lighting Solutions.
6. What are the notable trends driving market growth?
Mobile and Tablet Segment is Expected to Hold Significant Market Share.
7. Are there any restraints impacting market growth?
Increasing Demand for Enhanced Display Quality in Wearable Devices and Smartphones; Rising Demand for Affordable and Energy-efficient OLED Lighting Solutions.
8. Can you provide examples of recent developments in the market?
February 2024: Samsung Display presented robust foldable panels and introduced Flex Magic Pixel OLED technology, which collaborates with AI-enabled smart devices to enhance security measures. The artwork 'Mr. OLEDboy,' created by the esteemed London-based fashion illustrator Mr. Slowboy, imagines the future shaped by OLED technology.January 2024: Apple announced the introduction of a new midrange iPhone model. According to a report, the forthcoming iPhone SE 4, which represents the fourth generation of the 'Special Edition' iPhone, is anticipated to include an OLED display produced by a Chinese manufacturer.
9. What pricing options are available for accessing the report?
Pricing options include single-user, multi-user, and enterprise licenses priced at USD 4750, USD 5250, and USD 8750 respectively.
10. Is the market size provided in terms of value or volume?
The market size is provided in terms of value, measured in Million and volume, measured in Billion.
11. Are there any specific market keywords associated with the report?
Yes, the market keyword associated with the report is "OLED Market," which aids in identifying and referencing the specific market segment covered.
12. How do I determine which pricing option suits my needs best?
The pricing options vary based on user requirements and access needs. Individual users may opt for single-user licenses, while businesses requiring broader access may choose multi-user or enterprise licenses for cost-effective access to the report.
13. Are there any additional resources or data provided in the OLED Market report?
While the report offers comprehensive insights, it's advisable to review the specific contents or supplementary materials provided to ascertain if additional resources or data are available.
14. How can I stay updated on further developments or reports in the OLED Market?
To stay informed about further developments, trends, and reports in the OLED Market, consider subscribing to industry newsletters, following relevant companies and organizations, or regularly checking reputable industry news sources and publications.
Methodology
Step 1 - Identification of Relevant Samples Size from Population Database


Step 2 - Approaches for Defining Global Market Size (Value, Volume* & Price*)

Note*: In applicable scenarios
Step 3 - Data Sources
Primary Research
- Web Analytics
- Survey Reports
- Research Institute
- Latest Research Reports
- Opinion Leaders
Secondary Research
- Annual Reports
- White Paper
- Latest Press Release
- Industry Association
- Paid Database
- Investor Presentations

Step 4 - Data Triangulation
Involves using different sources of information in order to increase the validity of a study
These sources are likely to be stakeholders in a program - participants, other researchers, program staff, other community members, and so on.
Then we put all data in single framework & apply various statistical tools to find out the dynamic on the market.
During the analysis stage, feedback from the stakeholder groups would be compared to determine areas of agreement as well as areas of divergence