
Key Insights
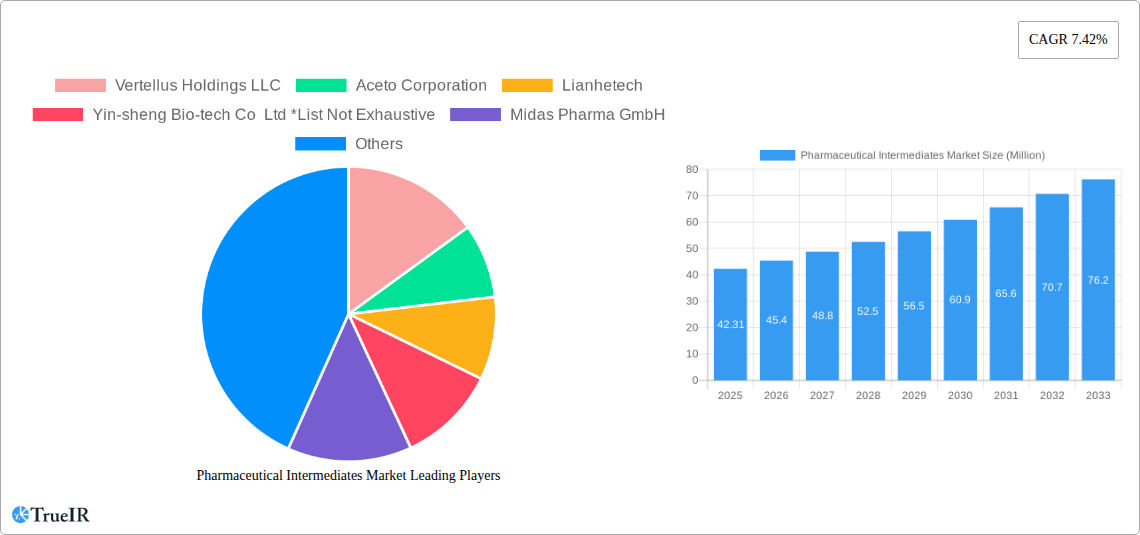
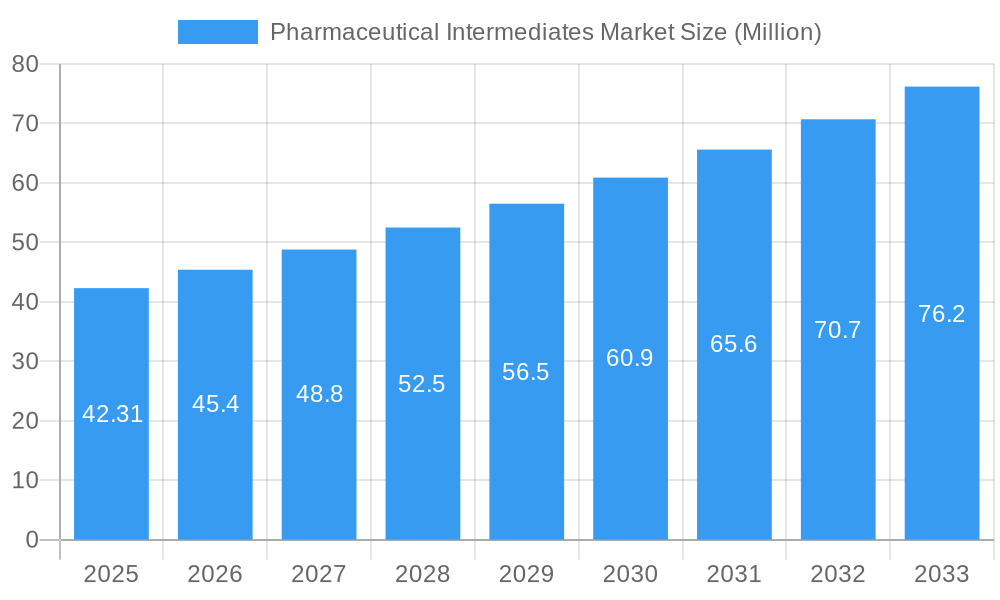
The Pharmaceutical Intermediates market is experiencing robust growth, projected to reach \$42.31 million in 2025 and maintain a Compound Annual Growth Rate (CAGR) of 7.42% from 2025 to 2033. This expansion is driven by several key factors. The increasing prevalence of chronic diseases globally fuels demand for pharmaceuticals, consequently boosting the need for pharmaceutical intermediates. Advancements in drug discovery and development, particularly in areas like personalized medicine and targeted therapies, are creating new opportunities for specialized intermediates. Furthermore, the growing outsourcing of manufacturing processes by pharmaceutical companies to contract manufacturing organizations (CMOs) contributes significantly to market growth. The market is segmented by type (Chemical Intermediate, Bulk Drug Intermediate, Others), application (Analgesics, Anti-Infective Drugs, Cardiovascular Drugs, Oral Antidiabetic Drugs, Antimicrobial Drugs, Others), and end-user (Biotech and Pharma Companies, Research Institutions, Others). The diverse applications of pharmaceutical intermediates across various therapeutic areas ensure sustained demand across the forecast period.
Pharmaceutical Intermediates Market Market Size (In Million)
Significant regional variations are anticipated. North America and Europe currently hold substantial market share, driven by established pharmaceutical industries and robust regulatory frameworks. However, the Asia-Pacific region is poised for rapid growth, fueled by expanding pharmaceutical manufacturing capabilities and a rising middle class with increased access to healthcare. Competitive dynamics are shaped by a mix of established multinational corporations like BASF SE and Sanofi SAIS, along with smaller specialized players and regional manufacturers. The market's future will likely be influenced by regulatory changes, technological advancements in manufacturing processes (e.g., continuous manufacturing), and the ongoing trend toward biosimilars and generics, which could impact the demand for specific types of intermediates. Maintaining a competitive edge will require manufacturers to focus on innovation, cost efficiency, and stringent quality control to meet the growing demands of the global pharmaceutical industry.
Pharmaceutical Intermediates Market Company Market Share
Pharmaceutical Intermediates Market: A Comprehensive Report (2019-2033)
This dynamic report provides a comprehensive analysis of the Pharmaceutical Intermediates Market, offering invaluable insights for industry stakeholders. With a study period spanning 2019-2033, a base year of 2025, and a forecast period of 2025-2033, this report leverages rigorous data analysis and industry expertise to deliver actionable intelligence. The market is segmented by type (Chemical Intermediate, Bulk Drug Intermediate, Others), application (Analgesics, Anti-Infective Drugs, Cardiovascular Drugs, Oral Antidiabetic Drugs, Antimicrobial Drugs, Others), and end-user (Biotech and Pharma Companies, Research Institutions, Others). Key players analyzed include Vertellus Holdings LLC, Aceto Corporation, Lianhetech, Yin-sheng Bio-tech Co Ltd, Midas Pharma GmbH, Sanofi SAIS, BASF SE, Dishman Group, A R Life Science, Chiracon GmbH, Green Vision Life Sciences, and Codexis Inc. This is not an exhaustive list. The report projects significant market growth, driven by factors detailed below.
Pharmaceutical Intermediates Market Structure & Competitive Landscape
The Pharmaceutical Intermediates market is characterized by a moderately concentrated structure, with a few large multinational companies dominating alongside numerous smaller, specialized players. The Herfindahl-Hirschman Index (HHI) is estimated at xx in 2025, indicating a moderately concentrated market. Innovation is a key driver, with companies continuously investing in R&D to develop new and improved intermediates for emerging drug classes. Regulatory changes, particularly regarding GMP compliance and environmental regulations, significantly impact market dynamics. The market experiences substitution pressure from generic intermediates, putting pressure on pricing. The end-user segment is dominated by large biotech and pharma companies, which account for approximately xx Million of the total market value in 2025.
- Market Concentration: Moderate concentration with an estimated HHI of xx in 2025.
- Innovation Drivers: Continuous R&D investment in novel intermediates for advanced therapies.
- Regulatory Impacts: Stringent GMP and environmental regulations shaping market access.
- Product Substitutes: Pressure from generic intermediates impacting pricing and market share.
- End-User Segmentation: Biotech and Pharma Companies are the dominant end-users, accounting for approximately xx Million in 2025.
- M&A Trends: A moderate level of M&A activity, with xx major transactions recorded in the past five years, driven by expansion strategies and technology acquisitions.
Pharmaceutical Intermediates Market Trends & Opportunities
The global Pharmaceutical Intermediates market is experiencing robust growth, with an estimated CAGR of xx% during the forecast period (2025-2033). This growth is primarily driven by the increasing demand for novel drugs, especially in the areas of oncology, immunology, and infectious diseases. Technological advancements, particularly in process chemistry and automation, are improving manufacturing efficiency and reducing costs. Market penetration of advanced intermediates is increasing as pharmaceutical companies seek to improve drug efficacy and safety. Competitive dynamics are shaped by price competition, innovation, and strategic partnerships. Market size is projected to reach xx Million by 2033, indicating significant growth potential. The rising prevalence of chronic diseases is another key factor driving market growth, as the demand for treatments continues to increase.
Dominant Markets & Segments in Pharmaceutical Intermediates Market
The North American region is currently the dominant market for pharmaceutical intermediates, accounting for approximately xx Million in 2025. This is primarily attributed to the robust pharmaceutical industry presence, advanced research infrastructure, and high R&D spending. However, the Asia-Pacific region is expected to exhibit the highest CAGR during the forecast period, driven by expanding manufacturing capabilities and rising demand from emerging markets.
- By Type: The Chemical Intermediate segment holds the largest market share, contributing approximately xx Million in 2025 due to its widespread use across various drug classes.
- By Application: The Anti-Infective Drugs segment displays strong growth potential, owing to the increasing prevalence of infectious diseases and the continuous development of new antibiotics.
- By End-User: Biotech and Pharma Companies are the primary consumers of pharmaceutical intermediates, representing a substantial proportion of the market.
Key Growth Drivers:
- Robust Pharmaceutical Industry: High R&D investment fuels demand for new intermediates.
- Technological Advancements: Process improvements enhance efficiency and reduce costs.
- Government Initiatives: Regulatory support and incentives promote market expansion.
Pharmaceutical Intermediates Market Product Analysis
Recent innovations in pharmaceutical intermediates focus on improving efficacy, safety, and reducing production costs. This includes the development of novel synthetic routes, the use of green chemistry principles, and the application of advanced analytical techniques for quality control. The market showcases a wide array of intermediates with diverse applications catering to various drug classes. Competitive advantages stem from proprietary synthesis methods, cost-effective manufacturing, and strong intellectual property portfolios.
Key Drivers, Barriers & Challenges in Pharmaceutical Intermediates Market
Key Drivers:
- Growing demand for pharmaceuticals globally.
- Technological advancements leading to cost reduction and increased efficiency.
- Increased investment in R&D and innovation by pharmaceutical companies.
Key Challenges and Restraints:
- Stringent regulatory approvals and compliance requirements significantly impact time-to-market and costs.
- Fluctuations in raw material prices and supply chain disruptions increase manufacturing costs and uncertainty.
- Intense competition from generic drug manufacturers puts pressure on profit margins. This is projected to impact the market by reducing profit margins by an estimated xx% by 2030.
Growth Drivers in the Pharmaceutical Intermediates Market Market
The pharmaceutical intermediates market's growth is fueled by several factors: the increasing prevalence of chronic diseases worldwide, leading to higher demand for pharmaceuticals; technological advancements that streamline manufacturing processes and improve efficiency; and substantial investments in R&D by pharmaceutical companies pushing for innovative drug development. Furthermore, supportive government policies and incentives for pharmaceutical manufacturing in several regions contribute to the market's expansion.
Challenges Impacting Pharmaceutical Intermediates Market Growth
Despite significant growth potential, the market faces challenges including stringent regulatory requirements and lengthy approval processes, leading to high costs and delays. Supply chain vulnerabilities and price fluctuations of raw materials cause uncertainty and potentially inflate costs. Intense competition, especially from generic drug manufacturers, exerts pressure on pricing and profitability.
Key Players Shaping the Pharmaceutical Intermediates Market Market
- Vertellus Holdings LLC
- Aceto Corporation
- Lianhetech
- Yin-sheng Bio-tech Co Ltd
- Midas Pharma GmbH
- Sanofi SAIS
- BASF SE
- Dishman Group
- A R Life Science
- Chiracon GmbH
- Green Vision Life Sciences
- Codexis Inc
Significant Pharmaceutical Intermediates Market Industry Milestones
- March 2022: Sumitomo Chemical Co., Ltd. announces the construction of a new manufacturing plant for APIs and intermediates in Japan, expanding capacity to meet increasing demand.
- October 2022: AstraZeneca's Imjudo (tremelimumab) + Imfinzi (durvalumab) receives US FDA approval for unresectable hepatocellular carcinoma treatment, boosting demand for related intermediates.
- February 2022: CordenPharma acquires three manufacturing facilities from Vifor Pharma, expanding its production capacity and market reach.
Future Outlook for Pharmaceutical Intermediates Market Market
The pharmaceutical intermediates market is poised for continued growth, driven by the persistent demand for innovative drugs, technological advancements, and favorable regulatory environments in key regions. Strategic partnerships and collaborations will play a significant role in shaping market dynamics, alongside an increasing focus on sustainable and environmentally friendly manufacturing practices. This is expected to lead to a significant expansion of market value, reaching an estimated xx Million by 2033.
Pharmaceutical Intermediates Market Segmentation
-
1. Type
- 1.1. Chemical Intermediate
- 1.2. Bulk Drug Intermediate
- 1.3. Others
-
2. Application
- 2.1. Analgesics
- 2.2. Anti-Infective Drugs
- 2.3. Cardiovascular Drugs
- 2.4. Oral Antidiabetic Drugs
- 2.5. Antimicrobial Drugs
- 2.6. Others
-
3. End-User
- 3.1. Biotech and Pharma Companies
- 3.2. Research Institutions
- 3.3. Others
Pharmaceutical Intermediates Market Segmentation By Geography
-
1. North America
- 1.1. United States
- 1.2. Canada
- 1.3. Mexico
-
2. Europe
- 2.1. Germany
- 2.2. United Kingdom
- 2.3. France
- 2.4. Italy
- 2.5. Spain
- 2.6. Rest of Europe
-
3. Asia Pacific
- 3.1. China
- 3.2. Japan
- 3.3. India
- 3.4. Australia
- 3.5. South Korea
- 3.6. Rest of Asia Pacific
-
4. Middle East and Africa
- 4.1. GCC
- 4.2. South Africa
- 4.3. Rest of Middle East and Africa
-
5. South America
- 5.1. Brazil
- 5.2. Argentina
- 5.3. Rest of South America

Pharmaceutical Intermediates Market Regional Market Share
Geographic Coverage of Pharmaceutical Intermediates Market
Pharmaceutical Intermediates Market REPORT HIGHLIGHTS
| Aspects | Details |
|---|---|
| Study Period | 2020-2034 |
| Base Year | 2025 |
| Estimated Year | 2026 |
| Forecast Period | 2026-2034 |
| Historical Period | 2020-2025 |
| Growth Rate | CAGR of 7.42% from 2020-2034 |
| Segmentation |
|
Table of Contents
- 1. Introduction
- 1.1. Research Scope
- 1.2. Market Segmentation
- 1.3. Research Methodology
- 1.4. Definitions and Assumptions
- 2. Executive Summary
- 2.1. Introduction
- 3. Market Dynamics
- 3.1. Introduction
- 3.2. Market Drivers
- 3.2.1. Increasing Prevalence of Chronic Diseases; Growing R&D Initiatives and Activities in the Pharmaceutical Industry
- 3.3. Market Restrains
- 3.3.1. Stringent Regulatory Issues Regarding Certain Pharmaceutical Intermediate Substances
- 3.4. Market Trends
- 3.4.1. Cardiovascular Drugs Hold Significant Share in the Global Pharmaceutical Intermediates Market
- 4. Market Factor Analysis
- 4.1. Porters Five Forces
- 4.2. Supply/Value Chain
- 4.3. PESTEL analysis
- 4.4. Market Entropy
- 4.5. Patent/Trademark Analysis
- 5. Global Pharmaceutical Intermediates Market Analysis, Insights and Forecast, 2020-2032
- 5.1. Market Analysis, Insights and Forecast - by Type
- 5.1.1. Chemical Intermediate
- 5.1.2. Bulk Drug Intermediate
- 5.1.3. Others
- 5.2. Market Analysis, Insights and Forecast - by Application
- 5.2.1. Analgesics
- 5.2.2. Anti-Infective Drugs
- 5.2.3. Cardiovascular Drugs
- 5.2.4. Oral Antidiabetic Drugs
- 5.2.5. Antimicrobial Drugs
- 5.2.6. Others
- 5.3. Market Analysis, Insights and Forecast - by End-User
- 5.3.1. Biotech and Pharma Companies
- 5.3.2. Research Institutions
- 5.3.3. Others
- 5.4. Market Analysis, Insights and Forecast - by Region
- 5.4.1. North America
- 5.4.2. Europe
- 5.4.3. Asia Pacific
- 5.4.4. Middle East and Africa
- 5.4.5. South America
- 5.1. Market Analysis, Insights and Forecast - by Type
- 6. North America Pharmaceutical Intermediates Market Analysis, Insights and Forecast, 2020-2032
- 6.1. Market Analysis, Insights and Forecast - by Type
- 6.1.1. Chemical Intermediate
- 6.1.2. Bulk Drug Intermediate
- 6.1.3. Others
- 6.2. Market Analysis, Insights and Forecast - by Application
- 6.2.1. Analgesics
- 6.2.2. Anti-Infective Drugs
- 6.2.3. Cardiovascular Drugs
- 6.2.4. Oral Antidiabetic Drugs
- 6.2.5. Antimicrobial Drugs
- 6.2.6. Others
- 6.3. Market Analysis, Insights and Forecast - by End-User
- 6.3.1. Biotech and Pharma Companies
- 6.3.2. Research Institutions
- 6.3.3. Others
- 6.1. Market Analysis, Insights and Forecast - by Type
- 7. Europe Pharmaceutical Intermediates Market Analysis, Insights and Forecast, 2020-2032
- 7.1. Market Analysis, Insights and Forecast - by Type
- 7.1.1. Chemical Intermediate
- 7.1.2. Bulk Drug Intermediate
- 7.1.3. Others
- 7.2. Market Analysis, Insights and Forecast - by Application
- 7.2.1. Analgesics
- 7.2.2. Anti-Infective Drugs
- 7.2.3. Cardiovascular Drugs
- 7.2.4. Oral Antidiabetic Drugs
- 7.2.5. Antimicrobial Drugs
- 7.2.6. Others
- 7.3. Market Analysis, Insights and Forecast - by End-User
- 7.3.1. Biotech and Pharma Companies
- 7.3.2. Research Institutions
- 7.3.3. Others
- 7.1. Market Analysis, Insights and Forecast - by Type
- 8. Asia Pacific Pharmaceutical Intermediates Market Analysis, Insights and Forecast, 2020-2032
- 8.1. Market Analysis, Insights and Forecast - by Type
- 8.1.1. Chemical Intermediate
- 8.1.2. Bulk Drug Intermediate
- 8.1.3. Others
- 8.2. Market Analysis, Insights and Forecast - by Application
- 8.2.1. Analgesics
- 8.2.2. Anti-Infective Drugs
- 8.2.3. Cardiovascular Drugs
- 8.2.4. Oral Antidiabetic Drugs
- 8.2.5. Antimicrobial Drugs
- 8.2.6. Others
- 8.3. Market Analysis, Insights and Forecast - by End-User
- 8.3.1. Biotech and Pharma Companies
- 8.3.2. Research Institutions
- 8.3.3. Others
- 8.1. Market Analysis, Insights and Forecast - by Type
- 9. Middle East and Africa Pharmaceutical Intermediates Market Analysis, Insights and Forecast, 2020-2032
- 9.1. Market Analysis, Insights and Forecast - by Type
- 9.1.1. Chemical Intermediate
- 9.1.2. Bulk Drug Intermediate
- 9.1.3. Others
- 9.2. Market Analysis, Insights and Forecast - by Application
- 9.2.1. Analgesics
- 9.2.2. Anti-Infective Drugs
- 9.2.3. Cardiovascular Drugs
- 9.2.4. Oral Antidiabetic Drugs
- 9.2.5. Antimicrobial Drugs
- 9.2.6. Others
- 9.3. Market Analysis, Insights and Forecast - by End-User
- 9.3.1. Biotech and Pharma Companies
- 9.3.2. Research Institutions
- 9.3.3. Others
- 9.1. Market Analysis, Insights and Forecast - by Type
- 10. South America Pharmaceutical Intermediates Market Analysis, Insights and Forecast, 2020-2032
- 10.1. Market Analysis, Insights and Forecast - by Type
- 10.1.1. Chemical Intermediate
- 10.1.2. Bulk Drug Intermediate
- 10.1.3. Others
- 10.2. Market Analysis, Insights and Forecast - by Application
- 10.2.1. Analgesics
- 10.2.2. Anti-Infective Drugs
- 10.2.3. Cardiovascular Drugs
- 10.2.4. Oral Antidiabetic Drugs
- 10.2.5. Antimicrobial Drugs
- 10.2.6. Others
- 10.3. Market Analysis, Insights and Forecast - by End-User
- 10.3.1. Biotech and Pharma Companies
- 10.3.2. Research Institutions
- 10.3.3. Others
- 10.1. Market Analysis, Insights and Forecast - by Type
- 11. North Americ Pharmaceutical Intermediates Market Analysis, Insights and Forecast, 2020-2032
- 11.1. Market Analysis, Insights and Forecast - By Country/Sub-region
- 11.1.1 United States
- 11.1.2 Canada
- 11.1.3 Mexico
- 12. South America Pharmaceutical Intermediates Market Analysis, Insights and Forecast, 2020-2032
- 12.1. Market Analysis, Insights and Forecast - By Country/Sub-region
- 12.1.1 Brazil
- 12.1.2 Mexico
- 12.1.3 Rest of South America
- 13. Europe Pharmaceutical Intermediates Market Analysis, Insights and Forecast, 2020-2032
- 13.1. Market Analysis, Insights and Forecast - By Country/Sub-region
- 13.1.1 Germany
- 13.1.2 United Kingdom
- 13.1.3 France
- 13.1.4 Italy
- 13.1.5 Spain
- 13.1.6 Rest of Europe
- 14. Asia Pacific Pharmaceutical Intermediates Market Analysis, Insights and Forecast, 2020-2032
- 14.1. Market Analysis, Insights and Forecast - By Country/Sub-region
- 14.1.1 China
- 14.1.2 Japan
- 14.1.3 India
- 14.1.4 South Korea
- 14.1.5 Taiwan
- 14.1.6 Australia
- 14.1.7 Rest of Asia-Pacific
- 15. MEA Pharmaceutical Intermediates Market Analysis, Insights and Forecast, 2020-2032
- 15.1. Market Analysis, Insights and Forecast - By Country/Sub-region
- 15.1.1 Middle East
- 15.1.2 Africa
- 16. Competitive Analysis
- 16.1. Global Market Share Analysis 2025
- 16.2. Company Profiles
- 16.2.1 Vertellus Holdings LLC
- 16.2.1.1. Overview
- 16.2.1.2. Products
- 16.2.1.3. SWOT Analysis
- 16.2.1.4. Recent Developments
- 16.2.1.5. Financials (Based on Availability)
- 16.2.2 Aceto Corporation
- 16.2.2.1. Overview
- 16.2.2.2. Products
- 16.2.2.3. SWOT Analysis
- 16.2.2.4. Recent Developments
- 16.2.2.5. Financials (Based on Availability)
- 16.2.3 Lianhetech
- 16.2.3.1. Overview
- 16.2.3.2. Products
- 16.2.3.3. SWOT Analysis
- 16.2.3.4. Recent Developments
- 16.2.3.5. Financials (Based on Availability)
- 16.2.4 Yin-sheng Bio-tech Co Ltd *List Not Exhaustive
- 16.2.4.1. Overview
- 16.2.4.2. Products
- 16.2.4.3. SWOT Analysis
- 16.2.4.4. Recent Developments
- 16.2.4.5. Financials (Based on Availability)
- 16.2.5 Midas Pharma GmbH
- 16.2.5.1. Overview
- 16.2.5.2. Products
- 16.2.5.3. SWOT Analysis
- 16.2.5.4. Recent Developments
- 16.2.5.5. Financials (Based on Availability)
- 16.2.6 Sanofi SAIS
- 16.2.6.1. Overview
- 16.2.6.2. Products
- 16.2.6.3. SWOT Analysis
- 16.2.6.4. Recent Developments
- 16.2.6.5. Financials (Based on Availability)
- 16.2.7 BASF SE
- 16.2.7.1. Overview
- 16.2.7.2. Products
- 16.2.7.3. SWOT Analysis
- 16.2.7.4. Recent Developments
- 16.2.7.5. Financials (Based on Availability)
- 16.2.8 Dishman Group
- 16.2.8.1. Overview
- 16.2.8.2. Products
- 16.2.8.3. SWOT Analysis
- 16.2.8.4. Recent Developments
- 16.2.8.5. Financials (Based on Availability)
- 16.2.9 A R Life Science
- 16.2.9.1. Overview
- 16.2.9.2. Products
- 16.2.9.3. SWOT Analysis
- 16.2.9.4. Recent Developments
- 16.2.9.5. Financials (Based on Availability)
- 16.2.10 Chiracon GmbH
- 16.2.10.1. Overview
- 16.2.10.2. Products
- 16.2.10.3. SWOT Analysis
- 16.2.10.4. Recent Developments
- 16.2.10.5. Financials (Based on Availability)
- 16.2.11 Green Vision Life Sciences
- 16.2.11.1. Overview
- 16.2.11.2. Products
- 16.2.11.3. SWOT Analysis
- 16.2.11.4. Recent Developments
- 16.2.11.5. Financials (Based on Availability)
- 16.2.12 Codexis Inc
- 16.2.12.1. Overview
- 16.2.12.2. Products
- 16.2.12.3. SWOT Analysis
- 16.2.12.4. Recent Developments
- 16.2.12.5. Financials (Based on Availability)
- 16.2.1 Vertellus Holdings LLC
List of Figures
- Figure 1: Global Pharmaceutical Intermediates Market Revenue Breakdown (Million, %) by Region 2025 & 2033
- Figure 2: North Americ Pharmaceutical Intermediates Market Revenue (Million), by Country 2025 & 2033
- Figure 3: North Americ Pharmaceutical Intermediates Market Revenue Share (%), by Country 2025 & 2033
- Figure 4: South America Pharmaceutical Intermediates Market Revenue (Million), by Country 2025 & 2033
- Figure 5: South America Pharmaceutical Intermediates Market Revenue Share (%), by Country 2025 & 2033
- Figure 6: Europe Pharmaceutical Intermediates Market Revenue (Million), by Country 2025 & 2033
- Figure 7: Europe Pharmaceutical Intermediates Market Revenue Share (%), by Country 2025 & 2033
- Figure 8: Asia Pacific Pharmaceutical Intermediates Market Revenue (Million), by Country 2025 & 2033
- Figure 9: Asia Pacific Pharmaceutical Intermediates Market Revenue Share (%), by Country 2025 & 2033
- Figure 10: MEA Pharmaceutical Intermediates Market Revenue (Million), by Country 2025 & 2033
- Figure 11: MEA Pharmaceutical Intermediates Market Revenue Share (%), by Country 2025 & 2033
- Figure 12: North America Pharmaceutical Intermediates Market Revenue (Million), by Type 2025 & 2033
- Figure 13: North America Pharmaceutical Intermediates Market Revenue Share (%), by Type 2025 & 2033
- Figure 14: North America Pharmaceutical Intermediates Market Revenue (Million), by Application 2025 & 2033
- Figure 15: North America Pharmaceutical Intermediates Market Revenue Share (%), by Application 2025 & 2033
- Figure 16: North America Pharmaceutical Intermediates Market Revenue (Million), by End-User 2025 & 2033
- Figure 17: North America Pharmaceutical Intermediates Market Revenue Share (%), by End-User 2025 & 2033
- Figure 18: North America Pharmaceutical Intermediates Market Revenue (Million), by Country 2025 & 2033
- Figure 19: North America Pharmaceutical Intermediates Market Revenue Share (%), by Country 2025 & 2033
- Figure 20: Europe Pharmaceutical Intermediates Market Revenue (Million), by Type 2025 & 2033
- Figure 21: Europe Pharmaceutical Intermediates Market Revenue Share (%), by Type 2025 & 2033
- Figure 22: Europe Pharmaceutical Intermediates Market Revenue (Million), by Application 2025 & 2033
- Figure 23: Europe Pharmaceutical Intermediates Market Revenue Share (%), by Application 2025 & 2033
- Figure 24: Europe Pharmaceutical Intermediates Market Revenue (Million), by End-User 2025 & 2033
- Figure 25: Europe Pharmaceutical Intermediates Market Revenue Share (%), by End-User 2025 & 2033
- Figure 26: Europe Pharmaceutical Intermediates Market Revenue (Million), by Country 2025 & 2033
- Figure 27: Europe Pharmaceutical Intermediates Market Revenue Share (%), by Country 2025 & 2033
- Figure 28: Asia Pacific Pharmaceutical Intermediates Market Revenue (Million), by Type 2025 & 2033
- Figure 29: Asia Pacific Pharmaceutical Intermediates Market Revenue Share (%), by Type 2025 & 2033
- Figure 30: Asia Pacific Pharmaceutical Intermediates Market Revenue (Million), by Application 2025 & 2033
- Figure 31: Asia Pacific Pharmaceutical Intermediates Market Revenue Share (%), by Application 2025 & 2033
- Figure 32: Asia Pacific Pharmaceutical Intermediates Market Revenue (Million), by End-User 2025 & 2033
- Figure 33: Asia Pacific Pharmaceutical Intermediates Market Revenue Share (%), by End-User 2025 & 2033
- Figure 34: Asia Pacific Pharmaceutical Intermediates Market Revenue (Million), by Country 2025 & 2033
- Figure 35: Asia Pacific Pharmaceutical Intermediates Market Revenue Share (%), by Country 2025 & 2033
- Figure 36: Middle East and Africa Pharmaceutical Intermediates Market Revenue (Million), by Type 2025 & 2033
- Figure 37: Middle East and Africa Pharmaceutical Intermediates Market Revenue Share (%), by Type 2025 & 2033
- Figure 38: Middle East and Africa Pharmaceutical Intermediates Market Revenue (Million), by Application 2025 & 2033
- Figure 39: Middle East and Africa Pharmaceutical Intermediates Market Revenue Share (%), by Application 2025 & 2033
- Figure 40: Middle East and Africa Pharmaceutical Intermediates Market Revenue (Million), by End-User 2025 & 2033
- Figure 41: Middle East and Africa Pharmaceutical Intermediates Market Revenue Share (%), by End-User 2025 & 2033
- Figure 42: Middle East and Africa Pharmaceutical Intermediates Market Revenue (Million), by Country 2025 & 2033
- Figure 43: Middle East and Africa Pharmaceutical Intermediates Market Revenue Share (%), by Country 2025 & 2033
- Figure 44: South America Pharmaceutical Intermediates Market Revenue (Million), by Type 2025 & 2033
- Figure 45: South America Pharmaceutical Intermediates Market Revenue Share (%), by Type 2025 & 2033
- Figure 46: South America Pharmaceutical Intermediates Market Revenue (Million), by Application 2025 & 2033
- Figure 47: South America Pharmaceutical Intermediates Market Revenue Share (%), by Application 2025 & 2033
- Figure 48: South America Pharmaceutical Intermediates Market Revenue (Million), by End-User 2025 & 2033
- Figure 49: South America Pharmaceutical Intermediates Market Revenue Share (%), by End-User 2025 & 2033
- Figure 50: South America Pharmaceutical Intermediates Market Revenue (Million), by Country 2025 & 2033
- Figure 51: South America Pharmaceutical Intermediates Market Revenue Share (%), by Country 2025 & 2033
List of Tables
- Table 1: Global Pharmaceutical Intermediates Market Revenue Million Forecast, by Region 2020 & 2033
- Table 2: Global Pharmaceutical Intermediates Market Revenue Million Forecast, by Type 2020 & 2033
- Table 3: Global Pharmaceutical Intermediates Market Revenue Million Forecast, by Application 2020 & 2033
- Table 4: Global Pharmaceutical Intermediates Market Revenue Million Forecast, by End-User 2020 & 2033
- Table 5: Global Pharmaceutical Intermediates Market Revenue Million Forecast, by Region 2020 & 2033
- Table 6: Global Pharmaceutical Intermediates Market Revenue Million Forecast, by Country 2020 & 2033
- Table 7: United States Pharmaceutical Intermediates Market Revenue (Million) Forecast, by Application 2020 & 2033
- Table 8: Canada Pharmaceutical Intermediates Market Revenue (Million) Forecast, by Application 2020 & 2033
- Table 9: Mexico Pharmaceutical Intermediates Market Revenue (Million) Forecast, by Application 2020 & 2033
- Table 10: Global Pharmaceutical Intermediates Market Revenue Million Forecast, by Country 2020 & 2033
- Table 11: Brazil Pharmaceutical Intermediates Market Revenue (Million) Forecast, by Application 2020 & 2033
- Table 12: Mexico Pharmaceutical Intermediates Market Revenue (Million) Forecast, by Application 2020 & 2033
- Table 13: Rest of South America Pharmaceutical Intermediates Market Revenue (Million) Forecast, by Application 2020 & 2033
- Table 14: Global Pharmaceutical Intermediates Market Revenue Million Forecast, by Country 2020 & 2033
- Table 15: Germany Pharmaceutical Intermediates Market Revenue (Million) Forecast, by Application 2020 & 2033
- Table 16: United Kingdom Pharmaceutical Intermediates Market Revenue (Million) Forecast, by Application 2020 & 2033
- Table 17: France Pharmaceutical Intermediates Market Revenue (Million) Forecast, by Application 2020 & 2033
- Table 18: Italy Pharmaceutical Intermediates Market Revenue (Million) Forecast, by Application 2020 & 2033
- Table 19: Spain Pharmaceutical Intermediates Market Revenue (Million) Forecast, by Application 2020 & 2033
- Table 20: Rest of Europe Pharmaceutical Intermediates Market Revenue (Million) Forecast, by Application 2020 & 2033
- Table 21: Global Pharmaceutical Intermediates Market Revenue Million Forecast, by Country 2020 & 2033
- Table 22: China Pharmaceutical Intermediates Market Revenue (Million) Forecast, by Application 2020 & 2033
- Table 23: Japan Pharmaceutical Intermediates Market Revenue (Million) Forecast, by Application 2020 & 2033
- Table 24: India Pharmaceutical Intermediates Market Revenue (Million) Forecast, by Application 2020 & 2033
- Table 25: South Korea Pharmaceutical Intermediates Market Revenue (Million) Forecast, by Application 2020 & 2033
- Table 26: Taiwan Pharmaceutical Intermediates Market Revenue (Million) Forecast, by Application 2020 & 2033
- Table 27: Australia Pharmaceutical Intermediates Market Revenue (Million) Forecast, by Application 2020 & 2033
- Table 28: Rest of Asia-Pacific Pharmaceutical Intermediates Market Revenue (Million) Forecast, by Application 2020 & 2033
- Table 29: Global Pharmaceutical Intermediates Market Revenue Million Forecast, by Country 2020 & 2033
- Table 30: Middle East Pharmaceutical Intermediates Market Revenue (Million) Forecast, by Application 2020 & 2033
- Table 31: Africa Pharmaceutical Intermediates Market Revenue (Million) Forecast, by Application 2020 & 2033
- Table 32: Global Pharmaceutical Intermediates Market Revenue Million Forecast, by Type 2020 & 2033
- Table 33: Global Pharmaceutical Intermediates Market Revenue Million Forecast, by Application 2020 & 2033
- Table 34: Global Pharmaceutical Intermediates Market Revenue Million Forecast, by End-User 2020 & 2033
- Table 35: Global Pharmaceutical Intermediates Market Revenue Million Forecast, by Country 2020 & 2033
- Table 36: United States Pharmaceutical Intermediates Market Revenue (Million) Forecast, by Application 2020 & 2033
- Table 37: Canada Pharmaceutical Intermediates Market Revenue (Million) Forecast, by Application 2020 & 2033
- Table 38: Mexico Pharmaceutical Intermediates Market Revenue (Million) Forecast, by Application 2020 & 2033
- Table 39: Global Pharmaceutical Intermediates Market Revenue Million Forecast, by Type 2020 & 2033
- Table 40: Global Pharmaceutical Intermediates Market Revenue Million Forecast, by Application 2020 & 2033
- Table 41: Global Pharmaceutical Intermediates Market Revenue Million Forecast, by End-User 2020 & 2033
- Table 42: Global Pharmaceutical Intermediates Market Revenue Million Forecast, by Country 2020 & 2033
- Table 43: Germany Pharmaceutical Intermediates Market Revenue (Million) Forecast, by Application 2020 & 2033
- Table 44: United Kingdom Pharmaceutical Intermediates Market Revenue (Million) Forecast, by Application 2020 & 2033
- Table 45: France Pharmaceutical Intermediates Market Revenue (Million) Forecast, by Application 2020 & 2033
- Table 46: Italy Pharmaceutical Intermediates Market Revenue (Million) Forecast, by Application 2020 & 2033
- Table 47: Spain Pharmaceutical Intermediates Market Revenue (Million) Forecast, by Application 2020 & 2033
- Table 48: Rest of Europe Pharmaceutical Intermediates Market Revenue (Million) Forecast, by Application 2020 & 2033
- Table 49: Global Pharmaceutical Intermediates Market Revenue Million Forecast, by Type 2020 & 2033
- Table 50: Global Pharmaceutical Intermediates Market Revenue Million Forecast, by Application 2020 & 2033
- Table 51: Global Pharmaceutical Intermediates Market Revenue Million Forecast, by End-User 2020 & 2033
- Table 52: Global Pharmaceutical Intermediates Market Revenue Million Forecast, by Country 2020 & 2033
- Table 53: China Pharmaceutical Intermediates Market Revenue (Million) Forecast, by Application 2020 & 2033
- Table 54: Japan Pharmaceutical Intermediates Market Revenue (Million) Forecast, by Application 2020 & 2033
- Table 55: India Pharmaceutical Intermediates Market Revenue (Million) Forecast, by Application 2020 & 2033
- Table 56: Australia Pharmaceutical Intermediates Market Revenue (Million) Forecast, by Application 2020 & 2033
- Table 57: South Korea Pharmaceutical Intermediates Market Revenue (Million) Forecast, by Application 2020 & 2033
- Table 58: Rest of Asia Pacific Pharmaceutical Intermediates Market Revenue (Million) Forecast, by Application 2020 & 2033
- Table 59: Global Pharmaceutical Intermediates Market Revenue Million Forecast, by Type 2020 & 2033
- Table 60: Global Pharmaceutical Intermediates Market Revenue Million Forecast, by Application 2020 & 2033
- Table 61: Global Pharmaceutical Intermediates Market Revenue Million Forecast, by End-User 2020 & 2033
- Table 62: Global Pharmaceutical Intermediates Market Revenue Million Forecast, by Country 2020 & 2033
- Table 63: GCC Pharmaceutical Intermediates Market Revenue (Million) Forecast, by Application 2020 & 2033
- Table 64: South Africa Pharmaceutical Intermediates Market Revenue (Million) Forecast, by Application 2020 & 2033
- Table 65: Rest of Middle East and Africa Pharmaceutical Intermediates Market Revenue (Million) Forecast, by Application 2020 & 2033
- Table 66: Global Pharmaceutical Intermediates Market Revenue Million Forecast, by Type 2020 & 2033
- Table 67: Global Pharmaceutical Intermediates Market Revenue Million Forecast, by Application 2020 & 2033
- Table 68: Global Pharmaceutical Intermediates Market Revenue Million Forecast, by End-User 2020 & 2033
- Table 69: Global Pharmaceutical Intermediates Market Revenue Million Forecast, by Country 2020 & 2033
- Table 70: Brazil Pharmaceutical Intermediates Market Revenue (Million) Forecast, by Application 2020 & 2033
- Table 71: Argentina Pharmaceutical Intermediates Market Revenue (Million) Forecast, by Application 2020 & 2033
- Table 72: Rest of South America Pharmaceutical Intermediates Market Revenue (Million) Forecast, by Application 2020 & 2033
Frequently Asked Questions
1. What is the projected Compound Annual Growth Rate (CAGR) of the Pharmaceutical Intermediates Market?
The projected CAGR is approximately 7.42%.
2. Which companies are prominent players in the Pharmaceutical Intermediates Market?
Key companies in the market include Vertellus Holdings LLC, Aceto Corporation, Lianhetech, Yin-sheng Bio-tech Co Ltd *List Not Exhaustive, Midas Pharma GmbH, Sanofi SAIS, BASF SE, Dishman Group, A R Life Science, Chiracon GmbH, Green Vision Life Sciences, Codexis Inc.
3. What are the main segments of the Pharmaceutical Intermediates Market?
The market segments include Type, Application, End-User.
4. Can you provide details about the market size?
The market size is estimated to be USD 42.31 Million as of 2022.
5. What are some drivers contributing to market growth?
Increasing Prevalence of Chronic Diseases; Growing R&D Initiatives and Activities in the Pharmaceutical Industry.
6. What are the notable trends driving market growth?
Cardiovascular Drugs Hold Significant Share in the Global Pharmaceutical Intermediates Market.
7. Are there any restraints impacting market growth?
Stringent Regulatory Issues Regarding Certain Pharmaceutical Intermediate Substances.
8. Can you provide examples of recent developments in the market?
In March 2022, Sumitomo Chemical Co., Ltd. announced that it will construct a new manufacturing plant for active pharmaceutical ingredients (APIs) and intermediates for small molecule drugs at its Oita Works (Oita City, Oita Prefecture, Japan). This project is to enhance the Company's capacity to supply a variety of high-quality APIs and intermediates in response to the increasing demand for small-molecule drugs.
9. What pricing options are available for accessing the report?
Pricing options include single-user, multi-user, and enterprise licenses priced at USD 4750, USD 5250, and USD 8750 respectively.
10. Is the market size provided in terms of value or volume?
The market size is provided in terms of value, measured in Million.
11. Are there any specific market keywords associated with the report?
Yes, the market keyword associated with the report is "Pharmaceutical Intermediates Market," which aids in identifying and referencing the specific market segment covered.
12. How do I determine which pricing option suits my needs best?
The pricing options vary based on user requirements and access needs. Individual users may opt for single-user licenses, while businesses requiring broader access may choose multi-user or enterprise licenses for cost-effective access to the report.
13. Are there any additional resources or data provided in the Pharmaceutical Intermediates Market report?
While the report offers comprehensive insights, it's advisable to review the specific contents or supplementary materials provided to ascertain if additional resources or data are available.
14. How can I stay updated on further developments or reports in the Pharmaceutical Intermediates Market?
To stay informed about further developments, trends, and reports in the Pharmaceutical Intermediates Market, consider subscribing to industry newsletters, following relevant companies and organizations, or regularly checking reputable industry news sources and publications.
Methodology
Step 1 - Identification of Relevant Samples Size from Population Database


Step 2 - Approaches for Defining Global Market Size (Value, Volume* & Price*)

Note*: In applicable scenarios
Step 3 - Data Sources
Primary Research
- Web Analytics
- Survey Reports
- Research Institute
- Latest Research Reports
- Opinion Leaders
Secondary Research
- Annual Reports
- White Paper
- Latest Press Release
- Industry Association
- Paid Database
- Investor Presentations

Step 4 - Data Triangulation
Involves using different sources of information in order to increase the validity of a study
These sources are likely to be stakeholders in a program - participants, other researchers, program staff, other community members, and so on.
Then we put all data in single framework & apply various statistical tools to find out the dynamic on the market.
During the analysis stage, feedback from the stakeholder groups would be compared to determine areas of agreement as well as areas of divergence
