
Key Insights
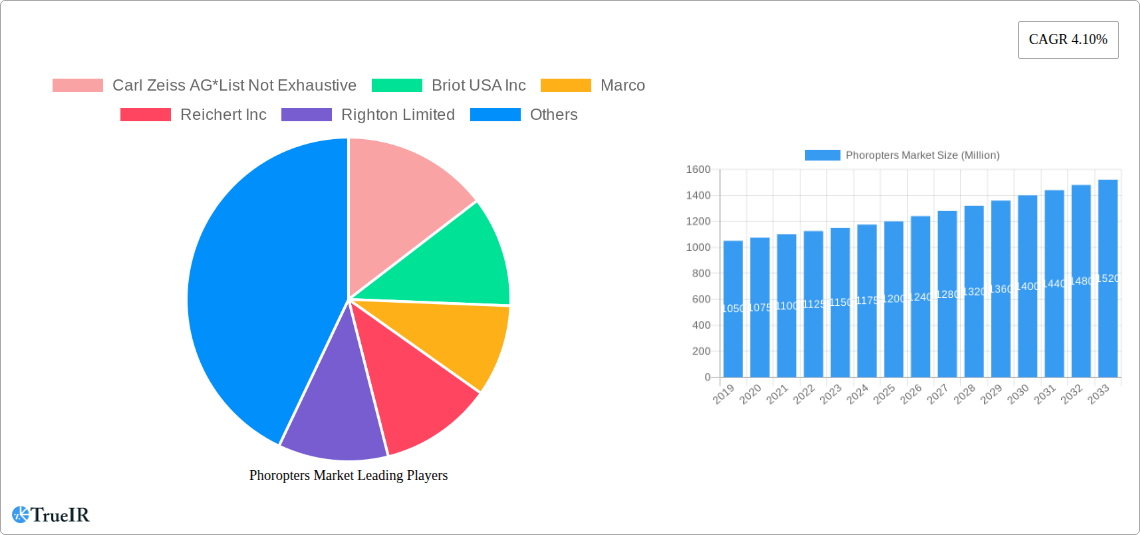
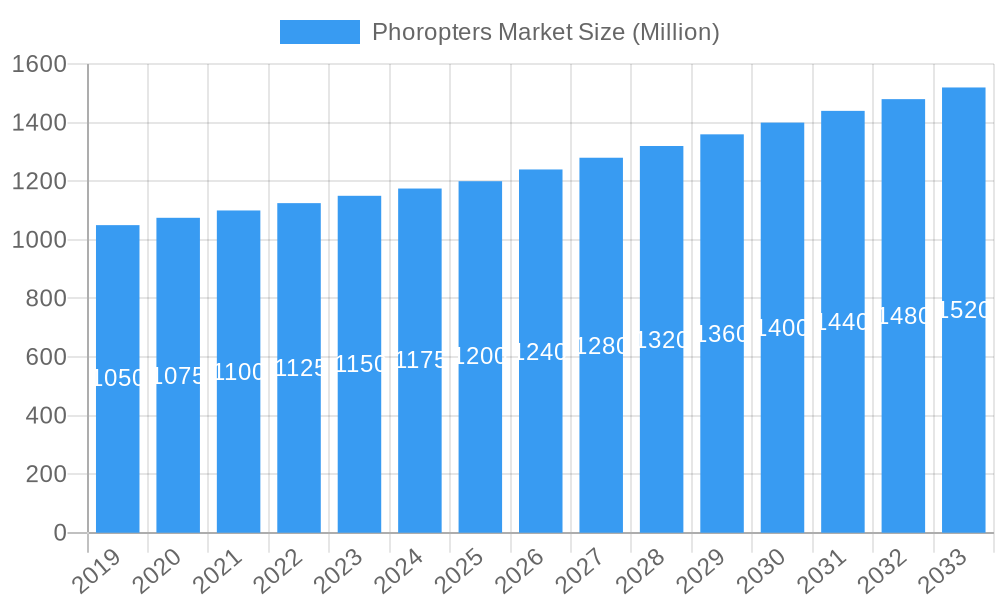
The global Phoropters Market is poised for steady growth, projected to reach a significant market size of approximately USD 1,250 million by 2025, with a Compound Annual Growth Rate (CAGR) of 4.10% extending through 2033. This expansion is primarily fueled by an increasing global prevalence of refractive errors, a growing aging population susceptible to vision impairments, and a heightened awareness regarding regular eye examinations. Technological advancements are also playing a crucial role, with the introduction of digital phoropters offering enhanced precision, improved patient comfort, and streamlined workflows for eye care professionals. The rising demand for sophisticated diagnostic tools in ophthalmology and optometry practices globally further reinforces this positive market trajectory.
Phoropters Market Market Size (In Billion)
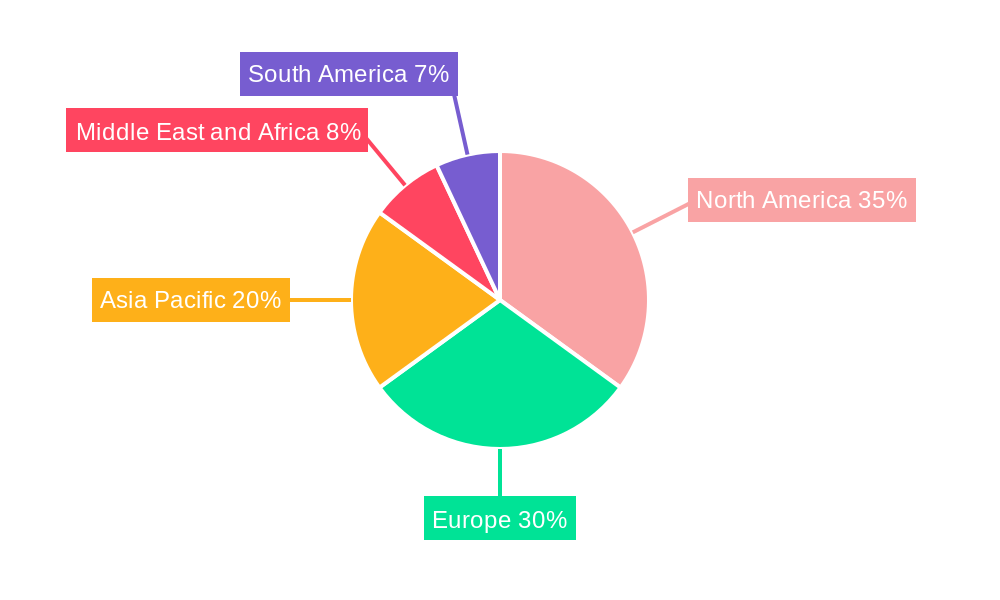
The market is segmented into Manual and Digital phoropters, with digital solutions gaining considerable traction due to their superior functionalities and adoption in advanced eye care settings. Hospitals and specialty clinics represent the dominant end-user segments, driven by their capacity for high-volume patient care and investment in cutting-edge medical equipment. While the market exhibits strong growth potential, certain restraints such as the initial high cost of advanced digital phoropters and the availability of alternative, albeit less precise, vision testing methods could pose challenges. However, the overarching trend towards improved accessibility to eye care services and the continuous drive for enhanced diagnostic accuracy are expected to outweigh these limitations, ensuring sustained market expansion. North America and Europe currently lead the market, with Asia Pacific showing the most rapid growth potential due to its large population and expanding healthcare infrastructure.
Phoropters Market Company Market Share
Phoropters Market: Comprehensive Analysis and Future Forecast (2019–2033)
This report provides an in-depth analysis of the global phoropters market, offering critical insights into market dynamics, growth drivers, competitive landscape, and future projections. With a study period spanning from 2019 to 2033, this research meticulously dissects the market's evolution, focusing on the base year of 2025 and a comprehensive forecast period of 2025–2033. The historical period of 2019–2024 is also thoroughly examined to establish a robust foundation for future predictions. Leveraging high-volume SEO keywords, this report is designed to enhance search rankings and engage a wide array of industry audiences, including eye care professionals, manufacturers, investors, and market analysts.
Phoropters Market Market Structure & Competitive Landscape
The global phoropters market exhibits a moderately concentrated structure, with a significant portion of the market share held by a few key players. Innovation remains a primary driver, fueled by advancements in digital phoropter technology and integrated diagnostic capabilities. Regulatory impacts, particularly concerning medical device approvals and patient safety standards, play a crucial role in shaping market entry and product development. Product substitutes, such as autorefractors and other ophthalmic diagnostic equipment, are present but do not fully replicate the comprehensive refractive error assessment capabilities of advanced phoropters. End-user segmentation, comprising hospitals, specialty clinics, and other end users like optometry practices, reveals diverse purchasing patterns and technology adoption rates. Mergers and acquisitions (M&A) trends are observed, albeit less frequent, as established companies seek to consolidate market position and expand their product portfolios. The market is characterized by a strategic focus on product differentiation, technological integration, and expanding distribution networks.
- Market Concentration: Dominated by a mix of established global manufacturers and regional specialists.
- Innovation Drivers: Digitalization, automation, AI integration for enhanced diagnostic accuracy, and miniaturization of devices.
- Regulatory Impacts: Stringent FDA, CE marking, and other regional regulatory approvals are essential for market access.
- Product Substitutes: Autorefractors, wavefront aberrometers, and manual trial lens sets.
- End-User Segmentation: Hospitals, ophthalmology clinics, optometry practices, and vision research centers.
- M&A Trends: Strategic acquisitions to gain market share, acquire new technologies, and expand geographical reach.
Phoropters Market Market Trends & Opportunities
The global phoropters market is poised for significant growth, driven by increasing global prevalence of vision disorders, an aging population, and rising demand for advanced eye care solutions. The market size is projected to witness a robust Compound Annual Growth Rate (CAGR) during the forecast period. Technological shifts are pivotal, with a pronounced trend towards the adoption of digital phoropters. These advanced systems offer enhanced precision, speed, and patient comfort compared to traditional manual phoropters. Integration of artificial intelligence (AI) and cloud-based data management are emerging trends, enabling more efficient workflows and personalized vision correction. Consumer preferences are increasingly leaning towards comprehensive eye examinations and sophisticated diagnostic tools that provide accurate and rapid results. Competitive dynamics are intensifying, with companies focusing on product innovation, strategic partnerships, and expanding their global footprints to capture market share. Opportunities abound in developing countries with a growing middle class and increasing awareness about eye health. The development of compact, portable, and user-friendly phoropter systems for telehealth applications and remote patient monitoring also presents a significant growth avenue. Furthermore, the growing demand for myopia management solutions and presbyopia correction treatments is expected to stimulate the market for sophisticated phoropters capable of precise measurements for these conditions. The increasing adoption of electronic health records (EHRs) is also driving the demand for digital phoropters that can seamlessly integrate with these systems, streamlining data management and improving the overall patient experience.
Dominant Markets & Segments in Phoropters Market
The Digital segment within the phoropters market is projected to exhibit the most substantial growth, outpacing the manual phoropter segment. This dominance is fueled by the inherent advantages of digital phoropters, including enhanced precision, automated testing sequences, and the ability to integrate with other diagnostic equipment. The Specialty Clinics end-user segment is also a key driver of market expansion, as these facilities often invest in state-of-the-art diagnostic equipment to provide specialized eye care services.
- Dominant Region: North America
- Key Growth Drivers: High disposable income, advanced healthcare infrastructure, strong emphasis on preventative eye care, and a high prevalence of age-related eye conditions.
- Detailed Analysis: North America, particularly the United States, leads in the adoption of advanced ophthalmic diagnostic technologies. The presence of major manufacturers and a robust reimbursement system for eye care services contribute significantly to this dominance. The increasing awareness among the population regarding the importance of regular eye check-ups further bolsters the demand for sophisticated phoropter systems in this region.
- Dominant Segment: Digital Phoropters
- Key Growth Drivers: Superior accuracy and speed compared to manual phoropters, integration capabilities with other diagnostic devices, enhanced patient experience, and potential for remote diagnostics.
- Detailed Analysis: The shift from manual to digital phoropters is a global trend, but it is particularly pronounced in developed markets. Digital phoropters offer a streamlined workflow for eye care professionals, reducing examination time and improving diagnostic outcomes. The ability to store and analyze patient data digitally also appeals to modern clinics seeking efficient practice management solutions.
- Dominant End User: Specialty Clinics
- Key Growth Drivers: Focus on specialized treatments (e.g., refractive surgery, glaucoma, retina), investment in high-end diagnostic equipment, and a patient base seeking comprehensive and precise eye care.
- Detailed Analysis: Specialty clinics, such as ophthalmology and optometry centers, are at the forefront of adopting advanced phoropter technology. These clinics cater to specific eye conditions and require the highest level of diagnostic accuracy, making digital phoropters an essential component of their diagnostic arsenal.
Phoropters Market Product Analysis
Product innovations in the phoropters market are primarily focused on enhancing diagnostic accuracy, improving patient comfort, and streamlining examination workflows. Digital phoropters are at the cutting edge, featuring advanced algorithms, integrated wavefront technology, and user-friendly interfaces. These advancements allow for faster and more precise refractive error measurements, including spherical, cylindrical, and axis corrections. Competitive advantages are derived from features such as automated testing, real-time data display, connectivity to electronic health records, and compact designs for better space utilization in clinics. The integration of AI is also emerging as a key differentiator, promising predictive diagnostics and personalized treatment recommendations.
Key Drivers, Barriers & Challenges in Phoropters Market
Key Drivers: The phoropters market is propelled by a confluence of factors. The increasing global prevalence of vision impairments, including myopia, hyperopia, and astigmatism, acts as a primary growth catalyst. An aging global population, prone to age-related eye conditions like cataracts and presbyopia, further amplifies the demand for accurate refractive diagnostics. Technological advancements, especially the ongoing transition from manual to sophisticated digital phoropters offering enhanced precision and efficiency, are significant drivers. Growing health awareness and an increased focus on preventative eye care, coupled with supportive government initiatives and reimbursement policies for ophthalmic services in many regions, also contribute to market expansion. The expanding healthcare infrastructure in emerging economies is creating new market opportunities.
Barriers & Challenges: Despite the positive outlook, the phoropters market faces several challenges. The high initial cost of advanced digital phoropters can be a significant barrier to adoption, particularly for smaller clinics and practitioners in developing countries. Stringent regulatory approvals and compliance requirements for medical devices can prolong product launch timelines and increase development costs. The availability of effective product substitutes, such as autorefractors, can sometimes limit the market penetration of phoropters for basic refractive assessments. Supply chain disruptions and the complexity of global distribution networks can also pose challenges, affecting product availability and lead times. Intense competition among established players and emerging manufacturers can lead to price pressures. The need for continuous training and adaptation to new technologies by eye care professionals also presents an adoption hurdle.
Growth Drivers in the Phoropters Market Market
Key growth drivers in the phoropters market include the escalating global burden of vision disorders, such as myopia and age-related macular degeneration, necessitating accurate diagnostic tools. The increasing demand for advanced vision correction procedures and the growing preference for digital, automated diagnostic solutions are also significant contributors. Economic factors such as rising disposable incomes in developing nations and improved healthcare spending are fueling market growth. Furthermore, supportive government policies promoting eye health initiatives and favorable reimbursement landscapes for ophthalmic services are crucial in driving market expansion. Technological innovations leading to more precise, efficient, and user-friendly phoropter systems are pivotal growth catalysts.
Challenges Impacting Phoropters Market Growth
Challenges impacting phoropters market growth encompass the high capital investment required for advanced digital phoropter systems, potentially limiting adoption by smaller eye care practices. Navigating complex and evolving regulatory landscapes across different geographical regions presents significant hurdles for market entry and product approval. Supply chain vulnerabilities and the intricacies of global logistics can lead to delays and increased operational costs. Intense competition among both established global players and emerging regional manufacturers may exert downward pressure on pricing. The need for continuous training and upskilling of healthcare professionals to effectively utilize advanced phoropter technology also poses a challenge.
Key Players Shaping the Phoropters Market Market
- Carl Zeiss AG
- Briot USA Inc
- Marco
- Reichert Inc
- Righton Limited
- Rexxam Co Ltd
- Topcon Corporation
- Huvitz Co Ltd
- NIDEK CO LTD
Significant Phoropters Market Industry Milestones
- May 2022: Visionix partnered with Right MFG. Co., Ltd. to accelerate growth for both companies. Visionix will become the exclusive partner of Right MFG and distribute Righton products in Europe, America, and Asia Pacific (excluding Japan and China). The companies will co-develop a new range of products for the eye care market.
- March 2021: Luneau Technology USA introduced its second-generation Visionix Eye Refract, a system that includes significant upgrades based on the 5.5 million refractions collected over five years using the first-generation product. The compact Eye Refract system comprises a highly automated, binocular, and dynamic digital phoropter combined with wavefront-based auto-refractometry and keratometry (AR/K), a digital acuity short chart, and an integrated lens analyzer.
Future Outlook for Phoropters Market Market
The future outlook for the phoropters market is exceptionally promising, driven by sustained innovation and increasing global demand for advanced eye care diagnostics. Strategic opportunities lie in the continued development of AI-powered phoropters, which promise to revolutionize diagnostic accuracy and personalize patient care. The expansion into emerging markets with growing healthcare expenditure and a rising middle class presents significant untapped potential. Furthermore, the development of integrated diagnostic platforms that combine phoropters with other ophthalmic devices and leverage cloud-based data management will be crucial for future growth. The increasing focus on telemedicine and remote patient monitoring also opens avenues for portable and connected phoropter solutions.
Phoropters Market Segmentation
-
1. Type
- 1.1. Manual
- 1.2. Digital
-
2. End User
- 2.1. Hospitals
- 2.2. Specialty Clinics
- 2.3. Other End Users
Phoropters Market Segmentation By Geography
-
1. North America
- 1.1. United States
- 1.2. Canada
- 1.3. Mexico
-
2. Europe
- 2.1. Germany
- 2.2. United Kingdom
- 2.3. France
- 2.4. Italy
- 2.5. Spain
- 2.6. Rest of Europe
-
3. Asia Pacific
- 3.1. China
- 3.2. Japan
- 3.3. India
- 3.4. Australia
- 3.5. South Korea
- 3.6. Rest of Asia Pacific
-
4. Middle East and Africa
- 4.1. GCC
- 4.2. South Africa
- 4.3. Rest of Middle East and Africa
-
5. South America
- 5.1. Brazil
- 5.2. Argentina
- 5.3. Rest of South America
Phoropters Market Regional Market Share
Geographic Coverage of Phoropters Market
Phoropters Market REPORT HIGHLIGHTS
| Aspects | Details |
|---|---|
| Study Period | 2020-2034 |
| Base Year | 2025 |
| Estimated Year | 2026 |
| Forecast Period | 2026-2034 |
| Historical Period | 2020-2025 |
| Growth Rate | CAGR of 4.10% from 2020-2034 |
| Segmentation |
|
Table of Contents
- 1. Introduction
- 1.1. Research Scope
- 1.2. Market Segmentation
- 1.3. Research Methodology
- 1.4. Definitions and Assumptions
- 2. Executive Summary
- 2.1. Introduction
- 3. Market Dynamics
- 3.1. Introduction
- 3.2. Market Drivers
- 3.2.1. Growing Prevalence and Recurrence of Eye Disorders; Technological Advancements
- 3.3. Market Restrains
- 3.3.1. High Installation Cost and Lack of Skilled Optometrists
- 3.4. Market Trends
- 3.4.1. Specialty Clinics Segment Hold Significant Share in the Phoropters Market
- 4. Market Factor Analysis
- 4.1. Porters Five Forces
- 4.2. Supply/Value Chain
- 4.3. PESTEL analysis
- 4.4. Market Entropy
- 4.5. Patent/Trademark Analysis
- 5. Global Phoropters Market Analysis, Insights and Forecast, 2020-2032
- 5.1. Market Analysis, Insights and Forecast - by Type
- 5.1.1. Manual
- 5.1.2. Digital
- 5.2. Market Analysis, Insights and Forecast - by End User
- 5.2.1. Hospitals
- 5.2.2. Specialty Clinics
- 5.2.3. Other End Users
- 5.3. Market Analysis, Insights and Forecast - by Region
- 5.3.1. North America
- 5.3.2. Europe
- 5.3.3. Asia Pacific
- 5.3.4. Middle East and Africa
- 5.3.5. South America
- 5.1. Market Analysis, Insights and Forecast - by Type
- 6. North America Phoropters Market Analysis, Insights and Forecast, 2020-2032
- 6.1. Market Analysis, Insights and Forecast - by Type
- 6.1.1. Manual
- 6.1.2. Digital
- 6.2. Market Analysis, Insights and Forecast - by End User
- 6.2.1. Hospitals
- 6.2.2. Specialty Clinics
- 6.2.3. Other End Users
- 6.1. Market Analysis, Insights and Forecast - by Type
- 7. Europe Phoropters Market Analysis, Insights and Forecast, 2020-2032
- 7.1. Market Analysis, Insights and Forecast - by Type
- 7.1.1. Manual
- 7.1.2. Digital
- 7.2. Market Analysis, Insights and Forecast - by End User
- 7.2.1. Hospitals
- 7.2.2. Specialty Clinics
- 7.2.3. Other End Users
- 7.1. Market Analysis, Insights and Forecast - by Type
- 8. Asia Pacific Phoropters Market Analysis, Insights and Forecast, 2020-2032
- 8.1. Market Analysis, Insights and Forecast - by Type
- 8.1.1. Manual
- 8.1.2. Digital
- 8.2. Market Analysis, Insights and Forecast - by End User
- 8.2.1. Hospitals
- 8.2.2. Specialty Clinics
- 8.2.3. Other End Users
- 8.1. Market Analysis, Insights and Forecast - by Type
- 9. Middle East and Africa Phoropters Market Analysis, Insights and Forecast, 2020-2032
- 9.1. Market Analysis, Insights and Forecast - by Type
- 9.1.1. Manual
- 9.1.2. Digital
- 9.2. Market Analysis, Insights and Forecast - by End User
- 9.2.1. Hospitals
- 9.2.2. Specialty Clinics
- 9.2.3. Other End Users
- 9.1. Market Analysis, Insights and Forecast - by Type
- 10. South America Phoropters Market Analysis, Insights and Forecast, 2020-2032
- 10.1. Market Analysis, Insights and Forecast - by Type
- 10.1.1. Manual
- 10.1.2. Digital
- 10.2. Market Analysis, Insights and Forecast - by End User
- 10.2.1. Hospitals
- 10.2.2. Specialty Clinics
- 10.2.3. Other End Users
- 10.1. Market Analysis, Insights and Forecast - by Type
- 11. North America Phoropters Market Analysis, Insights and Forecast, 2020-2032
- 11.1. Market Analysis, Insights and Forecast - By Country/Sub-region
- 11.1.1 United States
- 11.1.2 Canada
- 11.1.3 Mexico
- 12. Europe Phoropters Market Analysis, Insights and Forecast, 2020-2032
- 12.1. Market Analysis, Insights and Forecast - By Country/Sub-region
- 12.1.1 Germany
- 12.1.2 United Kingdom
- 12.1.3 France
- 12.1.4 Italy
- 12.1.5 Spain
- 12.1.6 Rest of Europe
- 13. Asia Pacific Phoropters Market Analysis, Insights and Forecast, 2020-2032
- 13.1. Market Analysis, Insights and Forecast - By Country/Sub-region
- 13.1.1 China
- 13.1.2 Japan
- 13.1.3 India
- 13.1.4 Australia
- 13.1.5 South Korea
- 13.1.6 Rest of Asia Pacific
- 14. Middle East and Africa Phoropters Market Analysis, Insights and Forecast, 2020-2032
- 14.1. Market Analysis, Insights and Forecast - By Country/Sub-region
- 14.1.1 GCC
- 14.1.2 South Africa
- 14.1.3 Rest of Middle East and Africa
- 15. South America Phoropters Market Analysis, Insights and Forecast, 2020-2032
- 15.1. Market Analysis, Insights and Forecast - By Country/Sub-region
- 15.1.1 Brazil
- 15.1.2 Argentina
- 15.1.3 Rest of South America
- 16. Competitive Analysis
- 16.1. Global Market Share Analysis 2025
- 16.2. Company Profiles
- 16.2.1 Carl Zeiss AG*List Not Exhaustive
- 16.2.1.1. Overview
- 16.2.1.2. Products
- 16.2.1.3. SWOT Analysis
- 16.2.1.4. Recent Developments
- 16.2.1.5. Financials (Based on Availability)
- 16.2.2 Briot USA Inc
- 16.2.2.1. Overview
- 16.2.2.2. Products
- 16.2.2.3. SWOT Analysis
- 16.2.2.4. Recent Developments
- 16.2.2.5. Financials (Based on Availability)
- 16.2.3 Marco
- 16.2.3.1. Overview
- 16.2.3.2. Products
- 16.2.3.3. SWOT Analysis
- 16.2.3.4. Recent Developments
- 16.2.3.5. Financials (Based on Availability)
- 16.2.4 Reichert Inc
- 16.2.4.1. Overview
- 16.2.4.2. Products
- 16.2.4.3. SWOT Analysis
- 16.2.4.4. Recent Developments
- 16.2.4.5. Financials (Based on Availability)
- 16.2.5 Righton Limited
- 16.2.5.1. Overview
- 16.2.5.2. Products
- 16.2.5.3. SWOT Analysis
- 16.2.5.4. Recent Developments
- 16.2.5.5. Financials (Based on Availability)
- 16.2.6 Rexxam Co Ltd
- 16.2.6.1. Overview
- 16.2.6.2. Products
- 16.2.6.3. SWOT Analysis
- 16.2.6.4. Recent Developments
- 16.2.6.5. Financials (Based on Availability)
- 16.2.7 Topcon Corporation
- 16.2.7.1. Overview
- 16.2.7.2. Products
- 16.2.7.3. SWOT Analysis
- 16.2.7.4. Recent Developments
- 16.2.7.5. Financials (Based on Availability)
- 16.2.8 Huvitz Co Ltd
- 16.2.8.1. Overview
- 16.2.8.2. Products
- 16.2.8.3. SWOT Analysis
- 16.2.8.4. Recent Developments
- 16.2.8.5. Financials (Based on Availability)
- 16.2.9 NIDEK CO LTD
- 16.2.9.1. Overview
- 16.2.9.2. Products
- 16.2.9.3. SWOT Analysis
- 16.2.9.4. Recent Developments
- 16.2.9.5. Financials (Based on Availability)
- 16.2.1 Carl Zeiss AG*List Not Exhaustive
List of Figures
- Figure 1: Global Phoropters Market Revenue Breakdown (Million, %) by Region 2025 & 2033
- Figure 2: North America Phoropters Market Revenue (Million), by Country 2025 & 2033
- Figure 3: North America Phoropters Market Revenue Share (%), by Country 2025 & 2033
- Figure 4: Europe Phoropters Market Revenue (Million), by Country 2025 & 2033
- Figure 5: Europe Phoropters Market Revenue Share (%), by Country 2025 & 2033
- Figure 6: Asia Pacific Phoropters Market Revenue (Million), by Country 2025 & 2033
- Figure 7: Asia Pacific Phoropters Market Revenue Share (%), by Country 2025 & 2033
- Figure 8: Middle East and Africa Phoropters Market Revenue (Million), by Country 2025 & 2033
- Figure 9: Middle East and Africa Phoropters Market Revenue Share (%), by Country 2025 & 2033
- Figure 10: South America Phoropters Market Revenue (Million), by Country 2025 & 2033
- Figure 11: South America Phoropters Market Revenue Share (%), by Country 2025 & 2033
- Figure 12: North America Phoropters Market Revenue (Million), by Type 2025 & 2033
- Figure 13: North America Phoropters Market Revenue Share (%), by Type 2025 & 2033
- Figure 14: North America Phoropters Market Revenue (Million), by End User 2025 & 2033
- Figure 15: North America Phoropters Market Revenue Share (%), by End User 2025 & 2033
- Figure 16: North America Phoropters Market Revenue (Million), by Country 2025 & 2033
- Figure 17: North America Phoropters Market Revenue Share (%), by Country 2025 & 2033
- Figure 18: Europe Phoropters Market Revenue (Million), by Type 2025 & 2033
- Figure 19: Europe Phoropters Market Revenue Share (%), by Type 2025 & 2033
- Figure 20: Europe Phoropters Market Revenue (Million), by End User 2025 & 2033
- Figure 21: Europe Phoropters Market Revenue Share (%), by End User 2025 & 2033
- Figure 22: Europe Phoropters Market Revenue (Million), by Country 2025 & 2033
- Figure 23: Europe Phoropters Market Revenue Share (%), by Country 2025 & 2033
- Figure 24: Asia Pacific Phoropters Market Revenue (Million), by Type 2025 & 2033
- Figure 25: Asia Pacific Phoropters Market Revenue Share (%), by Type 2025 & 2033
- Figure 26: Asia Pacific Phoropters Market Revenue (Million), by End User 2025 & 2033
- Figure 27: Asia Pacific Phoropters Market Revenue Share (%), by End User 2025 & 2033
- Figure 28: Asia Pacific Phoropters Market Revenue (Million), by Country 2025 & 2033
- Figure 29: Asia Pacific Phoropters Market Revenue Share (%), by Country 2025 & 2033
- Figure 30: Middle East and Africa Phoropters Market Revenue (Million), by Type 2025 & 2033
- Figure 31: Middle East and Africa Phoropters Market Revenue Share (%), by Type 2025 & 2033
- Figure 32: Middle East and Africa Phoropters Market Revenue (Million), by End User 2025 & 2033
- Figure 33: Middle East and Africa Phoropters Market Revenue Share (%), by End User 2025 & 2033
- Figure 34: Middle East and Africa Phoropters Market Revenue (Million), by Country 2025 & 2033
- Figure 35: Middle East and Africa Phoropters Market Revenue Share (%), by Country 2025 & 2033
- Figure 36: South America Phoropters Market Revenue (Million), by Type 2025 & 2033
- Figure 37: South America Phoropters Market Revenue Share (%), by Type 2025 & 2033
- Figure 38: South America Phoropters Market Revenue (Million), by End User 2025 & 2033
- Figure 39: South America Phoropters Market Revenue Share (%), by End User 2025 & 2033
- Figure 40: South America Phoropters Market Revenue (Million), by Country 2025 & 2033
- Figure 41: South America Phoropters Market Revenue Share (%), by Country 2025 & 2033
List of Tables
- Table 1: Global Phoropters Market Revenue Million Forecast, by Region 2020 & 2033
- Table 2: Global Phoropters Market Revenue Million Forecast, by Type 2020 & 2033
- Table 3: Global Phoropters Market Revenue Million Forecast, by End User 2020 & 2033
- Table 4: Global Phoropters Market Revenue Million Forecast, by Region 2020 & 2033
- Table 5: Global Phoropters Market Revenue Million Forecast, by Country 2020 & 2033
- Table 6: United States Phoropters Market Revenue (Million) Forecast, by Application 2020 & 2033
- Table 7: Canada Phoropters Market Revenue (Million) Forecast, by Application 2020 & 2033
- Table 8: Mexico Phoropters Market Revenue (Million) Forecast, by Application 2020 & 2033
- Table 9: Global Phoropters Market Revenue Million Forecast, by Country 2020 & 2033
- Table 10: Germany Phoropters Market Revenue (Million) Forecast, by Application 2020 & 2033
- Table 11: United Kingdom Phoropters Market Revenue (Million) Forecast, by Application 2020 & 2033
- Table 12: France Phoropters Market Revenue (Million) Forecast, by Application 2020 & 2033
- Table 13: Italy Phoropters Market Revenue (Million) Forecast, by Application 2020 & 2033
- Table 14: Spain Phoropters Market Revenue (Million) Forecast, by Application 2020 & 2033
- Table 15: Rest of Europe Phoropters Market Revenue (Million) Forecast, by Application 2020 & 2033
- Table 16: Global Phoropters Market Revenue Million Forecast, by Country 2020 & 2033
- Table 17: China Phoropters Market Revenue (Million) Forecast, by Application 2020 & 2033
- Table 18: Japan Phoropters Market Revenue (Million) Forecast, by Application 2020 & 2033
- Table 19: India Phoropters Market Revenue (Million) Forecast, by Application 2020 & 2033
- Table 20: Australia Phoropters Market Revenue (Million) Forecast, by Application 2020 & 2033
- Table 21: South Korea Phoropters Market Revenue (Million) Forecast, by Application 2020 & 2033
- Table 22: Rest of Asia Pacific Phoropters Market Revenue (Million) Forecast, by Application 2020 & 2033
- Table 23: Global Phoropters Market Revenue Million Forecast, by Country 2020 & 2033
- Table 24: GCC Phoropters Market Revenue (Million) Forecast, by Application 2020 & 2033
- Table 25: South Africa Phoropters Market Revenue (Million) Forecast, by Application 2020 & 2033
- Table 26: Rest of Middle East and Africa Phoropters Market Revenue (Million) Forecast, by Application 2020 & 2033
- Table 27: Global Phoropters Market Revenue Million Forecast, by Country 2020 & 2033
- Table 28: Brazil Phoropters Market Revenue (Million) Forecast, by Application 2020 & 2033
- Table 29: Argentina Phoropters Market Revenue (Million) Forecast, by Application 2020 & 2033
- Table 30: Rest of South America Phoropters Market Revenue (Million) Forecast, by Application 2020 & 2033
- Table 31: Global Phoropters Market Revenue Million Forecast, by Type 2020 & 2033
- Table 32: Global Phoropters Market Revenue Million Forecast, by End User 2020 & 2033
- Table 33: Global Phoropters Market Revenue Million Forecast, by Country 2020 & 2033
- Table 34: United States Phoropters Market Revenue (Million) Forecast, by Application 2020 & 2033
- Table 35: Canada Phoropters Market Revenue (Million) Forecast, by Application 2020 & 2033
- Table 36: Mexico Phoropters Market Revenue (Million) Forecast, by Application 2020 & 2033
- Table 37: Global Phoropters Market Revenue Million Forecast, by Type 2020 & 2033
- Table 38: Global Phoropters Market Revenue Million Forecast, by End User 2020 & 2033
- Table 39: Global Phoropters Market Revenue Million Forecast, by Country 2020 & 2033
- Table 40: Germany Phoropters Market Revenue (Million) Forecast, by Application 2020 & 2033
- Table 41: United Kingdom Phoropters Market Revenue (Million) Forecast, by Application 2020 & 2033
- Table 42: France Phoropters Market Revenue (Million) Forecast, by Application 2020 & 2033
- Table 43: Italy Phoropters Market Revenue (Million) Forecast, by Application 2020 & 2033
- Table 44: Spain Phoropters Market Revenue (Million) Forecast, by Application 2020 & 2033
- Table 45: Rest of Europe Phoropters Market Revenue (Million) Forecast, by Application 2020 & 2033
- Table 46: Global Phoropters Market Revenue Million Forecast, by Type 2020 & 2033
- Table 47: Global Phoropters Market Revenue Million Forecast, by End User 2020 & 2033
- Table 48: Global Phoropters Market Revenue Million Forecast, by Country 2020 & 2033
- Table 49: China Phoropters Market Revenue (Million) Forecast, by Application 2020 & 2033
- Table 50: Japan Phoropters Market Revenue (Million) Forecast, by Application 2020 & 2033
- Table 51: India Phoropters Market Revenue (Million) Forecast, by Application 2020 & 2033
- Table 52: Australia Phoropters Market Revenue (Million) Forecast, by Application 2020 & 2033
- Table 53: South Korea Phoropters Market Revenue (Million) Forecast, by Application 2020 & 2033
- Table 54: Rest of Asia Pacific Phoropters Market Revenue (Million) Forecast, by Application 2020 & 2033
- Table 55: Global Phoropters Market Revenue Million Forecast, by Type 2020 & 2033
- Table 56: Global Phoropters Market Revenue Million Forecast, by End User 2020 & 2033
- Table 57: Global Phoropters Market Revenue Million Forecast, by Country 2020 & 2033
- Table 58: GCC Phoropters Market Revenue (Million) Forecast, by Application 2020 & 2033
- Table 59: South Africa Phoropters Market Revenue (Million) Forecast, by Application 2020 & 2033
- Table 60: Rest of Middle East and Africa Phoropters Market Revenue (Million) Forecast, by Application 2020 & 2033
- Table 61: Global Phoropters Market Revenue Million Forecast, by Type 2020 & 2033
- Table 62: Global Phoropters Market Revenue Million Forecast, by End User 2020 & 2033
- Table 63: Global Phoropters Market Revenue Million Forecast, by Country 2020 & 2033
- Table 64: Brazil Phoropters Market Revenue (Million) Forecast, by Application 2020 & 2033
- Table 65: Argentina Phoropters Market Revenue (Million) Forecast, by Application 2020 & 2033
- Table 66: Rest of South America Phoropters Market Revenue (Million) Forecast, by Application 2020 & 2033
Frequently Asked Questions
1. What is the projected Compound Annual Growth Rate (CAGR) of the Phoropters Market?
The projected CAGR is approximately 4.10%.
2. Which companies are prominent players in the Phoropters Market?
Key companies in the market include Carl Zeiss AG*List Not Exhaustive, Briot USA Inc, Marco, Reichert Inc, Righton Limited, Rexxam Co Ltd, Topcon Corporation, Huvitz Co Ltd, NIDEK CO LTD.
3. What are the main segments of the Phoropters Market?
The market segments include Type, End User.
4. Can you provide details about the market size?
The market size is estimated to be USD XX Million as of 2022.
5. What are some drivers contributing to market growth?
Growing Prevalence and Recurrence of Eye Disorders; Technological Advancements.
6. What are the notable trends driving market growth?
Specialty Clinics Segment Hold Significant Share in the Phoropters Market.
7. Are there any restraints impacting market growth?
High Installation Cost and Lack of Skilled Optometrists.
8. Can you provide examples of recent developments in the market?
May 2022: Visionix partnered with Right MFG. Co., Ltd. to accelerate growth for both companies. Visionix will become the exclusive partner of Right MFG and distribute Righton products in Europe, America, and Asia Pacific (excluding Japan and China). The companies will co-develop a new range of products for the eye care market.
9. What pricing options are available for accessing the report?
Pricing options include single-user, multi-user, and enterprise licenses priced at USD 4750, USD 5250, and USD 8750 respectively.
10. Is the market size provided in terms of value or volume?
The market size is provided in terms of value, measured in Million.
11. Are there any specific market keywords associated with the report?
Yes, the market keyword associated with the report is "Phoropters Market," which aids in identifying and referencing the specific market segment covered.
12. How do I determine which pricing option suits my needs best?
The pricing options vary based on user requirements and access needs. Individual users may opt for single-user licenses, while businesses requiring broader access may choose multi-user or enterprise licenses for cost-effective access to the report.
13. Are there any additional resources or data provided in the Phoropters Market report?
While the report offers comprehensive insights, it's advisable to review the specific contents or supplementary materials provided to ascertain if additional resources or data are available.
14. How can I stay updated on further developments or reports in the Phoropters Market?
To stay informed about further developments, trends, and reports in the Phoropters Market, consider subscribing to industry newsletters, following relevant companies and organizations, or regularly checking reputable industry news sources and publications.
Methodology
Step 1 - Identification of Relevant Samples Size from Population Database


Step 2 - Approaches for Defining Global Market Size (Value, Volume* & Price*)

Note*: In applicable scenarios
Step 3 - Data Sources
Primary Research
- Web Analytics
- Survey Reports
- Research Institute
- Latest Research Reports
- Opinion Leaders
Secondary Research
- Annual Reports
- White Paper
- Latest Press Release
- Industry Association
- Paid Database
- Investor Presentations

Step 4 - Data Triangulation
Involves using different sources of information in order to increase the validity of a study
These sources are likely to be stakeholders in a program - participants, other researchers, program staff, other community members, and so on.
Then we put all data in single framework & apply various statistical tools to find out the dynamic on the market.
During the analysis stage, feedback from the stakeholder groups would be compared to determine areas of agreement as well as areas of divergence
