

Key Insights
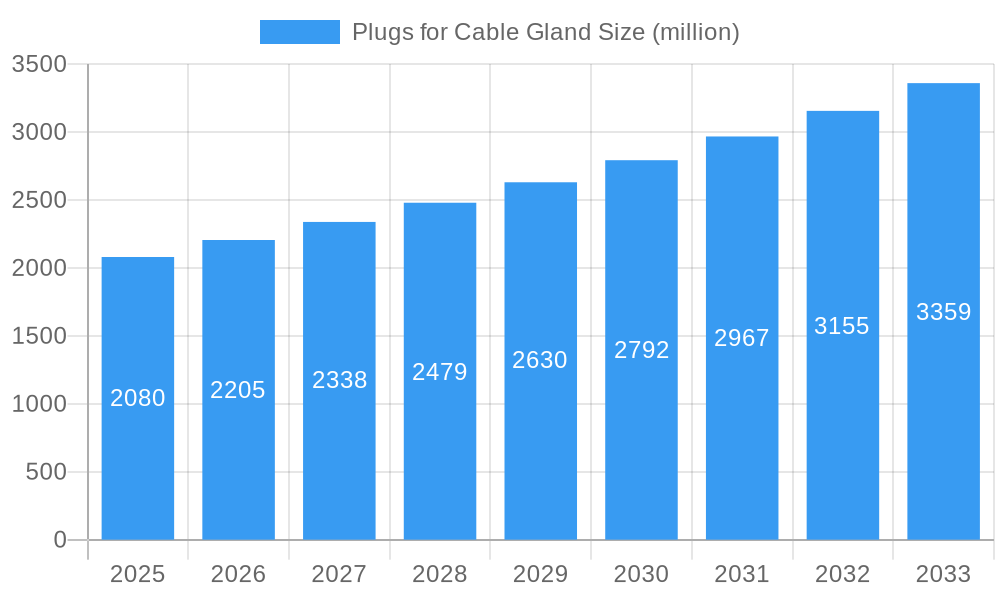
The global market for Plugs for Cable Glands is projected to reach a significant size of USD 2.08 billion in 2025, experiencing robust growth with a Compound Annual Growth Rate (CAGR) of 6.02% through to 2033. This upward trajectory is fueled by several critical drivers, including the expanding industrial infrastructure across sectors like Oil & Gas, Mining, and Construction, which require dependable cable management solutions. The increasing complexity of electrical systems and the growing emphasis on safety and environmental protection further propel the demand for specialized cable gland plugs that ensure secure sealing and prevent ingress of contaminants. Furthermore, advancements in material science, leading to the development of more durable and resistant plastic and nylon variants, are enhancing product appeal and expanding their applicability in demanding environments. The growing adoption of these plugs in emerging sectors such as Renewable Energy and Electric Vehicle charging infrastructure also represents a key growth avenue.
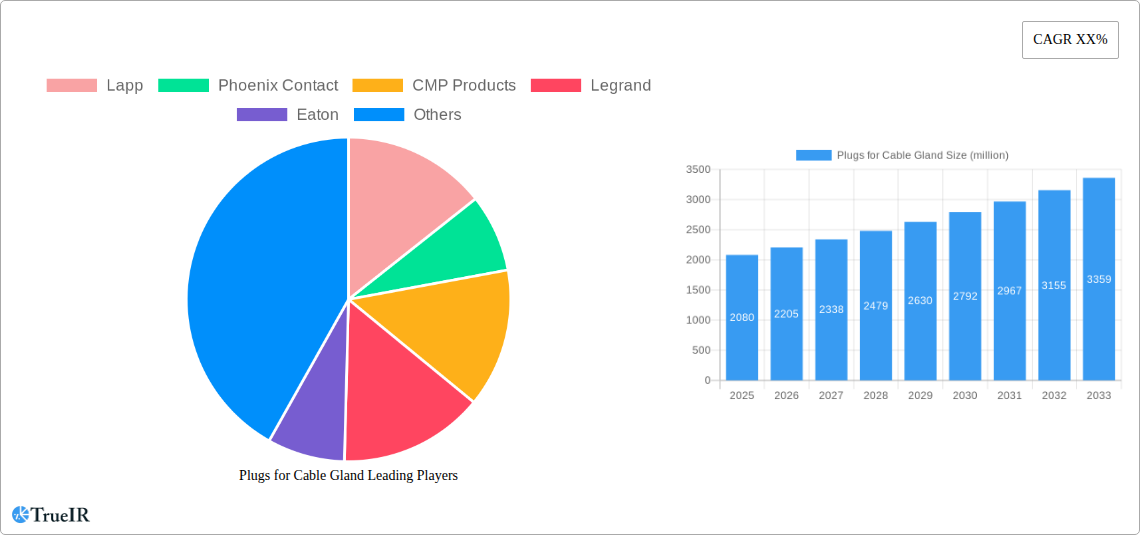
Plugs for Cable Gland Market Size (In Billion)
The market dynamics for Plugs for Cable Gland are characterized by evolving trends such as the increasing demand for flame-retardant and explosion-proof solutions, particularly within the Oil & Gas and Chemical industries. The shift towards smart manufacturing and automation in industrial settings necessitates sophisticated cable gland solutions that can withstand harsh operational conditions and maintain system integrity. While the market exhibits strong growth potential, it faces certain restraints. Stringent regulatory compliance and the need for certifications for specific applications can pose challenges for manufacturers. Additionally, the presence of substitute sealing solutions and the price sensitivity in certain market segments could influence adoption rates. However, ongoing innovation in product design, focusing on ease of installation, enhanced sealing capabilities, and wider temperature resistance, is expected to overcome these limitations and sustain the market's expansion. The competitive landscape is shaped by established players like Lapp, Phoenix Contact, and Eaton, who are focusing on product diversification and strategic partnerships to maintain their market positions.
Plugs for Cable Gland Company Market Share
This in-depth report provides a comprehensive analysis of the global Plugs for Cable Gland market, offering insights into its structure, competitive landscape, trends, opportunities, and future outlook. Leveraging high-volume keywords, this report is designed for SEO optimization and to engage key industry stakeholders across sectors like Oil and Gas, Mining, Construction, Railway, Chemical, Aerospace, and Power and Energy. Our analysis covers the study period from 2019 to 2033, with a base year of 2025 and a forecast period of 2025–2033.
Plugs for Cable Gland Market Structure & Competitive Landscape
The global Plugs for Cable Gland market exhibits a moderately concentrated structure, with a few dominant players controlling a significant market share estimated at over 60 billion. Innovation is a key driver, fueled by stringent safety regulations and the increasing demand for robust and reliable cable protection solutions in harsh industrial environments. Regulatory impacts are substantial, with international standards like IEC and ATEX dictating product design and performance, particularly for applications in hazardous areas. Product substitutes, while limited due to the specialized nature of cable gland plugs, include sealing compounds and specialized tape for less demanding applications, representing a market of approximately 5 billion. End-user segmentation reveals that the Oil and Gas and Power and Energy sectors collectively account for over 50 billion in demand, followed by Mining and Construction, each contributing an estimated 30 billion and 20 billion respectively. Mergers and Acquisitions (M&A) activity, though sporadic, has seen significant consolidation, with a total deal value of over 2 billion in the historical period, aimed at expanding product portfolios and market reach. Key M&A trends indicate a focus on acquiring companies with specialized manufacturing capabilities or strong distribution networks in emerging economies.
Plugs for Cable Gland Market Trends & Opportunities
The Plugs for Cable Gland market is poised for substantial growth, driven by an escalating global demand for industrial infrastructure development and the increasing adoption of automation and digitalization across various sectors. The market size, valued at an estimated 150 billion in the base year 2025, is projected to expand at a Compound Annual Growth Rate (CAGR) of approximately 6.5% during the forecast period of 2025–2033, reaching an estimated 250 billion by 2033. Technological shifts are a significant trend, with a growing emphasis on the development of smart cable glands integrated with IoT capabilities for real-time monitoring and predictive maintenance. Consumer preferences are increasingly leaning towards materials offering enhanced durability, corrosion resistance, and flame retardancy, leading to a greater demand for advanced plastic and brass variants. The competitive dynamics are characterized by intense product innovation, a focus on cost-effectiveness, and strategic partnerships aimed at expanding global footprints. The market penetration rate for specialized cable gland plugs in new industrial installations is expected to increase by over 15% in the next decade. Opportunities lie in the burgeoning renewable energy sector, the expansion of smart grid infrastructure, and the retrofitting of older industrial facilities with advanced safety and protection systems. The increasing adoption of electric vehicles (EVs) and the associated charging infrastructure also presents a nascent but rapidly growing market segment for cable gland plugs. Furthermore, the demand for customized solutions catering to unique environmental conditions in industries like Aerospace and Chemical is creating niche market opportunities. The report anticipates a surge in demand for explosion-proof and intrinsically safe cable gland plugs, especially in regions with stringent safety regulations and a high concentration of hazardous industrial operations.
Dominant Markets & Segments in Plugs for Cable Gland
The Oil and Gas sector stands as the dominant market segment for Plugs for Cable Gland, driven by the rigorous safety requirements and the continuous need for reliable cable management in exploration, production, and refining operations. This segment alone is estimated to contribute over 60 billion to the global market by 2025. Key growth drivers include massive infrastructure investments in offshore oil fields and the expansion of pipelines in emerging economies. The Power and Energy sector follows closely, with an estimated market value of 50 billion, fueled by the construction of new power plants, the modernization of existing grids, and the growth of renewable energy installations like wind farms and solar power projects. Infrastructure development, particularly in rapidly urbanizing regions, propels the Construction segment, projected at 25 billion, as new commercial and residential buildings require robust electrical infrastructure. The Railway sector, estimated at 15 billion, is witnessing increased demand due to the electrification of rail networks and the deployment of advanced signaling and communication systems. The Chemical industry, valued at 10 billion, requires specialized plugs for corrosive environments and hazardous zones. Aerospace applications, though smaller in volume, demand highly specialized, high-performance plugs, contributing approximately 5 billion. The "Others" category, encompassing sectors like telecommunications and industrial automation, represents a growing segment of 10 billion.
Within product types, Brass plugs are currently leading the market, valued at approximately 90 billion, due to their inherent strength, corrosion resistance, and widespread use in various industrial applications. Plastic and Nylon plugs, valued at 40 billion and 20 billion respectively, are gaining traction due to their lightweight nature, cost-effectiveness, and suitability for specific environmental conditions, particularly in less demanding industrial settings and for indoor applications. The "Other" types, including specialized composite materials, hold a market share of approximately 10 billion, with potential for growth driven by material science advancements.
Plugs for Cable Gland Product Analysis
Product innovation in Plugs for Cable Gland is centered on enhancing environmental resistance, improving sealing capabilities, and ensuring compliance with increasingly stringent safety standards. Manufacturers are developing plugs with advanced materials offering superior resistance to extreme temperatures, chemicals, and UV radiation. Innovations also include designs that simplify installation and maintenance, reducing downtime for industrial operations. The competitive advantage for key players lies in offering a comprehensive range of certified products for hazardous and explosion-proof environments, along with tailored solutions for specific industry needs, thereby ensuring superior performance and reliability.
Key Drivers, Barriers & Challenges in Plugs for Cable Gland
Key Drivers:
- Increasing industrialization and infrastructure development globally.
- Stringent safety regulations and demand for explosion-proof solutions.
- Growth in the renewable energy sector and electrification initiatives.
- Technological advancements leading to more durable and efficient products.
- Demand for enhanced cable protection in harsh environments.
Key Challenges & Restraints:
- Supply chain disruptions and volatility in raw material prices.
- Intense price competition among manufacturers.
- Complex and varied international regulatory frameworks.
- Slower adoption rates in less developed economies.
- Development of alternative, albeit less comprehensive, cable sealing methods.
Growth Drivers in the Plugs for Cable Gland Market
The Plugs for Cable Gland market's growth is propelled by the escalating global investment in industrial infrastructure, especially in emerging economies. The increasing stringency of safety regulations worldwide, particularly those mandating explosion-proof solutions for hazardous environments, is a significant catalyst. The burgeoning renewable energy sector, encompassing wind, solar, and hydro power, requires robust and reliable cable management systems. Technological advancements in material science are leading to the development of more durable, corrosion-resistant, and flame-retardant cable gland plugs. Furthermore, the global trend towards electrification across various industries, from transportation to manufacturing, is creating a consistent demand for effective cable protection.
Challenges Impacting Plugs for Cable Gland Growth
The Plugs for Cable Gland market faces several challenges. Global supply chain disruptions, coupled with the volatility in raw material prices, particularly for brass and specialized plastics, can impact manufacturing costs and product availability. Intense price competition among numerous manufacturers can put pressure on profit margins. Navigating the complex and often varied international regulatory frameworks for electrical safety and hazardous area classification presents a significant hurdle for global expansion. Additionally, the slower adoption of advanced cable gland solutions in less developed economies, where cost considerations may outweigh advanced safety features, can temper growth. The emergence of alternative, though often less robust, cable sealing methods also poses a competitive threat.
Key Players Shaping the Plugs for Cable Gland Market
- Lapp
- Phoenix Contact
- CMP Products
- Legrand
- Eaton
- HUMMEL AG
- ABB
- Jacob
- Emerson
- TE Connectivity
Significant Plugs for Cable Gland Industry Milestones
- 2019: Increased adoption of ATEX-certified cable glands in European chemical plants.
- 2020: Introduction of smart cable glands with IoT capabilities by several leading manufacturers.
- 2021: Growing demand for halogen-free and RoHS-compliant plugs in the electronics sector.
- 2022: Significant investments in R&D for advanced composite material plugs.
- 2023: Mergers and acquisitions aimed at consolidating market share and expanding product portfolios.
- 2024: Enhanced focus on sustainable and recyclable materials in plug manufacturing.
Future Outlook for Plugs for Cable Gland Market
The future outlook for the Plugs for Cable Gland market is overwhelmingly positive, with sustained growth projected through 2033. Key growth catalysts include the ongoing global push for industrial automation, the expansion of critical infrastructure in developing nations, and the increasing electrification of transportation and energy systems. Strategic opportunities lie in developing smart, connected cable gland solutions that offer real-time monitoring and predictive maintenance capabilities, catering to the evolving needs of Industry 4.0. The market potential for environmentally robust and intrinsically safe plugs remains significant, particularly in sectors prone to hazardous conditions. The increasing emphasis on safety and compliance will continue to drive demand for certified and high-performance cable gland plugs, solidifying their indispensable role in modern industrial applications.
Plugs for Cable Gland Segmentation
-
1. Application
- 1.1. Oil and Gas
- 1.2. Mining
- 1.3. Construction
- 1.4. Railway
- 1.5. Chemical
- 1.6. Aerospace
- 1.7. Power and Energy
- 1.8. Others
-
2. Types
- 2.1. Plastic
- 2.2. Brass
- 2.3. Nylon
- 2.4. Other
Plugs for Cable Gland Segmentation By Geography
-
1. North America
- 1.1. United States
- 1.2. Canada
- 1.3. Mexico
-
2. South America
- 2.1. Brazil
- 2.2. Argentina
- 2.3. Rest of South America
-
3. Europe
- 3.1. United Kingdom
- 3.2. Germany
- 3.3. France
- 3.4. Italy
- 3.5. Spain
- 3.6. Russia
- 3.7. Benelux
- 3.8. Nordics
- 3.9. Rest of Europe
-
4. Middle East & Africa
- 4.1. Turkey
- 4.2. Israel
- 4.3. GCC
- 4.4. North Africa
- 4.5. South Africa
- 4.6. Rest of Middle East & Africa
-
5. Asia Pacific
- 5.1. China
- 5.2. India
- 5.3. Japan
- 5.4. South Korea
- 5.5. ASEAN
- 5.6. Oceania
- 5.7. Rest of Asia Pacific
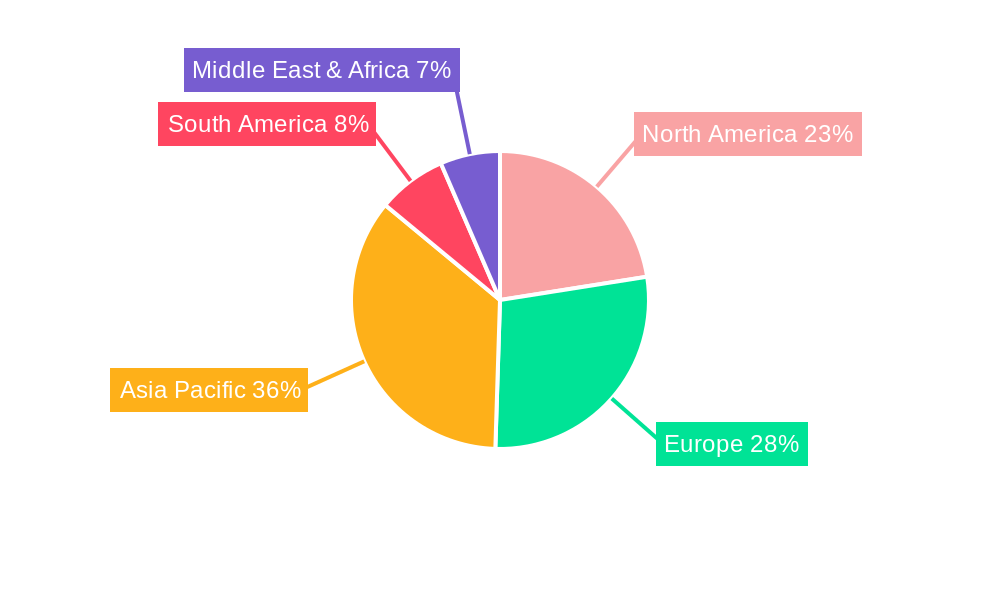
Plugs for Cable Gland Regional Market Share
Geographic Coverage of Plugs for Cable Gland
Plugs for Cable Gland REPORT HIGHLIGHTS
| Aspects | Details |
|---|---|
| Study Period | 2020-2034 |
| Base Year | 2025 |
| Estimated Year | 2026 |
| Forecast Period | 2026-2034 |
| Historical Period | 2020-2025 |
| Growth Rate | CAGR of 5% from 2020-2034 |
| Segmentation |
|
Table of Contents
- 1. Introduction
- 1.1. Research Scope
- 1.2. Market Segmentation
- 1.3. Research Methodology
- 1.4. Definitions and Assumptions
- 2. Executive Summary
- 2.1. Introduction
- 3. Market Dynamics
- 3.1. Introduction
- 3.2. Market Drivers
- 3.3. Market Restrains
- 3.4. Market Trends
- 4. Market Factor Analysis
- 4.1. Porters Five Forces
- 4.2. Supply/Value Chain
- 4.3. PESTEL analysis
- 4.4. Market Entropy
- 4.5. Patent/Trademark Analysis
- 5. Global Plugs for Cable Gland Analysis, Insights and Forecast, 2020-2032
- 5.1. Market Analysis, Insights and Forecast - by Application
- 5.1.1. Oil and Gas
- 5.1.2. Mining
- 5.1.3. Construction
- 5.1.4. Railway
- 5.1.5. Chemical
- 5.1.6. Aerospace
- 5.1.7. Power and Energy
- 5.1.8. Others
- 5.2. Market Analysis, Insights and Forecast - by Types
- 5.2.1. Plastic
- 5.2.2. Brass
- 5.2.3. Nylon
- 5.2.4. Other
- 5.3. Market Analysis, Insights and Forecast - by Region
- 5.3.1. North America
- 5.3.2. South America
- 5.3.3. Europe
- 5.3.4. Middle East & Africa
- 5.3.5. Asia Pacific
- 5.1. Market Analysis, Insights and Forecast - by Application
- 6. North America Plugs for Cable Gland Analysis, Insights and Forecast, 2020-2032
- 6.1. Market Analysis, Insights and Forecast - by Application
- 6.1.1. Oil and Gas
- 6.1.2. Mining
- 6.1.3. Construction
- 6.1.4. Railway
- 6.1.5. Chemical
- 6.1.6. Aerospace
- 6.1.7. Power and Energy
- 6.1.8. Others
- 6.2. Market Analysis, Insights and Forecast - by Types
- 6.2.1. Plastic
- 6.2.2. Brass
- 6.2.3. Nylon
- 6.2.4. Other
- 6.1. Market Analysis, Insights and Forecast - by Application
- 7. South America Plugs for Cable Gland Analysis, Insights and Forecast, 2020-2032
- 7.1. Market Analysis, Insights and Forecast - by Application
- 7.1.1. Oil and Gas
- 7.1.2. Mining
- 7.1.3. Construction
- 7.1.4. Railway
- 7.1.5. Chemical
- 7.1.6. Aerospace
- 7.1.7. Power and Energy
- 7.1.8. Others
- 7.2. Market Analysis, Insights and Forecast - by Types
- 7.2.1. Plastic
- 7.2.2. Brass
- 7.2.3. Nylon
- 7.2.4. Other
- 7.1. Market Analysis, Insights and Forecast - by Application
- 8. Europe Plugs for Cable Gland Analysis, Insights and Forecast, 2020-2032
- 8.1. Market Analysis, Insights and Forecast - by Application
- 8.1.1. Oil and Gas
- 8.1.2. Mining
- 8.1.3. Construction
- 8.1.4. Railway
- 8.1.5. Chemical
- 8.1.6. Aerospace
- 8.1.7. Power and Energy
- 8.1.8. Others
- 8.2. Market Analysis, Insights and Forecast - by Types
- 8.2.1. Plastic
- 8.2.2. Brass
- 8.2.3. Nylon
- 8.2.4. Other
- 8.1. Market Analysis, Insights and Forecast - by Application
- 9. Middle East & Africa Plugs for Cable Gland Analysis, Insights and Forecast, 2020-2032
- 9.1. Market Analysis, Insights and Forecast - by Application
- 9.1.1. Oil and Gas
- 9.1.2. Mining
- 9.1.3. Construction
- 9.1.4. Railway
- 9.1.5. Chemical
- 9.1.6. Aerospace
- 9.1.7. Power and Energy
- 9.1.8. Others
- 9.2. Market Analysis, Insights and Forecast - by Types
- 9.2.1. Plastic
- 9.2.2. Brass
- 9.2.3. Nylon
- 9.2.4. Other
- 9.1. Market Analysis, Insights and Forecast - by Application
- 10. Asia Pacific Plugs for Cable Gland Analysis, Insights and Forecast, 2020-2032
- 10.1. Market Analysis, Insights and Forecast - by Application
- 10.1.1. Oil and Gas
- 10.1.2. Mining
- 10.1.3. Construction
- 10.1.4. Railway
- 10.1.5. Chemical
- 10.1.6. Aerospace
- 10.1.7. Power and Energy
- 10.1.8. Others
- 10.2. Market Analysis, Insights and Forecast - by Types
- 10.2.1. Plastic
- 10.2.2. Brass
- 10.2.3. Nylon
- 10.2.4. Other
- 10.1. Market Analysis, Insights and Forecast - by Application
- 11. Competitive Analysis
- 11.1. Global Market Share Analysis 2025
- 11.2. Company Profiles
- 11.2.1 Lapp
- 11.2.1.1. Overview
- 11.2.1.2. Products
- 11.2.1.3. SWOT Analysis
- 11.2.1.4. Recent Developments
- 11.2.1.5. Financials (Based on Availability)
- 11.2.2 Phoenix Contact
- 11.2.2.1. Overview
- 11.2.2.2. Products
- 11.2.2.3. SWOT Analysis
- 11.2.2.4. Recent Developments
- 11.2.2.5. Financials (Based on Availability)
- 11.2.3 CMP Products
- 11.2.3.1. Overview
- 11.2.3.2. Products
- 11.2.3.3. SWOT Analysis
- 11.2.3.4. Recent Developments
- 11.2.3.5. Financials (Based on Availability)
- 11.2.4 Legrand
- 11.2.4.1. Overview
- 11.2.4.2. Products
- 11.2.4.3. SWOT Analysis
- 11.2.4.4. Recent Developments
- 11.2.4.5. Financials (Based on Availability)
- 11.2.5 Eaton
- 11.2.5.1. Overview
- 11.2.5.2. Products
- 11.2.5.3. SWOT Analysis
- 11.2.5.4. Recent Developments
- 11.2.5.5. Financials (Based on Availability)
- 11.2.6 HUMMEL AG
- 11.2.6.1. Overview
- 11.2.6.2. Products
- 11.2.6.3. SWOT Analysis
- 11.2.6.4. Recent Developments
- 11.2.6.5. Financials (Based on Availability)
- 11.2.7 ABB
- 11.2.7.1. Overview
- 11.2.7.2. Products
- 11.2.7.3. SWOT Analysis
- 11.2.7.4. Recent Developments
- 11.2.7.5. Financials (Based on Availability)
- 11.2.8 Jacob
- 11.2.8.1. Overview
- 11.2.8.2. Products
- 11.2.8.3. SWOT Analysis
- 11.2.8.4. Recent Developments
- 11.2.8.5. Financials (Based on Availability)
- 11.2.9 Emerson
- 11.2.9.1. Overview
- 11.2.9.2. Products
- 11.2.9.3. SWOT Analysis
- 11.2.9.4. Recent Developments
- 11.2.9.5. Financials (Based on Availability)
- 11.2.10 TE Connectivity
- 11.2.10.1. Overview
- 11.2.10.2. Products
- 11.2.10.3. SWOT Analysis
- 11.2.10.4. Recent Developments
- 11.2.10.5. Financials (Based on Availability)
- 11.2.1 Lapp
List of Figures
- Figure 1: Global Plugs for Cable Gland Revenue Breakdown (undefined, %) by Region 2025 & 2033
- Figure 2: Global Plugs for Cable Gland Volume Breakdown (K, %) by Region 2025 & 2033
- Figure 3: North America Plugs for Cable Gland Revenue (undefined), by Application 2025 & 2033
- Figure 4: North America Plugs for Cable Gland Volume (K), by Application 2025 & 2033
- Figure 5: North America Plugs for Cable Gland Revenue Share (%), by Application 2025 & 2033
- Figure 6: North America Plugs for Cable Gland Volume Share (%), by Application 2025 & 2033
- Figure 7: North America Plugs for Cable Gland Revenue (undefined), by Types 2025 & 2033
- Figure 8: North America Plugs for Cable Gland Volume (K), by Types 2025 & 2033
- Figure 9: North America Plugs for Cable Gland Revenue Share (%), by Types 2025 & 2033
- Figure 10: North America Plugs for Cable Gland Volume Share (%), by Types 2025 & 2033
- Figure 11: North America Plugs for Cable Gland Revenue (undefined), by Country 2025 & 2033
- Figure 12: North America Plugs for Cable Gland Volume (K), by Country 2025 & 2033
- Figure 13: North America Plugs for Cable Gland Revenue Share (%), by Country 2025 & 2033
- Figure 14: North America Plugs for Cable Gland Volume Share (%), by Country 2025 & 2033
- Figure 15: South America Plugs for Cable Gland Revenue (undefined), by Application 2025 & 2033
- Figure 16: South America Plugs for Cable Gland Volume (K), by Application 2025 & 2033
- Figure 17: South America Plugs for Cable Gland Revenue Share (%), by Application 2025 & 2033
- Figure 18: South America Plugs for Cable Gland Volume Share (%), by Application 2025 & 2033
- Figure 19: South America Plugs for Cable Gland Revenue (undefined), by Types 2025 & 2033
- Figure 20: South America Plugs for Cable Gland Volume (K), by Types 2025 & 2033
- Figure 21: South America Plugs for Cable Gland Revenue Share (%), by Types 2025 & 2033
- Figure 22: South America Plugs for Cable Gland Volume Share (%), by Types 2025 & 2033
- Figure 23: South America Plugs for Cable Gland Revenue (undefined), by Country 2025 & 2033
- Figure 24: South America Plugs for Cable Gland Volume (K), by Country 2025 & 2033
- Figure 25: South America Plugs for Cable Gland Revenue Share (%), by Country 2025 & 2033
- Figure 26: South America Plugs for Cable Gland Volume Share (%), by Country 2025 & 2033
- Figure 27: Europe Plugs for Cable Gland Revenue (undefined), by Application 2025 & 2033
- Figure 28: Europe Plugs for Cable Gland Volume (K), by Application 2025 & 2033
- Figure 29: Europe Plugs for Cable Gland Revenue Share (%), by Application 2025 & 2033
- Figure 30: Europe Plugs for Cable Gland Volume Share (%), by Application 2025 & 2033
- Figure 31: Europe Plugs for Cable Gland Revenue (undefined), by Types 2025 & 2033
- Figure 32: Europe Plugs for Cable Gland Volume (K), by Types 2025 & 2033
- Figure 33: Europe Plugs for Cable Gland Revenue Share (%), by Types 2025 & 2033
- Figure 34: Europe Plugs for Cable Gland Volume Share (%), by Types 2025 & 2033
- Figure 35: Europe Plugs for Cable Gland Revenue (undefined), by Country 2025 & 2033
- Figure 36: Europe Plugs for Cable Gland Volume (K), by Country 2025 & 2033
- Figure 37: Europe Plugs for Cable Gland Revenue Share (%), by Country 2025 & 2033
- Figure 38: Europe Plugs for Cable Gland Volume Share (%), by Country 2025 & 2033
- Figure 39: Middle East & Africa Plugs for Cable Gland Revenue (undefined), by Application 2025 & 2033
- Figure 40: Middle East & Africa Plugs for Cable Gland Volume (K), by Application 2025 & 2033
- Figure 41: Middle East & Africa Plugs for Cable Gland Revenue Share (%), by Application 2025 & 2033
- Figure 42: Middle East & Africa Plugs for Cable Gland Volume Share (%), by Application 2025 & 2033
- Figure 43: Middle East & Africa Plugs for Cable Gland Revenue (undefined), by Types 2025 & 2033
- Figure 44: Middle East & Africa Plugs for Cable Gland Volume (K), by Types 2025 & 2033
- Figure 45: Middle East & Africa Plugs for Cable Gland Revenue Share (%), by Types 2025 & 2033
- Figure 46: Middle East & Africa Plugs for Cable Gland Volume Share (%), by Types 2025 & 2033
- Figure 47: Middle East & Africa Plugs for Cable Gland Revenue (undefined), by Country 2025 & 2033
- Figure 48: Middle East & Africa Plugs for Cable Gland Volume (K), by Country 2025 & 2033
- Figure 49: Middle East & Africa Plugs for Cable Gland Revenue Share (%), by Country 2025 & 2033
- Figure 50: Middle East & Africa Plugs for Cable Gland Volume Share (%), by Country 2025 & 2033
- Figure 51: Asia Pacific Plugs for Cable Gland Revenue (undefined), by Application 2025 & 2033
- Figure 52: Asia Pacific Plugs for Cable Gland Volume (K), by Application 2025 & 2033
- Figure 53: Asia Pacific Plugs for Cable Gland Revenue Share (%), by Application 2025 & 2033
- Figure 54: Asia Pacific Plugs for Cable Gland Volume Share (%), by Application 2025 & 2033
- Figure 55: Asia Pacific Plugs for Cable Gland Revenue (undefined), by Types 2025 & 2033
- Figure 56: Asia Pacific Plugs for Cable Gland Volume (K), by Types 2025 & 2033
- Figure 57: Asia Pacific Plugs for Cable Gland Revenue Share (%), by Types 2025 & 2033
- Figure 58: Asia Pacific Plugs for Cable Gland Volume Share (%), by Types 2025 & 2033
- Figure 59: Asia Pacific Plugs for Cable Gland Revenue (undefined), by Country 2025 & 2033
- Figure 60: Asia Pacific Plugs for Cable Gland Volume (K), by Country 2025 & 2033
- Figure 61: Asia Pacific Plugs for Cable Gland Revenue Share (%), by Country 2025 & 2033
- Figure 62: Asia Pacific Plugs for Cable Gland Volume Share (%), by Country 2025 & 2033
List of Tables
- Table 1: Global Plugs for Cable Gland Revenue undefined Forecast, by Application 2020 & 2033
- Table 2: Global Plugs for Cable Gland Volume K Forecast, by Application 2020 & 2033
- Table 3: Global Plugs for Cable Gland Revenue undefined Forecast, by Types 2020 & 2033
- Table 4: Global Plugs for Cable Gland Volume K Forecast, by Types 2020 & 2033
- Table 5: Global Plugs for Cable Gland Revenue undefined Forecast, by Region 2020 & 2033
- Table 6: Global Plugs for Cable Gland Volume K Forecast, by Region 2020 & 2033
- Table 7: Global Plugs for Cable Gland Revenue undefined Forecast, by Application 2020 & 2033
- Table 8: Global Plugs for Cable Gland Volume K Forecast, by Application 2020 & 2033
- Table 9: Global Plugs for Cable Gland Revenue undefined Forecast, by Types 2020 & 2033
- Table 10: Global Plugs for Cable Gland Volume K Forecast, by Types 2020 & 2033
- Table 11: Global Plugs for Cable Gland Revenue undefined Forecast, by Country 2020 & 2033
- Table 12: Global Plugs for Cable Gland Volume K Forecast, by Country 2020 & 2033
- Table 13: United States Plugs for Cable Gland Revenue (undefined) Forecast, by Application 2020 & 2033
- Table 14: United States Plugs for Cable Gland Volume (K) Forecast, by Application 2020 & 2033
- Table 15: Canada Plugs for Cable Gland Revenue (undefined) Forecast, by Application 2020 & 2033
- Table 16: Canada Plugs for Cable Gland Volume (K) Forecast, by Application 2020 & 2033
- Table 17: Mexico Plugs for Cable Gland Revenue (undefined) Forecast, by Application 2020 & 2033
- Table 18: Mexico Plugs for Cable Gland Volume (K) Forecast, by Application 2020 & 2033
- Table 19: Global Plugs for Cable Gland Revenue undefined Forecast, by Application 2020 & 2033
- Table 20: Global Plugs for Cable Gland Volume K Forecast, by Application 2020 & 2033
- Table 21: Global Plugs for Cable Gland Revenue undefined Forecast, by Types 2020 & 2033
- Table 22: Global Plugs for Cable Gland Volume K Forecast, by Types 2020 & 2033
- Table 23: Global Plugs for Cable Gland Revenue undefined Forecast, by Country 2020 & 2033
- Table 24: Global Plugs for Cable Gland Volume K Forecast, by Country 2020 & 2033
- Table 25: Brazil Plugs for Cable Gland Revenue (undefined) Forecast, by Application 2020 & 2033
- Table 26: Brazil Plugs for Cable Gland Volume (K) Forecast, by Application 2020 & 2033
- Table 27: Argentina Plugs for Cable Gland Revenue (undefined) Forecast, by Application 2020 & 2033
- Table 28: Argentina Plugs for Cable Gland Volume (K) Forecast, by Application 2020 & 2033
- Table 29: Rest of South America Plugs for Cable Gland Revenue (undefined) Forecast, by Application 2020 & 2033
- Table 30: Rest of South America Plugs for Cable Gland Volume (K) Forecast, by Application 2020 & 2033
- Table 31: Global Plugs for Cable Gland Revenue undefined Forecast, by Application 2020 & 2033
- Table 32: Global Plugs for Cable Gland Volume K Forecast, by Application 2020 & 2033
- Table 33: Global Plugs for Cable Gland Revenue undefined Forecast, by Types 2020 & 2033
- Table 34: Global Plugs for Cable Gland Volume K Forecast, by Types 2020 & 2033
- Table 35: Global Plugs for Cable Gland Revenue undefined Forecast, by Country 2020 & 2033
- Table 36: Global Plugs for Cable Gland Volume K Forecast, by Country 2020 & 2033
- Table 37: United Kingdom Plugs for Cable Gland Revenue (undefined) Forecast, by Application 2020 & 2033
- Table 38: United Kingdom Plugs for Cable Gland Volume (K) Forecast, by Application 2020 & 2033
- Table 39: Germany Plugs for Cable Gland Revenue (undefined) Forecast, by Application 2020 & 2033
- Table 40: Germany Plugs for Cable Gland Volume (K) Forecast, by Application 2020 & 2033
- Table 41: France Plugs for Cable Gland Revenue (undefined) Forecast, by Application 2020 & 2033
- Table 42: France Plugs for Cable Gland Volume (K) Forecast, by Application 2020 & 2033
- Table 43: Italy Plugs for Cable Gland Revenue (undefined) Forecast, by Application 2020 & 2033
- Table 44: Italy Plugs for Cable Gland Volume (K) Forecast, by Application 2020 & 2033
- Table 45: Spain Plugs for Cable Gland Revenue (undefined) Forecast, by Application 2020 & 2033
- Table 46: Spain Plugs for Cable Gland Volume (K) Forecast, by Application 2020 & 2033
- Table 47: Russia Plugs for Cable Gland Revenue (undefined) Forecast, by Application 2020 & 2033
- Table 48: Russia Plugs for Cable Gland Volume (K) Forecast, by Application 2020 & 2033
- Table 49: Benelux Plugs for Cable Gland Revenue (undefined) Forecast, by Application 2020 & 2033
- Table 50: Benelux Plugs for Cable Gland Volume (K) Forecast, by Application 2020 & 2033
- Table 51: Nordics Plugs for Cable Gland Revenue (undefined) Forecast, by Application 2020 & 2033
- Table 52: Nordics Plugs for Cable Gland Volume (K) Forecast, by Application 2020 & 2033
- Table 53: Rest of Europe Plugs for Cable Gland Revenue (undefined) Forecast, by Application 2020 & 2033
- Table 54: Rest of Europe Plugs for Cable Gland Volume (K) Forecast, by Application 2020 & 2033
- Table 55: Global Plugs for Cable Gland Revenue undefined Forecast, by Application 2020 & 2033
- Table 56: Global Plugs for Cable Gland Volume K Forecast, by Application 2020 & 2033
- Table 57: Global Plugs for Cable Gland Revenue undefined Forecast, by Types 2020 & 2033
- Table 58: Global Plugs for Cable Gland Volume K Forecast, by Types 2020 & 2033
- Table 59: Global Plugs for Cable Gland Revenue undefined Forecast, by Country 2020 & 2033
- Table 60: Global Plugs for Cable Gland Volume K Forecast, by Country 2020 & 2033
- Table 61: Turkey Plugs for Cable Gland Revenue (undefined) Forecast, by Application 2020 & 2033
- Table 62: Turkey Plugs for Cable Gland Volume (K) Forecast, by Application 2020 & 2033
- Table 63: Israel Plugs for Cable Gland Revenue (undefined) Forecast, by Application 2020 & 2033
- Table 64: Israel Plugs for Cable Gland Volume (K) Forecast, by Application 2020 & 2033
- Table 65: GCC Plugs for Cable Gland Revenue (undefined) Forecast, by Application 2020 & 2033
- Table 66: GCC Plugs for Cable Gland Volume (K) Forecast, by Application 2020 & 2033
- Table 67: North Africa Plugs for Cable Gland Revenue (undefined) Forecast, by Application 2020 & 2033
- Table 68: North Africa Plugs for Cable Gland Volume (K) Forecast, by Application 2020 & 2033
- Table 69: South Africa Plugs for Cable Gland Revenue (undefined) Forecast, by Application 2020 & 2033
- Table 70: South Africa Plugs for Cable Gland Volume (K) Forecast, by Application 2020 & 2033
- Table 71: Rest of Middle East & Africa Plugs for Cable Gland Revenue (undefined) Forecast, by Application 2020 & 2033
- Table 72: Rest of Middle East & Africa Plugs for Cable Gland Volume (K) Forecast, by Application 2020 & 2033
- Table 73: Global Plugs for Cable Gland Revenue undefined Forecast, by Application 2020 & 2033
- Table 74: Global Plugs for Cable Gland Volume K Forecast, by Application 2020 & 2033
- Table 75: Global Plugs for Cable Gland Revenue undefined Forecast, by Types 2020 & 2033
- Table 76: Global Plugs for Cable Gland Volume K Forecast, by Types 2020 & 2033
- Table 77: Global Plugs for Cable Gland Revenue undefined Forecast, by Country 2020 & 2033
- Table 78: Global Plugs for Cable Gland Volume K Forecast, by Country 2020 & 2033
- Table 79: China Plugs for Cable Gland Revenue (undefined) Forecast, by Application 2020 & 2033
- Table 80: China Plugs for Cable Gland Volume (K) Forecast, by Application 2020 & 2033
- Table 81: India Plugs for Cable Gland Revenue (undefined) Forecast, by Application 2020 & 2033
- Table 82: India Plugs for Cable Gland Volume (K) Forecast, by Application 2020 & 2033
- Table 83: Japan Plugs for Cable Gland Revenue (undefined) Forecast, by Application 2020 & 2033
- Table 84: Japan Plugs for Cable Gland Volume (K) Forecast, by Application 2020 & 2033
- Table 85: South Korea Plugs for Cable Gland Revenue (undefined) Forecast, by Application 2020 & 2033
- Table 86: South Korea Plugs for Cable Gland Volume (K) Forecast, by Application 2020 & 2033
- Table 87: ASEAN Plugs for Cable Gland Revenue (undefined) Forecast, by Application 2020 & 2033
- Table 88: ASEAN Plugs for Cable Gland Volume (K) Forecast, by Application 2020 & 2033
- Table 89: Oceania Plugs for Cable Gland Revenue (undefined) Forecast, by Application 2020 & 2033
- Table 90: Oceania Plugs for Cable Gland Volume (K) Forecast, by Application 2020 & 2033
- Table 91: Rest of Asia Pacific Plugs for Cable Gland Revenue (undefined) Forecast, by Application 2020 & 2033
- Table 92: Rest of Asia Pacific Plugs for Cable Gland Volume (K) Forecast, by Application 2020 & 2033
Frequently Asked Questions
1. What is the projected Compound Annual Growth Rate (CAGR) of the Plugs for Cable Gland?
The projected CAGR is approximately 5%.
2. Which companies are prominent players in the Plugs for Cable Gland?
Key companies in the market include Lapp, Phoenix Contact, CMP Products, Legrand, Eaton, HUMMEL AG, ABB, Jacob, Emerson, TE Connectivity.
3. What are the main segments of the Plugs for Cable Gland?
The market segments include Application, Types.
4. Can you provide details about the market size?
The market size is estimated to be USD XXX N/A as of 2022.
5. What are some drivers contributing to market growth?
N/A
6. What are the notable trends driving market growth?
N/A
7. Are there any restraints impacting market growth?
N/A
8. Can you provide examples of recent developments in the market?
N/A
9. What pricing options are available for accessing the report?
Pricing options include single-user, multi-user, and enterprise licenses priced at USD 3350.00, USD 5025.00, and USD 6700.00 respectively.
10. Is the market size provided in terms of value or volume?
The market size is provided in terms of value, measured in N/A and volume, measured in K.
11. Are there any specific market keywords associated with the report?
Yes, the market keyword associated with the report is "Plugs for Cable Gland," which aids in identifying and referencing the specific market segment covered.
12. How do I determine which pricing option suits my needs best?
The pricing options vary based on user requirements and access needs. Individual users may opt for single-user licenses, while businesses requiring broader access may choose multi-user or enterprise licenses for cost-effective access to the report.
13. Are there any additional resources or data provided in the Plugs for Cable Gland report?
While the report offers comprehensive insights, it's advisable to review the specific contents or supplementary materials provided to ascertain if additional resources or data are available.
14. How can I stay updated on further developments or reports in the Plugs for Cable Gland?
To stay informed about further developments, trends, and reports in the Plugs for Cable Gland, consider subscribing to industry newsletters, following relevant companies and organizations, or regularly checking reputable industry news sources and publications.
Methodology
Step 1 - Identification of Relevant Samples Size from Population Database


Step 2 - Approaches for Defining Global Market Size (Value, Volume* & Price*)

Note*: In applicable scenarios
Step 3 - Data Sources
Primary Research
- Web Analytics
- Survey Reports
- Research Institute
- Latest Research Reports
- Opinion Leaders
Secondary Research
- Annual Reports
- White Paper
- Latest Press Release
- Industry Association
- Paid Database
- Investor Presentations

Step 4 - Data Triangulation
Involves using different sources of information in order to increase the validity of a study
These sources are likely to be stakeholders in a program - participants, other researchers, program staff, other community members, and so on.
Then we put all data in single framework & apply various statistical tools to find out the dynamic on the market.
During the analysis stage, feedback from the stakeholder groups would be compared to determine areas of agreement as well as areas of divergence