

Key Insights
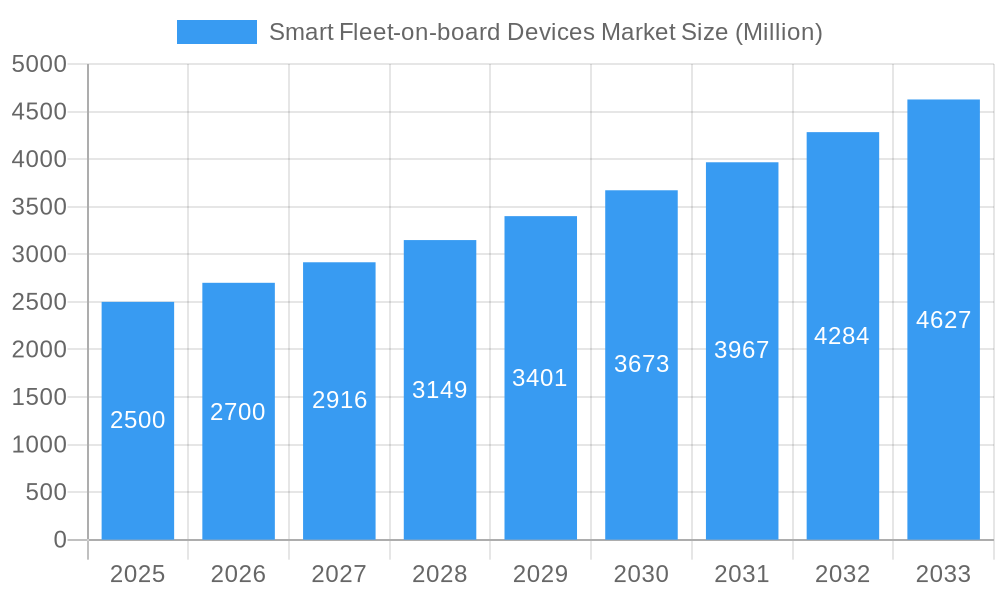
The global Smart Fleet-on-board Devices Market is poised for robust expansion, with an estimated market size of $2.5 billion in 2025, projected to grow at a Compound Annual Growth Rate (CAGR) of 8.00% through 2033. This significant growth is primarily fueled by the increasing adoption of advanced fleet management solutions across diverse transportation sectors, including buses and trains. Key drivers include the escalating demand for real-time vehicle tracking, enhanced operational efficiency, and improved passenger safety and experience. The integration of technologies like GPS and GSM/GPRS is central to enabling sophisticated vehicle tracking and diagnostics, thereby optimizing fleet performance. The market is also witnessing a surge in demand for Automated Vehicle Location (AVL) and Automatic Passenger Counting (APC) systems, directly impacting service delivery and operational planning for public and private transport operators.
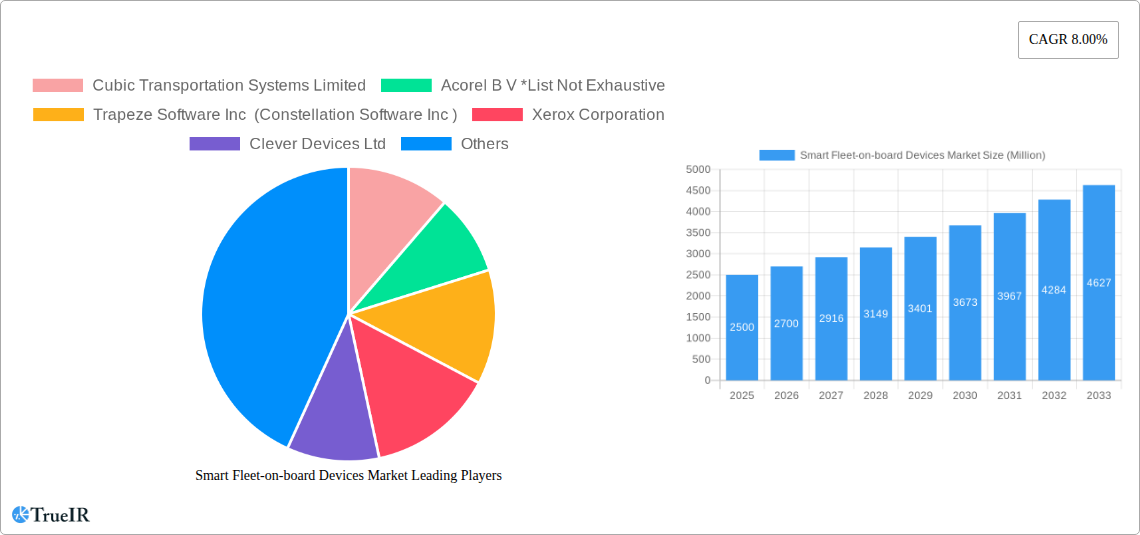
Smart Fleet-on-board Devices Market Market Size (In Billion)
The market's trajectory is further shaped by evolving trends such as the implementation of smart ticketing solutions and the continuous innovation in vehicle diagnostic capabilities, allowing for predictive maintenance and reduced downtime. While the market presents substantial opportunities, certain restraints such as high initial investment costs for advanced hardware and software, alongside data security and privacy concerns, need to be strategically addressed by market players. North America and Europe are expected to lead market share due to their advanced transportation infrastructure and early adoption of smart technologies. However, the Asia Pacific region is anticipated to witness the fastest growth, driven by increasing investments in public transportation modernization and the expansion of logistics networks. Key companies like Cubic Transportation Systems, Trapeze Software, and Xerox Corporation are actively innovating and expanding their offerings to capture this dynamic market.
Smart Fleet-on-board Devices Market Company Market Share
This in-depth report provides a comprehensive analysis of the Smart Fleet-on-board Devices Market, delving into critical trends, market dynamics, and future projections from 2019 to 2033. We offer actionable insights for stakeholders navigating this rapidly evolving sector, focusing on vehicle tracking solutions, fleet management technology, and the increasing adoption of intelligent transportation systems.
Smart Fleet-on-board Devices Market Market Structure & Competitive Landscape
The Smart Fleet-on-board Devices Market exhibits a moderately concentrated structure, with key players investing heavily in research and development to drive innovation. The market is characterized by a strong emphasis on advanced GPS and GSM/GPRS technologies, enabling sophisticated vehicle tracking, vehicle diagnostics, and vehicle performance monitoring. Regulatory frameworks, particularly concerning data privacy and safety standards for public transport, play a significant role in shaping market entry and product development. The presence of product substitutes, such as standalone tracking devices or basic telematics systems, is minimal due to the integrated nature and advanced capabilities of modern on-board fleet solutions.
End-user segmentation reveals a dominant presence of Buses and Trains within the public transportation and logistics sectors, driving demand for robust AVL (Automatic Vehicle Location), APC (Automatic Passenger Counting), and integrated Ticketing Solutions. Mergers and acquisitions (M&A) are an ongoing trend, with larger entities acquiring innovative startups to expand their technological portfolios and market reach. For instance, the acquisition of specialized software providers has been observed in recent years, indicating a strategic move towards offering comprehensive fleet management ecosystems. The overall M&A volume in the last three years is estimated to be in the hundreds of Million, reflecting consolidation and strategic expansion. Market concentration ratios are estimated to be in the range of 50-60%, indicating that the top five players command a significant market share.
Smart Fleet-on-board Devices Market Market Trends & Opportunities
The Smart Fleet-on-board Devices Market is poised for significant expansion, projected to witness a Compound Annual Growth Rate (CAGR) of approximately 12% between 2025 and 2033. This robust growth trajectory is fueled by the escalating demand for enhanced operational efficiency, improved passenger safety, and real-time data insights across public transportation and commercial fleet operations. The shift towards smart cities and the increasing integration of IoT (Internet of Things) in transportation infrastructure are creating unprecedented opportunities for advanced on-board device solutions.
Technological advancements, particularly in the realm of Artificial Intelligence (AI) and Machine Learning (ML), are revolutionizing the capabilities of smart fleet devices. These technologies are enabling predictive maintenance, optimizing route planning, and providing deeper insights into vehicle performance and passenger flow. The integration of 5G connectivity promises even faster data transmission and lower latency, further enhancing the real-time monitoring and control capabilities of fleet management systems.
Consumer preferences are increasingly leaning towards seamless and digitized travel experiences. This translates to a higher demand for integrated ticketing solutions that can be accessed via mobile devices, alongside real-time information on vehicle location and estimated arrival times. The development of passenger counting systems (APC) is also crucial for optimizing service frequency and managing passenger load, contributing to a more efficient and comfortable public transport experience.
Competitive dynamics within the market are intensifying, with a focus on offering comprehensive, end-to-end solutions rather than just individual devices. Companies are differentiating themselves through superior software platforms, advanced analytics, and robust customer support. The growing emphasis on sustainability and environmental regulations is also driving the adoption of on-board devices that can monitor fuel efficiency and emissions, presenting a significant market opportunity.
The penetration rate of smart fleet-on-board devices in developed regions is already high, but emerging economies present substantial untapped potential. Government initiatives aimed at modernizing public transportation and improving road safety are key catalysts for market growth in these regions. The increasing adoption of electric and autonomous vehicles will also necessitate sophisticated on-board intelligence for effective fleet management and operational oversight.
Dominant Markets & Segments in Smart Fleet-on-board Devices Market
The Smart Fleet-on-board Devices Market is currently dominated by North America and Europe, driven by their mature transportation infrastructure and stringent regulatory environments that mandate advanced fleet management solutions. Within these regions, Buses represent the largest application segment, accounting for over 55% of the market share, due to extensive public bus networks and a strong focus on passenger convenience and safety. The growing adoption of ticketing solutions integrated with on-board devices further solidifies the dominance of the bus segment.
The AVL (Automatic Vehicle Location) device segment holds the largest share, estimated at around 35% of the total market value, due to its foundational role in vehicle tracking and fleet operations. The continuous advancements in GPS accuracy and the widespread availability of GSM/GPRS networks have made AVL solutions indispensable for real-time monitoring and fleet management. Vehicle Diagnostics and Vehicle Performance monitoring devices are also experiencing rapid growth, driven by the need to reduce operational costs through predictive maintenance and fuel efficiency optimization.
In terms of technology, GPS remains the cornerstone, with an estimated market share exceeding 60%, owing to its reliable positioning capabilities. However, GSM/GPRS technology is crucial for data transmission, enabling real-time communication between on-board devices and central management systems, and is expected to grow at a CAGR of approximately 11% over the forecast period. The emerging adoption of 5G and other advanced wireless technologies will further enhance connectivity and data processing capabilities.
The Trains segment, while smaller than buses in terms of unit volume, represents a significant revenue stream due to the higher cost and complexity of on-board systems required for rail operations. Growth in this segment is propelled by investments in high-speed rail networks and the increasing need for passenger information systems and operational monitoring. Policies promoting intermodal connectivity and smart mobility initiatives are further driving the integration of advanced on-board devices in both bus and train networks. The ongoing development of intelligent transportation systems worldwide is a key growth driver, encouraging the adoption of integrated solutions for enhanced safety, efficiency, and passenger experience.
Smart Fleet-on-board Devices Market Product Analysis
The Smart Fleet-on-board Devices Market is characterized by continuous product innovation focused on enhancing vehicle tracking, vehicle diagnostics, and vehicle performance monitoring. Key advancements include the integration of AI for predictive analytics, leading to proactive maintenance and reduced downtime. Automatic Passenger Counting (APC) systems are becoming more sophisticated, leveraging computer vision and sensor fusion for highly accurate passenger flow analysis, crucial for optimizing public transport services. Ticketing Solutions are evolving towards cashless and contactless payment methods, seamlessly integrated with on-board hardware for a streamlined passenger experience. The competitive advantage lies in offering robust, reliable, and feature-rich devices that provide real-time data, actionable insights, and a high degree of customization to meet diverse fleet management needs.
Key Drivers, Barriers & Challenges in Smart Fleet-on-board Devices Market
The Smart Fleet-on-board Devices Market is primarily propelled by the escalating demand for enhanced operational efficiency and cost reduction in fleet management. Technological advancements in GPS, GSM/GPRS, and data analytics are key drivers, enabling real-time vehicle tracking and performance monitoring. Government initiatives promoting smart cities and public transportation modernization further fuel market growth.
However, the market faces significant challenges. High initial investment costs for advanced on-board devices can be a barrier for smaller fleet operators. Regulatory complexities related to data privacy and cybersecurity are also a concern. Furthermore, supply chain disruptions and component shortages can impact product availability and pricing. Intense competition among established players and emerging startups necessitates continuous innovation and competitive pricing strategies. The integration of new technologies with existing legacy systems can also pose technical hurdles.
Growth Drivers in the Smart Fleet-on-board Devices Market Market
Key growth drivers in the Smart Fleet-on-board Devices Market include the increasing global emphasis on smart city initiatives, which necessitate advanced intelligent transportation systems for efficient urban mobility. The growing adoption of fleet management solutions by public transportation authorities and private logistics companies to optimize operations, reduce fuel consumption, and enhance passenger safety is a major catalyst. Furthermore, the continuous evolution of communication technologies like 5G is enabling more robust and real-time data transmission from on-board devices, supporting advanced features such as predictive maintenance and real-time route optimization. Government policies promoting the adoption of green transportation and reducing carbon emissions are also indirectly driving the demand for devices that can monitor vehicle performance and fuel efficiency.
Challenges Impacting Smart Fleet-on-board Devices Market Growth
Challenges impacting Smart Fleet-on-board Devices Market growth are multifaceted. The substantial initial capital expenditure required for installing advanced on-board systems, including AVL, APC, and integrated ticketing solutions, can be a significant deterrent for smaller and medium-sized enterprises. Cybersecurity threats and data privacy concerns related to the vast amounts of sensitive data collected by these devices necessitate robust security protocols, which can add to development and operational costs. Moreover, the complexity of integrating new on-board technologies with existing legacy fleet management systems often presents technical hurdles and requires significant integration efforts. The fragmentation of the market with numerous vendors offering a wide array of solutions can also create confusion for potential buyers and make standardization difficult. Supply chain vulnerabilities and the potential for component shortages can lead to production delays and increased costs.
Key Players Shaping the Smart Fleet-on-board Devices Market Market
- Cubic Transportation Systems Limited
- Acorel B V
- Trapeze Software Inc (Constellation Software Inc )
- Xerox Corporation
- Clever Devices Ltd
- Hella Aglaia Mobile Vision GmbH
- DILAX Intelcom GmbH
- Eurotech Inc
- Televic N V
- 21st Century Technology plc
Significant Smart Fleet-on-board Devices Market Industry Milestones
- 2019: Increased adoption of AI-powered predictive maintenance solutions for bus fleets.
- 2020: Launch of integrated contactless ticketing solutions for public transport systems in major European cities.
- 2021: Significant investment in GPS and GSM/GPRS technology upgrades for enhanced real-time vehicle tracking in logistics fleets.
- 2022: Expansion of APC (Automatic Passenger Counting) systems to smaller public transit operators seeking to optimize route planning.
- 2023: Growing partnerships between device manufacturers and cloud service providers to offer comprehensive data analytics platforms.
- 2024: Emergence of early pilot programs for 5G-enabled on-board diagnostic systems in commercial vehicle fleets.
Future Outlook for Smart Fleet-on-board Devices Market Market
The future outlook for the Smart Fleet-on-board Devices Market is exceptionally positive, driven by the relentless pursuit of operational excellence and enhanced passenger experience in the transportation sector. The continued integration of advanced technologies such as AI, IoT, and 5G will unlock new capabilities in vehicle diagnostics, predictive maintenance, and real-time fleet optimization. The growing global emphasis on sustainable transportation and the rise of autonomous vehicles will further accelerate the adoption of sophisticated on-board devices. Emerging economies present substantial growth opportunities as they invest in modernizing their transportation infrastructure. Strategic collaborations and a focus on end-to-end solutions will be key for market players to thrive in this dynamic and expanding market. The market is projected to reach xx Billion by 2033.
Smart Fleet-on-board Devices Market Segmentation
-
1. Devices
- 1.1. AVL
- 1.2. APC
- 1.3. Ticketing Solution
-
2. Technology
- 2.1. GPS
- 2.2. GSM/GPRS
-
3. Solution
- 3.1. Vehicle Tracking
- 3.2. Vehicle Diagnostics
- 3.3. Vehicle Performance
-
4. Application
- 4.1. Buses
- 4.2. Trains
Smart Fleet-on-board Devices Market Segmentation By Geography
- 1. North America
- 2. Europe
- 3. Asia Pacific
- 4. South America
- 5. Middle East and Africa
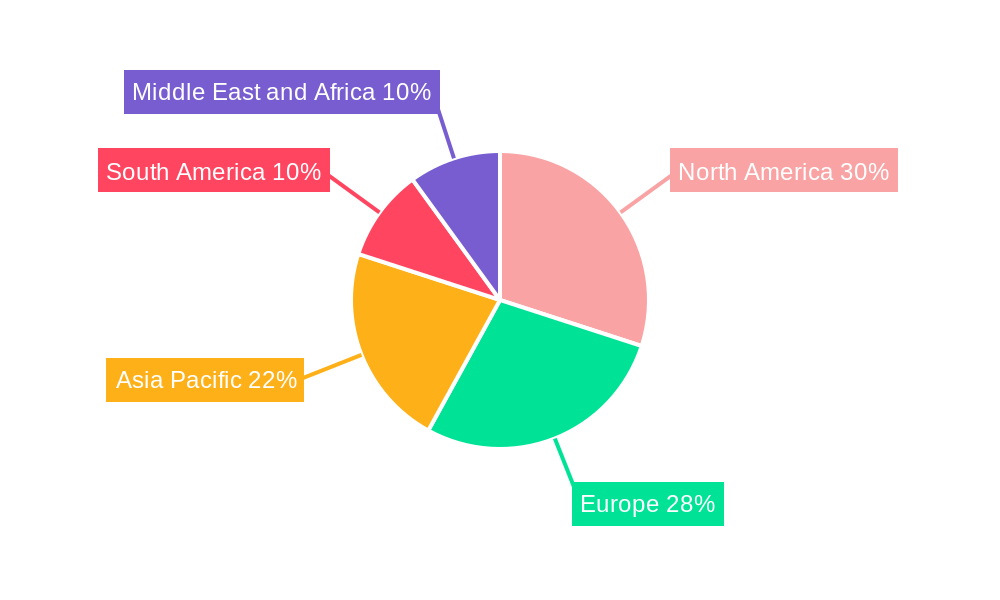
Smart Fleet-on-board Devices Market Regional Market Share
Geographic Coverage of Smart Fleet-on-board Devices Market
Smart Fleet-on-board Devices Market REPORT HIGHLIGHTS
| Aspects | Details |
|---|---|
| Study Period | 2020-2034 |
| Base Year | 2025 |
| Estimated Year | 2026 |
| Forecast Period | 2026-2034 |
| Historical Period | 2020-2025 |
| Growth Rate | CAGR of 8.93% from 2020-2034 |
| Segmentation |
|
Table of Contents
- 1. Introduction
- 1.1. Research Scope
- 1.2. Market Segmentation
- 1.3. Research Objective
- 1.4. Definitions and Assumptions
- 2. Executive Summary
- 2.1. Market Snapshot
- 3. Market Dynamics
- 3.1. Market Drivers
- 3.2. Market Restrains
- 3.3. Market Trends
- 3.4. Market Opportunities
- 4. Market Factor Analysis
- 4.1. Porters Five Forces
- 4.1.1. Bargaining Power of Suppliers
- 4.1.2. Bargaining Power of Buyers
- 4.1.3. Threat of New Entrants
- 4.1.4. Threat of Substitutes
- 4.1.5. Competitive Rivalry
- 4.2. PESTEL analysis
- 4.3. BCG Analysis
- 4.3.1. Stars (High Growth, High Market Share)
- 4.3.2. Cash Cows (Low Growth, High Market Share)
- 4.3.3. Question Mark (High Growth, Low Market Share)
- 4.3.4. Dogs (Low Growth, Low Market Share)
- 4.4. Ansoff Matrix Analysis
- 4.5. Supply Chain Analysis
- 4.6. Regulatory Landscape
- 4.7. Current Market Potential and Opportunity Assessment (TAM–SAM–SOM Framework)
- 4.8. TIR Analyst Note
- 4.1. Porters Five Forces
- 5. Market Analysis, Insights and Forecast 2021-2033
- 5.1. Market Analysis, Insights and Forecast - by Devices
- 5.1.1. AVL
- 5.1.2. APC
- 5.1.3. Ticketing Solution
- 5.2. Market Analysis, Insights and Forecast - by Technology
- 5.2.1. GPS
- 5.2.2. GSM/GPRS
- 5.3. Market Analysis, Insights and Forecast - by Solution
- 5.3.1. Vehicle Tracking
- 5.3.2. Vehicle Diagnostics
- 5.3.3. Vehicle Performance
- 5.4. Market Analysis, Insights and Forecast - by Application
- 5.4.1. Buses
- 5.4.2. Trains
- 5.5. Market Analysis, Insights and Forecast - by Region
- 5.5.1. North America
- 5.5.2. Europe
- 5.5.3. Asia Pacific
- 5.5.4. South America
- 5.5.5. Middle East and Africa
- 5.1. Market Analysis, Insights and Forecast - by Devices
- 6. Global Smart Fleet-on-board Devices Market Analysis, Insights and Forecast, 2021-2033
- 6.1. Market Analysis, Insights and Forecast - by Devices
- 6.1.1. AVL
- 6.1.2. APC
- 6.1.3. Ticketing Solution
- 6.2. Market Analysis, Insights and Forecast - by Technology
- 6.2.1. GPS
- 6.2.2. GSM/GPRS
- 6.3. Market Analysis, Insights and Forecast - by Solution
- 6.3.1. Vehicle Tracking
- 6.3.2. Vehicle Diagnostics
- 6.3.3. Vehicle Performance
- 6.4. Market Analysis, Insights and Forecast - by Application
- 6.4.1. Buses
- 6.4.2. Trains
- 6.1. Market Analysis, Insights and Forecast - by Devices
- 7. North America Smart Fleet-on-board Devices Market Analysis, Insights and Forecast, 2020-2032
- 7.1. Market Analysis, Insights and Forecast - by Devices
- 7.1.1. AVL
- 7.1.2. APC
- 7.1.3. Ticketing Solution
- 7.2. Market Analysis, Insights and Forecast - by Technology
- 7.2.1. GPS
- 7.2.2. GSM/GPRS
- 7.3. Market Analysis, Insights and Forecast - by Solution
- 7.3.1. Vehicle Tracking
- 7.3.2. Vehicle Diagnostics
- 7.3.3. Vehicle Performance
- 7.4. Market Analysis, Insights and Forecast - by Application
- 7.4.1. Buses
- 7.4.2. Trains
- 7.1. Market Analysis, Insights and Forecast - by Devices
- 8. Europe Smart Fleet-on-board Devices Market Analysis, Insights and Forecast, 2020-2032
- 8.1. Market Analysis, Insights and Forecast - by Devices
- 8.1.1. AVL
- 8.1.2. APC
- 8.1.3. Ticketing Solution
- 8.2. Market Analysis, Insights and Forecast - by Technology
- 8.2.1. GPS
- 8.2.2. GSM/GPRS
- 8.3. Market Analysis, Insights and Forecast - by Solution
- 8.3.1. Vehicle Tracking
- 8.3.2. Vehicle Diagnostics
- 8.3.3. Vehicle Performance
- 8.4. Market Analysis, Insights and Forecast - by Application
- 8.4.1. Buses
- 8.4.2. Trains
- 8.1. Market Analysis, Insights and Forecast - by Devices
- 9. Asia Pacific Smart Fleet-on-board Devices Market Analysis, Insights and Forecast, 2020-2032
- 9.1. Market Analysis, Insights and Forecast - by Devices
- 9.1.1. AVL
- 9.1.2. APC
- 9.1.3. Ticketing Solution
- 9.2. Market Analysis, Insights and Forecast - by Technology
- 9.2.1. GPS
- 9.2.2. GSM/GPRS
- 9.3. Market Analysis, Insights and Forecast - by Solution
- 9.3.1. Vehicle Tracking
- 9.3.2. Vehicle Diagnostics
- 9.3.3. Vehicle Performance
- 9.4. Market Analysis, Insights and Forecast - by Application
- 9.4.1. Buses
- 9.4.2. Trains
- 9.1. Market Analysis, Insights and Forecast - by Devices
- 10. South America Smart Fleet-on-board Devices Market Analysis, Insights and Forecast, 2020-2032
- 10.1. Market Analysis, Insights and Forecast - by Devices
- 10.1.1. AVL
- 10.1.2. APC
- 10.1.3. Ticketing Solution
- 10.2. Market Analysis, Insights and Forecast - by Technology
- 10.2.1. GPS
- 10.2.2. GSM/GPRS
- 10.3. Market Analysis, Insights and Forecast - by Solution
- 10.3.1. Vehicle Tracking
- 10.3.2. Vehicle Diagnostics
- 10.3.3. Vehicle Performance
- 10.4. Market Analysis, Insights and Forecast - by Application
- 10.4.1. Buses
- 10.4.2. Trains
- 10.1. Market Analysis, Insights and Forecast - by Devices
- 11. Middle East and Africa Smart Fleet-on-board Devices Market Analysis, Insights and Forecast, 2020-2032
- 11.1. Market Analysis, Insights and Forecast - by Devices
- 11.1.1. AVL
- 11.1.2. APC
- 11.1.3. Ticketing Solution
- 11.2. Market Analysis, Insights and Forecast - by Technology
- 11.2.1. GPS
- 11.2.2. GSM/GPRS
- 11.3. Market Analysis, Insights and Forecast - by Solution
- 11.3.1. Vehicle Tracking
- 11.3.2. Vehicle Diagnostics
- 11.3.3. Vehicle Performance
- 11.4. Market Analysis, Insights and Forecast - by Application
- 11.4.1. Buses
- 11.4.2. Trains
- 11.1. Market Analysis, Insights and Forecast - by Devices
- 12. Competitive Analysis
- 12.1. Company Profiles
- 12.1.1 Cubic Transportation Systems Limited
- 12.1.1.1. Company Overview
- 12.1.1.2. Products
- 12.1.1.3. Company Financials
- 12.1.1.4. SWOT Analysis
- 12.1.2 Acorel B V *List Not Exhaustive
- 12.1.2.1. Company Overview
- 12.1.2.2. Products
- 12.1.2.3. Company Financials
- 12.1.2.4. SWOT Analysis
- 12.1.3 Trapeze Software Inc (Constellation Software Inc )
- 12.1.3.1. Company Overview
- 12.1.3.2. Products
- 12.1.3.3. Company Financials
- 12.1.3.4. SWOT Analysis
- 12.1.4 Xerox Corporation
- 12.1.4.1. Company Overview
- 12.1.4.2. Products
- 12.1.4.3. Company Financials
- 12.1.4.4. SWOT Analysis
- 12.1.5 Clever Devices Ltd
- 12.1.5.1. Company Overview
- 12.1.5.2. Products
- 12.1.5.3. Company Financials
- 12.1.5.4. SWOT Analysis
- 12.1.6 Hella Aglaia Mobile Vision GmbH
- 12.1.6.1. Company Overview
- 12.1.6.2. Products
- 12.1.6.3. Company Financials
- 12.1.6.4. SWOT Analysis
- 12.1.7 DILAX Intelcom GmbH
- 12.1.7.1. Company Overview
- 12.1.7.2. Products
- 12.1.7.3. Company Financials
- 12.1.7.4. SWOT Analysis
- 12.1.8 Eurotech Inc
- 12.1.8.1. Company Overview
- 12.1.8.2. Products
- 12.1.8.3. Company Financials
- 12.1.8.4. SWOT Analysis
- 12.1.9 Televic N V
- 12.1.9.1. Company Overview
- 12.1.9.2. Products
- 12.1.9.3. Company Financials
- 12.1.9.4. SWOT Analysis
- 12.1.10 21st Century Technology plc
- 12.1.10.1. Company Overview
- 12.1.10.2. Products
- 12.1.10.3. Company Financials
- 12.1.10.4. SWOT Analysis
- 12.1.1 Cubic Transportation Systems Limited
- 12.2. Market Entropy
- 12.2.1 Company's Key Areas Served
- 12.2.2 Recent Developments
- 12.3. Company Market Share Analysis 2025
- 12.3.1 Top 5 Companies Market Share Analysis
- 12.3.2 Top 3 Companies Market Share Analysis
- 12.4. List of Potential Customers
- 13. Research Methodology
List of Figures
- Figure 1: Global Smart Fleet-on-board Devices Market Revenue Breakdown (undefined, %) by Region 2025 & 2033
- Figure 2: North America Smart Fleet-on-board Devices Market Revenue (undefined), by Devices 2025 & 2033
- Figure 3: North America Smart Fleet-on-board Devices Market Revenue Share (%), by Devices 2025 & 2033
- Figure 4: North America Smart Fleet-on-board Devices Market Revenue (undefined), by Technology 2025 & 2033
- Figure 5: North America Smart Fleet-on-board Devices Market Revenue Share (%), by Technology 2025 & 2033
- Figure 6: North America Smart Fleet-on-board Devices Market Revenue (undefined), by Solution 2025 & 2033
- Figure 7: North America Smart Fleet-on-board Devices Market Revenue Share (%), by Solution 2025 & 2033
- Figure 8: North America Smart Fleet-on-board Devices Market Revenue (undefined), by Application 2025 & 2033
- Figure 9: North America Smart Fleet-on-board Devices Market Revenue Share (%), by Application 2025 & 2033
- Figure 10: North America Smart Fleet-on-board Devices Market Revenue (undefined), by Country 2025 & 2033
- Figure 11: North America Smart Fleet-on-board Devices Market Revenue Share (%), by Country 2025 & 2033
- Figure 12: Europe Smart Fleet-on-board Devices Market Revenue (undefined), by Devices 2025 & 2033
- Figure 13: Europe Smart Fleet-on-board Devices Market Revenue Share (%), by Devices 2025 & 2033
- Figure 14: Europe Smart Fleet-on-board Devices Market Revenue (undefined), by Technology 2025 & 2033
- Figure 15: Europe Smart Fleet-on-board Devices Market Revenue Share (%), by Technology 2025 & 2033
- Figure 16: Europe Smart Fleet-on-board Devices Market Revenue (undefined), by Solution 2025 & 2033
- Figure 17: Europe Smart Fleet-on-board Devices Market Revenue Share (%), by Solution 2025 & 2033
- Figure 18: Europe Smart Fleet-on-board Devices Market Revenue (undefined), by Application 2025 & 2033
- Figure 19: Europe Smart Fleet-on-board Devices Market Revenue Share (%), by Application 2025 & 2033
- Figure 20: Europe Smart Fleet-on-board Devices Market Revenue (undefined), by Country 2025 & 2033
- Figure 21: Europe Smart Fleet-on-board Devices Market Revenue Share (%), by Country 2025 & 2033
- Figure 22: Asia Pacific Smart Fleet-on-board Devices Market Revenue (undefined), by Devices 2025 & 2033
- Figure 23: Asia Pacific Smart Fleet-on-board Devices Market Revenue Share (%), by Devices 2025 & 2033
- Figure 24: Asia Pacific Smart Fleet-on-board Devices Market Revenue (undefined), by Technology 2025 & 2033
- Figure 25: Asia Pacific Smart Fleet-on-board Devices Market Revenue Share (%), by Technology 2025 & 2033
- Figure 26: Asia Pacific Smart Fleet-on-board Devices Market Revenue (undefined), by Solution 2025 & 2033
- Figure 27: Asia Pacific Smart Fleet-on-board Devices Market Revenue Share (%), by Solution 2025 & 2033
- Figure 28: Asia Pacific Smart Fleet-on-board Devices Market Revenue (undefined), by Application 2025 & 2033
- Figure 29: Asia Pacific Smart Fleet-on-board Devices Market Revenue Share (%), by Application 2025 & 2033
- Figure 30: Asia Pacific Smart Fleet-on-board Devices Market Revenue (undefined), by Country 2025 & 2033
- Figure 31: Asia Pacific Smart Fleet-on-board Devices Market Revenue Share (%), by Country 2025 & 2033
- Figure 32: South America Smart Fleet-on-board Devices Market Revenue (undefined), by Devices 2025 & 2033
- Figure 33: South America Smart Fleet-on-board Devices Market Revenue Share (%), by Devices 2025 & 2033
- Figure 34: South America Smart Fleet-on-board Devices Market Revenue (undefined), by Technology 2025 & 2033
- Figure 35: South America Smart Fleet-on-board Devices Market Revenue Share (%), by Technology 2025 & 2033
- Figure 36: South America Smart Fleet-on-board Devices Market Revenue (undefined), by Solution 2025 & 2033
- Figure 37: South America Smart Fleet-on-board Devices Market Revenue Share (%), by Solution 2025 & 2033
- Figure 38: South America Smart Fleet-on-board Devices Market Revenue (undefined), by Application 2025 & 2033
- Figure 39: South America Smart Fleet-on-board Devices Market Revenue Share (%), by Application 2025 & 2033
- Figure 40: South America Smart Fleet-on-board Devices Market Revenue (undefined), by Country 2025 & 2033
- Figure 41: South America Smart Fleet-on-board Devices Market Revenue Share (%), by Country 2025 & 2033
- Figure 42: Middle East and Africa Smart Fleet-on-board Devices Market Revenue (undefined), by Devices 2025 & 2033
- Figure 43: Middle East and Africa Smart Fleet-on-board Devices Market Revenue Share (%), by Devices 2025 & 2033
- Figure 44: Middle East and Africa Smart Fleet-on-board Devices Market Revenue (undefined), by Technology 2025 & 2033
- Figure 45: Middle East and Africa Smart Fleet-on-board Devices Market Revenue Share (%), by Technology 2025 & 2033
- Figure 46: Middle East and Africa Smart Fleet-on-board Devices Market Revenue (undefined), by Solution 2025 & 2033
- Figure 47: Middle East and Africa Smart Fleet-on-board Devices Market Revenue Share (%), by Solution 2025 & 2033
- Figure 48: Middle East and Africa Smart Fleet-on-board Devices Market Revenue (undefined), by Application 2025 & 2033
- Figure 49: Middle East and Africa Smart Fleet-on-board Devices Market Revenue Share (%), by Application 2025 & 2033
- Figure 50: Middle East and Africa Smart Fleet-on-board Devices Market Revenue (undefined), by Country 2025 & 2033
- Figure 51: Middle East and Africa Smart Fleet-on-board Devices Market Revenue Share (%), by Country 2025 & 2033
List of Tables
- Table 1: Global Smart Fleet-on-board Devices Market Revenue undefined Forecast, by Devices 2020 & 2033
- Table 2: Global Smart Fleet-on-board Devices Market Revenue undefined Forecast, by Technology 2020 & 2033
- Table 3: Global Smart Fleet-on-board Devices Market Revenue undefined Forecast, by Solution 2020 & 2033
- Table 4: Global Smart Fleet-on-board Devices Market Revenue undefined Forecast, by Application 2020 & 2033
- Table 5: Global Smart Fleet-on-board Devices Market Revenue undefined Forecast, by Region 2020 & 2033
- Table 6: Global Smart Fleet-on-board Devices Market Revenue undefined Forecast, by Devices 2020 & 2033
- Table 7: Global Smart Fleet-on-board Devices Market Revenue undefined Forecast, by Technology 2020 & 2033
- Table 8: Global Smart Fleet-on-board Devices Market Revenue undefined Forecast, by Solution 2020 & 2033
- Table 9: Global Smart Fleet-on-board Devices Market Revenue undefined Forecast, by Application 2020 & 2033
- Table 10: Global Smart Fleet-on-board Devices Market Revenue undefined Forecast, by Country 2020 & 2033
- Table 11: Global Smart Fleet-on-board Devices Market Revenue undefined Forecast, by Devices 2020 & 2033
- Table 12: Global Smart Fleet-on-board Devices Market Revenue undefined Forecast, by Technology 2020 & 2033
- Table 13: Global Smart Fleet-on-board Devices Market Revenue undefined Forecast, by Solution 2020 & 2033
- Table 14: Global Smart Fleet-on-board Devices Market Revenue undefined Forecast, by Application 2020 & 2033
- Table 15: Global Smart Fleet-on-board Devices Market Revenue undefined Forecast, by Country 2020 & 2033
- Table 16: Global Smart Fleet-on-board Devices Market Revenue undefined Forecast, by Devices 2020 & 2033
- Table 17: Global Smart Fleet-on-board Devices Market Revenue undefined Forecast, by Technology 2020 & 2033
- Table 18: Global Smart Fleet-on-board Devices Market Revenue undefined Forecast, by Solution 2020 & 2033
- Table 19: Global Smart Fleet-on-board Devices Market Revenue undefined Forecast, by Application 2020 & 2033
- Table 20: Global Smart Fleet-on-board Devices Market Revenue undefined Forecast, by Country 2020 & 2033
- Table 21: Global Smart Fleet-on-board Devices Market Revenue undefined Forecast, by Devices 2020 & 2033
- Table 22: Global Smart Fleet-on-board Devices Market Revenue undefined Forecast, by Technology 2020 & 2033
- Table 23: Global Smart Fleet-on-board Devices Market Revenue undefined Forecast, by Solution 2020 & 2033
- Table 24: Global Smart Fleet-on-board Devices Market Revenue undefined Forecast, by Application 2020 & 2033
- Table 25: Global Smart Fleet-on-board Devices Market Revenue undefined Forecast, by Country 2020 & 2033
- Table 26: Global Smart Fleet-on-board Devices Market Revenue undefined Forecast, by Devices 2020 & 2033
- Table 27: Global Smart Fleet-on-board Devices Market Revenue undefined Forecast, by Technology 2020 & 2033
- Table 28: Global Smart Fleet-on-board Devices Market Revenue undefined Forecast, by Solution 2020 & 2033
- Table 29: Global Smart Fleet-on-board Devices Market Revenue undefined Forecast, by Application 2020 & 2033
- Table 30: Global Smart Fleet-on-board Devices Market Revenue undefined Forecast, by Country 2020 & 2033
Frequently Asked Questions
1. What is the projected Compound Annual Growth Rate (CAGR) of the Smart Fleet-on-board Devices Market?
The projected CAGR is approximately 8.93%.
2. Which companies are prominent players in the Smart Fleet-on-board Devices Market?
Key companies in the market include Cubic Transportation Systems Limited, Acorel B V *List Not Exhaustive, Trapeze Software Inc (Constellation Software Inc ), Xerox Corporation, Clever Devices Ltd, Hella Aglaia Mobile Vision GmbH, DILAX Intelcom GmbH, Eurotech Inc, Televic N V, 21st Century Technology plc.
3. What are the main segments of the Smart Fleet-on-board Devices Market?
The market segments include Devices, Technology, Solution, Application.
4. Can you provide details about the market size?
The market size is estimated to be USD XXX N/A as of 2022.
5. What are some drivers contributing to market growth?
; Technological Advancement in the Ticketing Systems will Drive the Market Growth; Increase in Adoption of Telematics and Growing Use of Autonomous and Electric Vehicles.
6. What are the notable trends driving market growth?
Technological Advancement in the Ticketing Systems will Drive the Market Growth.
7. Are there any restraints impacting market growth?
; Security and Management of Huge Data Generated Everyday.
8. Can you provide examples of recent developments in the market?
N/A
9. What pricing options are available for accessing the report?
Pricing options include single-user, multi-user, and enterprise licenses priced at USD 4750, USD 5250, and USD 8750 respectively.
10. Is the market size provided in terms of value or volume?
The market size is provided in terms of value, measured in N/A.
11. Are there any specific market keywords associated with the report?
Yes, the market keyword associated with the report is "Smart Fleet-on-board Devices Market," which aids in identifying and referencing the specific market segment covered.
12. How do I determine which pricing option suits my needs best?
The pricing options vary based on user requirements and access needs. Individual users may opt for single-user licenses, while businesses requiring broader access may choose multi-user or enterprise licenses for cost-effective access to the report.
13. Are there any additional resources or data provided in the Smart Fleet-on-board Devices Market report?
While the report offers comprehensive insights, it's advisable to review the specific contents or supplementary materials provided to ascertain if additional resources or data are available.
14. How can I stay updated on further developments or reports in the Smart Fleet-on-board Devices Market?
To stay informed about further developments, trends, and reports in the Smart Fleet-on-board Devices Market, consider subscribing to industry newsletters, following relevant companies and organizations, or regularly checking reputable industry news sources and publications.
Methodology
Step 1 - Identification of Relevant Samples Size from Population Database


Step 2 - Approaches for Defining Global Market Size (Value, Volume* & Price*)

Note*: In applicable scenarios
Step 3 - Data Sources
Primary Research
- Web Analytics
- Survey Reports
- Research Institute
- Latest Research Reports
- Opinion Leaders
Secondary Research
- Annual Reports
- White Paper
- Latest Press Release
- Industry Association
- Paid Database
- Investor Presentations

Step 4 - Data Triangulation
Involves using different sources of information in order to increase the validity of a study
These sources are likely to be stakeholders in a program - participants, other researchers, program staff, other community members, and so on.
Then we put all data in single framework & apply various statistical tools to find out the dynamic on the market.
During the analysis stage, feedback from the stakeholder groups would be compared to determine areas of agreement as well as areas of divergence