
Key Insights
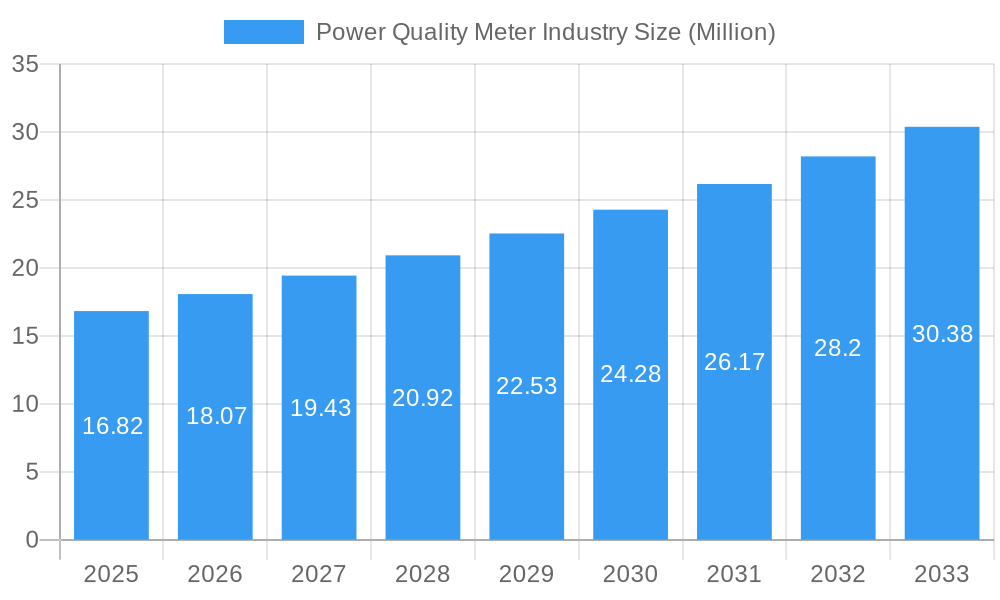
The global power quality meter market, valued at $16.82 million in 2025, is projected to experience robust growth, driven by increasing industrial automation, stringent grid regulations, and the rising adoption of renewable energy sources. The market's Compound Annual Growth Rate (CAGR) of 7.40% from 2025 to 2033 indicates a significant expansion, with substantial opportunities across diverse industrial and commercial sectors. Key growth drivers include the need for enhanced energy efficiency, improved operational reliability, and proactive maintenance strategies to minimize costly downtime. The rising adoption of smart grids and advanced energy management systems further fuels demand, as power quality meters play a crucial role in monitoring and optimizing power distribution. Market segmentation reveals strong growth in three-phase power quality meters due to their widespread usage in large industrial facilities and manufacturing plants. Geographically, North America and Europe currently hold significant market shares, but the Asia-Pacific region is anticipated to witness substantial growth in the coming years, propelled by rapid industrialization and infrastructure development in countries like China and India. The competitive landscape is characterized by several established players such as Active Power Inc, Hitachi Energy Ltd, and Siemens AG, who are continuously innovating to meet evolving market needs through the development of advanced, network-connected meters.
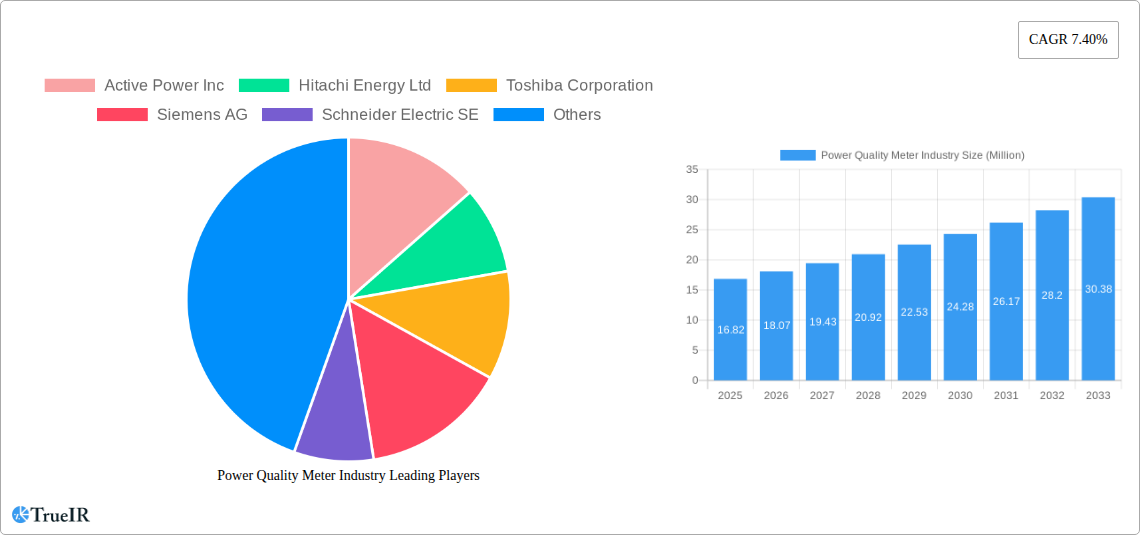
Power Quality Meter Industry Market Size (In Million)
The market's growth is not without its challenges. High initial investment costs for advanced power quality meters can be a barrier to entry for smaller businesses. Furthermore, technical expertise is required for proper installation and data interpretation, which can limit adoption in certain segments. However, the long-term benefits of improved energy efficiency, reduced downtime, and enhanced grid stability far outweigh these initial hurdles. The market's future trajectory will be influenced by technological advancements, including the integration of artificial intelligence (AI) and machine learning (ML) for predictive maintenance and advanced analytics. Furthermore, government initiatives promoting renewable energy and energy efficiency will play a significant role in shaping the market's growth. The continued development of standardized communication protocols will also be crucial for seamless integration of power quality meters into broader energy management systems.
Power Quality Meter Industry Company Market Share
Power Quality Meter Industry Market Report: 2019-2033
This comprehensive report provides a detailed analysis of the global Power Quality Meter industry, offering invaluable insights for stakeholders seeking to navigate this dynamic market. Covering the period 2019-2033, with a focus on 2025, this report examines market size, segmentation, competitive landscape, and future growth prospects. The global market value is projected to reach xx Million by 2033, exhibiting a significant CAGR.
Power Quality Meter Industry Market Structure & Competitive Landscape
The Power Quality Meter industry exhibits a moderately consolidated structure, with key players like Active Power Inc, Hitachi Energy Ltd, Toshiba Corporation, Siemens AG, Schneider Electric SE, EATON Corporation Plc, MTE Corporation, General Electric Company, Schaffner, and Emerson Electric Company holding significant market share. The industry's Herfindahl-Hirschman Index (HHI) is estimated at xx, indicating a moderately competitive environment.
Market Concentration: The top five players account for approximately xx% of the global market revenue in 2025. This concentration is driven by economies of scale, strong brand recognition, and extensive distribution networks.
Innovation Drivers: Continuous advancements in sensor technology, data analytics, and communication protocols are driving innovation, leading to the development of sophisticated power quality meters with enhanced monitoring and diagnostic capabilities. The integration of IoT and AI is a significant trend.
Regulatory Impacts: Stringent government regulations concerning grid stability and energy efficiency are creating significant growth opportunities. Many countries are mandating improved power quality monitoring, driving demand for advanced power quality meters.
Product Substitutes: While no direct substitutes fully replace the functionalities of power quality meters, alternative solutions like power quality analyzers offer overlapping capabilities but often lack the real-time monitoring and data management features of dedicated meters.
End-User Segmentation: The industry caters to diverse end-users, including Industrial and Manufacturing (holding the largest share of xx%), Commercial (xx%), and Others (xx%). The industrial sector's demand is driven by the need for efficient energy management and process optimization.
M&A Trends: The industry has witnessed a moderate level of M&A activity in recent years (xx transactions between 2019-2024, with a total value of xx Million). These acquisitions are often driven by a desire to expand product portfolios, acquire technological capabilities, and access new markets.
Power Quality Meter Industry Market Trends & Opportunities
The global power quality meter market is experiencing robust growth, driven by several key trends. The increasing adoption of renewable energy sources, coupled with the growing demand for reliable and efficient power distribution, is fueling market expansion. The market size is projected to expand from xx Million in 2025 to xx Million by 2033, registering a CAGR of xx%.
Technological advancements like the integration of smart grid technologies, advanced data analytics, and improved communication protocols are transforming the market. The demand for smart meters with enhanced capabilities is on the rise, enabling real-time monitoring, predictive maintenance, and improved grid management. Consumer preference is shifting towards intelligent and connected meters offering enhanced data visualization, remote access capabilities, and seamless integration with existing energy management systems. Competitive dynamics are characterized by technological innovation, strategic partnerships, and the ongoing pursuit of market share by established players and new entrants.
Dominant Markets & Segments in Power Quality Meter Industry
The North American and European regions are currently the dominant markets for power quality meters.
Leading Segments:
- Equipment: Power Quality Meters holds the largest market share amongst the equipment segment, driven by the increasing demand for precise and comprehensive power quality monitoring.
- Phase: Three-phase meters dominate the market due to their suitability for industrial and commercial applications.
- End-Users: The Industrial and Manufacturing sector is the largest consumer, due to the critical need for continuous operation and high energy consumption.
Key Growth Drivers:
- Expanding Smart Grid Infrastructure: Government initiatives promoting smart grid deployments across multiple countries are fueling demand for advanced power quality meters.
- Stringent Energy Efficiency Regulations: Increased regulatory pressure on industrial facilities to optimize energy consumption is driving the adoption of advanced power quality monitoring solutions.
- Industrial Automation & IoT Integration: The growing adoption of automation and IoT within industrial processes enhances the demand for real-time power quality monitoring.
Within the three-phase segment, the industrial and manufacturing sector demonstrates exceptional growth potential, fueled by the increasing emphasis on operational efficiency and energy optimization within production processes.
Power Quality Meter Industry Product Analysis
Recent product innovations focus on improving accuracy, enhancing data analytics capabilities, and integrating advanced communication protocols. New-generation power quality meters offer more comprehensive monitoring, real-time data analysis, and improved remote accessibility. These technological advancements enable proactive maintenance, reducing downtime and operational costs. This strong market fit enhances operational efficiency and reduces energy waste, making these meters increasingly attractive to various industries.
Key Drivers, Barriers & Challenges in Power Quality Meter Industry
Key Drivers:
- Growing adoption of renewable energy sources demands advanced power quality monitoring.
- Increased industrial automation and IoT integration require real-time data insights.
- Stringent regulatory frameworks mandate improved power quality monitoring.
Challenges and Restraints:
- High initial investment costs can hinder adoption, especially for small and medium-sized businesses.
- Complex integration with existing infrastructure can pose challenges in some applications.
- Intense competition among established players and emerging technologies puts downward pressure on profit margins.
Growth Drivers in the Power Quality Meter Industry Market
Technological advancements, especially in areas such as smart grid technologies, advanced data analytics, and improved communication protocols, are major drivers. Government regulations promoting energy efficiency and grid modernization are also significant growth factors. The increasing demand from industrial and commercial sectors for reliable power supply is a further contributor.
Challenges Impacting Power Quality Meter Industry Growth
High initial investment costs, complex integration requirements, and the need for specialized expertise can limit market penetration. Furthermore, intense competition and the potential for technological disruption pose ongoing challenges. Supply chain disruptions can impact production and delivery, particularly in the case of specialized components.
Key Players Shaping the Power Quality Meter Industry Market
Significant Power Quality Meter Industry Industry Milestones
- June 2023: Germany announces plans to digitalize its grid, mandating smart meter roll-outs, significantly boosting the demand for advanced metering solutions.
- March 2023: GE opens the Biblis Grid Stability Power Plant, highlighting the growing focus on grid stability and the related need for accurate power quality monitoring.
Future Outlook for Power Quality Meter Industry Market
The power quality meter market is poised for continued growth, driven by technological innovation, stringent regulations, and increasing demand from diverse end-user segments. Strategic partnerships, expansion into emerging markets, and the development of integrated energy management solutions represent key opportunities for players in this dynamic market. The integration of AI and machine learning promises further advancements, enhancing predictive maintenance and optimizing energy utilization.
Power Quality Meter Industry Segmentation
-
1. Equipment
- 1.1. Uninterruptable Power Supply (UPS)
- 1.2. Harmonic Filters
- 1.3. Static VAR Compensator
- 1.4. Power Quality Meters
- 1.5. Other Equipment Types
-
2. Phase
- 2.1. Single Phase
- 2.2. Three Phase
-
3. End-Users
- 3.1. Industrial and Manufacturing
- 3.2. Commercial
- 3.3. Others End-Users
Power Quality Meter Industry Segmentation By Geography
-
1. North America
- 1.1. United States
- 1.2. Canada
- 1.3. Rest of North America
-
2. Europe
- 2.1. Germany
- 2.2. France
- 2.3. United Kingdom
- 2.4. Italy
- 2.5. Rest of Europe
-
3. Asia Pacific
- 3.1. China
- 3.2. India
- 3.3. Japan
- 3.4. Australia
- 3.5. Rest of Asia Pacific
-
4. South America
- 4.1. Brazil
- 4.2. Argentina
- 4.3. Chile
- 4.4. Rest of South America
-
5. Middle East and Africa
- 5.1. United Arab Emirates
- 5.2. Qatar
- 5.3. Saudi Arabia
- 5.4. South Africa
- 5.5. Egypt
- 5.6. Rest of Middle East and Africa
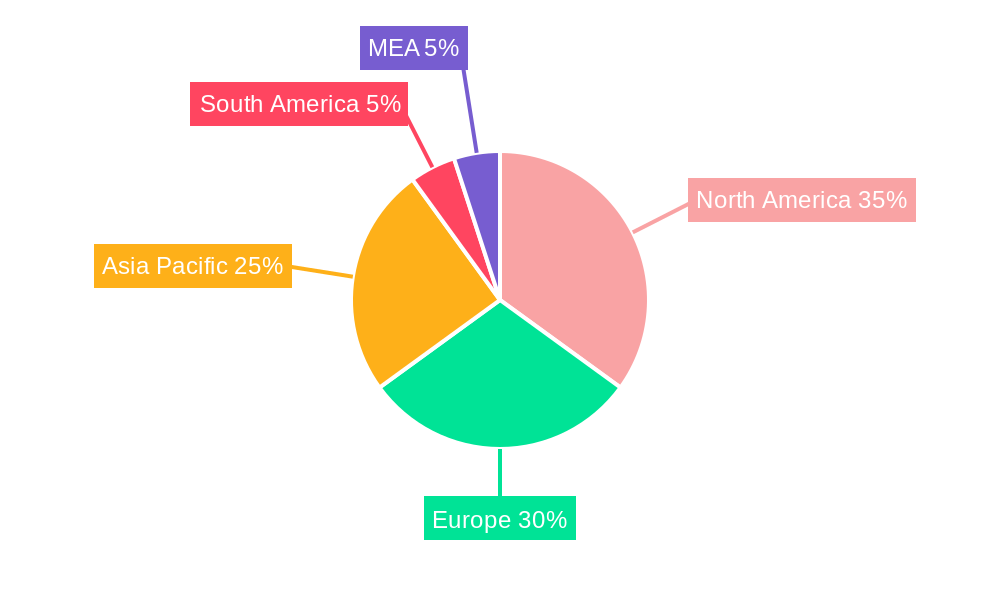
Power Quality Meter Industry Regional Market Share
Geographic Coverage of Power Quality Meter Industry
Power Quality Meter Industry REPORT HIGHLIGHTS
| Aspects | Details |
|---|---|
| Study Period | 2020-2034 |
| Base Year | 2025 |
| Estimated Year | 2026 |
| Forecast Period | 2026-2034 |
| Historical Period | 2020-2025 |
| Growth Rate | CAGR of 7.40% from 2020-2034 |
| Segmentation |
|
Table of Contents
- 1. Introduction
- 1.1. Research Scope
- 1.2. Market Segmentation
- 1.3. Research Methodology
- 1.4. Definitions and Assumptions
- 2. Executive Summary
- 2.1. Introduction
- 3. Market Dynamics
- 3.1. Introduction
- 3.2. Market Drivers
- 3.2.1. 4.; Increasing Demand For Power Quality In Industrial And Manufacturing Sectors4.; Increase In Smart Grid Infrastructure
- 3.3. Market Restrains
- 3.3.1. 4.; High Costs Of Power Quality Equipment
- 3.4. Market Trends
- 3.4.1. Industrial and Manufacturing Segment to Dominate the Market
- 4. Market Factor Analysis
- 4.1. Porters Five Forces
- 4.2. Supply/Value Chain
- 4.3. PESTEL analysis
- 4.4. Market Entropy
- 4.5. Patent/Trademark Analysis
- 5. Global Power Quality Meter Industry Analysis, Insights and Forecast, 2020-2032
- 5.1. Market Analysis, Insights and Forecast - by Equipment
- 5.1.1. Uninterruptable Power Supply (UPS)
- 5.1.2. Harmonic Filters
- 5.1.3. Static VAR Compensator
- 5.1.4. Power Quality Meters
- 5.1.5. Other Equipment Types
- 5.2. Market Analysis, Insights and Forecast - by Phase
- 5.2.1. Single Phase
- 5.2.2. Three Phase
- 5.3. Market Analysis, Insights and Forecast - by End-Users
- 5.3.1. Industrial and Manufacturing
- 5.3.2. Commercial
- 5.3.3. Others End-Users
- 5.4. Market Analysis, Insights and Forecast - by Region
- 5.4.1. North America
- 5.4.2. Europe
- 5.4.3. Asia Pacific
- 5.4.4. South America
- 5.4.5. Middle East and Africa
- 5.1. Market Analysis, Insights and Forecast - by Equipment
- 6. North America Power Quality Meter Industry Analysis, Insights and Forecast, 2020-2032
- 6.1. Market Analysis, Insights and Forecast - by Equipment
- 6.1.1. Uninterruptable Power Supply (UPS)
- 6.1.2. Harmonic Filters
- 6.1.3. Static VAR Compensator
- 6.1.4. Power Quality Meters
- 6.1.5. Other Equipment Types
- 6.2. Market Analysis, Insights and Forecast - by Phase
- 6.2.1. Single Phase
- 6.2.2. Three Phase
- 6.3. Market Analysis, Insights and Forecast - by End-Users
- 6.3.1. Industrial and Manufacturing
- 6.3.2. Commercial
- 6.3.3. Others End-Users
- 6.1. Market Analysis, Insights and Forecast - by Equipment
- 7. Europe Power Quality Meter Industry Analysis, Insights and Forecast, 2020-2032
- 7.1. Market Analysis, Insights and Forecast - by Equipment
- 7.1.1. Uninterruptable Power Supply (UPS)
- 7.1.2. Harmonic Filters
- 7.1.3. Static VAR Compensator
- 7.1.4. Power Quality Meters
- 7.1.5. Other Equipment Types
- 7.2. Market Analysis, Insights and Forecast - by Phase
- 7.2.1. Single Phase
- 7.2.2. Three Phase
- 7.3. Market Analysis, Insights and Forecast - by End-Users
- 7.3.1. Industrial and Manufacturing
- 7.3.2. Commercial
- 7.3.3. Others End-Users
- 7.1. Market Analysis, Insights and Forecast - by Equipment
- 8. Asia Pacific Power Quality Meter Industry Analysis, Insights and Forecast, 2020-2032
- 8.1. Market Analysis, Insights and Forecast - by Equipment
- 8.1.1. Uninterruptable Power Supply (UPS)
- 8.1.2. Harmonic Filters
- 8.1.3. Static VAR Compensator
- 8.1.4. Power Quality Meters
- 8.1.5. Other Equipment Types
- 8.2. Market Analysis, Insights and Forecast - by Phase
- 8.2.1. Single Phase
- 8.2.2. Three Phase
- 8.3. Market Analysis, Insights and Forecast - by End-Users
- 8.3.1. Industrial and Manufacturing
- 8.3.2. Commercial
- 8.3.3. Others End-Users
- 8.1. Market Analysis, Insights and Forecast - by Equipment
- 9. South America Power Quality Meter Industry Analysis, Insights and Forecast, 2020-2032
- 9.1. Market Analysis, Insights and Forecast - by Equipment
- 9.1.1. Uninterruptable Power Supply (UPS)
- 9.1.2. Harmonic Filters
- 9.1.3. Static VAR Compensator
- 9.1.4. Power Quality Meters
- 9.1.5. Other Equipment Types
- 9.2. Market Analysis, Insights and Forecast - by Phase
- 9.2.1. Single Phase
- 9.2.2. Three Phase
- 9.3. Market Analysis, Insights and Forecast - by End-Users
- 9.3.1. Industrial and Manufacturing
- 9.3.2. Commercial
- 9.3.3. Others End-Users
- 9.1. Market Analysis, Insights and Forecast - by Equipment
- 10. Middle East and Africa Power Quality Meter Industry Analysis, Insights and Forecast, 2020-2032
- 10.1. Market Analysis, Insights and Forecast - by Equipment
- 10.1.1. Uninterruptable Power Supply (UPS)
- 10.1.2. Harmonic Filters
- 10.1.3. Static VAR Compensator
- 10.1.4. Power Quality Meters
- 10.1.5. Other Equipment Types
- 10.2. Market Analysis, Insights and Forecast - by Phase
- 10.2.1. Single Phase
- 10.2.2. Three Phase
- 10.3. Market Analysis, Insights and Forecast - by End-Users
- 10.3.1. Industrial and Manufacturing
- 10.3.2. Commercial
- 10.3.3. Others End-Users
- 10.1. Market Analysis, Insights and Forecast - by Equipment
- 11. North America Power Quality Meter Industry Analysis, Insights and Forecast, 2020-2032
- 11.1. Market Analysis, Insights and Forecast - By Country/Sub-region
- 11.1.1 United States
- 11.1.2 Canada
- 11.1.3 Mexico
- 12. Europe Power Quality Meter Industry Analysis, Insights and Forecast, 2020-2032
- 12.1. Market Analysis, Insights and Forecast - By Country/Sub-region
- 12.1.1 Germany
- 12.1.2 United Kingdom
- 12.1.3 France
- 12.1.4 Spain
- 12.1.5 Italy
- 12.1.6 Spain
- 12.1.7 Belgium
- 12.1.8 Netherland
- 12.1.9 Nordics
- 12.1.10 Rest of Europe
- 13. Asia Pacific Power Quality Meter Industry Analysis, Insights and Forecast, 2020-2032
- 13.1. Market Analysis, Insights and Forecast - By Country/Sub-region
- 13.1.1 China
- 13.1.2 Japan
- 13.1.3 India
- 13.1.4 South Korea
- 13.1.5 Southeast Asia
- 13.1.6 Australia
- 13.1.7 Indonesia
- 13.1.8 Phillipes
- 13.1.9 Singapore
- 13.1.10 Thailandc
- 13.1.11 Rest of Asia Pacific
- 14. South America Power Quality Meter Industry Analysis, Insights and Forecast, 2020-2032
- 14.1. Market Analysis, Insights and Forecast - By Country/Sub-region
- 14.1.1 Brazil
- 14.1.2 Argentina
- 14.1.3 Peru
- 14.1.4 Chile
- 14.1.5 Colombia
- 14.1.6 Ecuador
- 14.1.7 Venezuela
- 14.1.8 Rest of South America
- 15. MEA Power Quality Meter Industry Analysis, Insights and Forecast, 2020-2032
- 15.1. Market Analysis, Insights and Forecast - By Country/Sub-region
- 15.1.1 United Arab Emirates
- 15.1.2 Saudi Arabia
- 15.1.3 South Africa
- 15.1.4 Rest of Middle East and Africa
- 16. Competitive Analysis
- 16.1. Global Market Share Analysis 2025
- 16.2. Company Profiles
- 16.2.1 Active Power Inc
- 16.2.1.1. Overview
- 16.2.1.2. Products
- 16.2.1.3. SWOT Analysis
- 16.2.1.4. Recent Developments
- 16.2.1.5. Financials (Based on Availability)
- 16.2.2 Hitachi Energy Ltd
- 16.2.2.1. Overview
- 16.2.2.2. Products
- 16.2.2.3. SWOT Analysis
- 16.2.2.4. Recent Developments
- 16.2.2.5. Financials (Based on Availability)
- 16.2.3 Toshiba Corporation
- 16.2.3.1. Overview
- 16.2.3.2. Products
- 16.2.3.3. SWOT Analysis
- 16.2.3.4. Recent Developments
- 16.2.3.5. Financials (Based on Availability)
- 16.2.4 Siemens AG
- 16.2.4.1. Overview
- 16.2.4.2. Products
- 16.2.4.3. SWOT Analysis
- 16.2.4.4. Recent Developments
- 16.2.4.5. Financials (Based on Availability)
- 16.2.5 Schneider Electric SE
- 16.2.5.1. Overview
- 16.2.5.2. Products
- 16.2.5.3. SWOT Analysis
- 16.2.5.4. Recent Developments
- 16.2.5.5. Financials (Based on Availability)
- 16.2.6 EATON Corporation Plc
- 16.2.6.1. Overview
- 16.2.6.2. Products
- 16.2.6.3. SWOT Analysis
- 16.2.6.4. Recent Developments
- 16.2.6.5. Financials (Based on Availability)
- 16.2.7 MTE Corporation
- 16.2.7.1. Overview
- 16.2.7.2. Products
- 16.2.7.3. SWOT Analysis
- 16.2.7.4. Recent Developments
- 16.2.7.5. Financials (Based on Availability)
- 16.2.8 General Electric Company
- 16.2.8.1. Overview
- 16.2.8.2. Products
- 16.2.8.3. SWOT Analysis
- 16.2.8.4. Recent Developments
- 16.2.8.5. Financials (Based on Availability)
- 16.2.9 Schaffner
- 16.2.9.1. Overview
- 16.2.9.2. Products
- 16.2.9.3. SWOT Analysis
- 16.2.9.4. Recent Developments
- 16.2.9.5. Financials (Based on Availability)
- 16.2.10 Emerson Electric Company
- 16.2.10.1. Overview
- 16.2.10.2. Products
- 16.2.10.3. SWOT Analysis
- 16.2.10.4. Recent Developments
- 16.2.10.5. Financials (Based on Availability)
- 16.2.1 Active Power Inc
List of Figures
- Figure 1: Global Power Quality Meter Industry Revenue Breakdown (Million, %) by Region 2025 & 2033
- Figure 2: Global Power Quality Meter Industry Volume Breakdown (K Unit, %) by Region 2025 & 2033
- Figure 3: North America Power Quality Meter Industry Revenue (Million), by Country 2025 & 2033
- Figure 4: North America Power Quality Meter Industry Volume (K Unit), by Country 2025 & 2033
- Figure 5: North America Power Quality Meter Industry Revenue Share (%), by Country 2025 & 2033
- Figure 6: North America Power Quality Meter Industry Volume Share (%), by Country 2025 & 2033
- Figure 7: Europe Power Quality Meter Industry Revenue (Million), by Country 2025 & 2033
- Figure 8: Europe Power Quality Meter Industry Volume (K Unit), by Country 2025 & 2033
- Figure 9: Europe Power Quality Meter Industry Revenue Share (%), by Country 2025 & 2033
- Figure 10: Europe Power Quality Meter Industry Volume Share (%), by Country 2025 & 2033
- Figure 11: Asia Pacific Power Quality Meter Industry Revenue (Million), by Country 2025 & 2033
- Figure 12: Asia Pacific Power Quality Meter Industry Volume (K Unit), by Country 2025 & 2033
- Figure 13: Asia Pacific Power Quality Meter Industry Revenue Share (%), by Country 2025 & 2033
- Figure 14: Asia Pacific Power Quality Meter Industry Volume Share (%), by Country 2025 & 2033
- Figure 15: South America Power Quality Meter Industry Revenue (Million), by Country 2025 & 2033
- Figure 16: South America Power Quality Meter Industry Volume (K Unit), by Country 2025 & 2033
- Figure 17: South America Power Quality Meter Industry Revenue Share (%), by Country 2025 & 2033
- Figure 18: South America Power Quality Meter Industry Volume Share (%), by Country 2025 & 2033
- Figure 19: MEA Power Quality Meter Industry Revenue (Million), by Country 2025 & 2033
- Figure 20: MEA Power Quality Meter Industry Volume (K Unit), by Country 2025 & 2033
- Figure 21: MEA Power Quality Meter Industry Revenue Share (%), by Country 2025 & 2033
- Figure 22: MEA Power Quality Meter Industry Volume Share (%), by Country 2025 & 2033
- Figure 23: North America Power Quality Meter Industry Revenue (Million), by Equipment 2025 & 2033
- Figure 24: North America Power Quality Meter Industry Volume (K Unit), by Equipment 2025 & 2033
- Figure 25: North America Power Quality Meter Industry Revenue Share (%), by Equipment 2025 & 2033
- Figure 26: North America Power Quality Meter Industry Volume Share (%), by Equipment 2025 & 2033
- Figure 27: North America Power Quality Meter Industry Revenue (Million), by Phase 2025 & 2033
- Figure 28: North America Power Quality Meter Industry Volume (K Unit), by Phase 2025 & 2033
- Figure 29: North America Power Quality Meter Industry Revenue Share (%), by Phase 2025 & 2033
- Figure 30: North America Power Quality Meter Industry Volume Share (%), by Phase 2025 & 2033
- Figure 31: North America Power Quality Meter Industry Revenue (Million), by End-Users 2025 & 2033
- Figure 32: North America Power Quality Meter Industry Volume (K Unit), by End-Users 2025 & 2033
- Figure 33: North America Power Quality Meter Industry Revenue Share (%), by End-Users 2025 & 2033
- Figure 34: North America Power Quality Meter Industry Volume Share (%), by End-Users 2025 & 2033
- Figure 35: North America Power Quality Meter Industry Revenue (Million), by Country 2025 & 2033
- Figure 36: North America Power Quality Meter Industry Volume (K Unit), by Country 2025 & 2033
- Figure 37: North America Power Quality Meter Industry Revenue Share (%), by Country 2025 & 2033
- Figure 38: North America Power Quality Meter Industry Volume Share (%), by Country 2025 & 2033
- Figure 39: Europe Power Quality Meter Industry Revenue (Million), by Equipment 2025 & 2033
- Figure 40: Europe Power Quality Meter Industry Volume (K Unit), by Equipment 2025 & 2033
- Figure 41: Europe Power Quality Meter Industry Revenue Share (%), by Equipment 2025 & 2033
- Figure 42: Europe Power Quality Meter Industry Volume Share (%), by Equipment 2025 & 2033
- Figure 43: Europe Power Quality Meter Industry Revenue (Million), by Phase 2025 & 2033
- Figure 44: Europe Power Quality Meter Industry Volume (K Unit), by Phase 2025 & 2033
- Figure 45: Europe Power Quality Meter Industry Revenue Share (%), by Phase 2025 & 2033
- Figure 46: Europe Power Quality Meter Industry Volume Share (%), by Phase 2025 & 2033
- Figure 47: Europe Power Quality Meter Industry Revenue (Million), by End-Users 2025 & 2033
- Figure 48: Europe Power Quality Meter Industry Volume (K Unit), by End-Users 2025 & 2033
- Figure 49: Europe Power Quality Meter Industry Revenue Share (%), by End-Users 2025 & 2033
- Figure 50: Europe Power Quality Meter Industry Volume Share (%), by End-Users 2025 & 2033
- Figure 51: Europe Power Quality Meter Industry Revenue (Million), by Country 2025 & 2033
- Figure 52: Europe Power Quality Meter Industry Volume (K Unit), by Country 2025 & 2033
- Figure 53: Europe Power Quality Meter Industry Revenue Share (%), by Country 2025 & 2033
- Figure 54: Europe Power Quality Meter Industry Volume Share (%), by Country 2025 & 2033
- Figure 55: Asia Pacific Power Quality Meter Industry Revenue (Million), by Equipment 2025 & 2033
- Figure 56: Asia Pacific Power Quality Meter Industry Volume (K Unit), by Equipment 2025 & 2033
- Figure 57: Asia Pacific Power Quality Meter Industry Revenue Share (%), by Equipment 2025 & 2033
- Figure 58: Asia Pacific Power Quality Meter Industry Volume Share (%), by Equipment 2025 & 2033
- Figure 59: Asia Pacific Power Quality Meter Industry Revenue (Million), by Phase 2025 & 2033
- Figure 60: Asia Pacific Power Quality Meter Industry Volume (K Unit), by Phase 2025 & 2033
- Figure 61: Asia Pacific Power Quality Meter Industry Revenue Share (%), by Phase 2025 & 2033
- Figure 62: Asia Pacific Power Quality Meter Industry Volume Share (%), by Phase 2025 & 2033
- Figure 63: Asia Pacific Power Quality Meter Industry Revenue (Million), by End-Users 2025 & 2033
- Figure 64: Asia Pacific Power Quality Meter Industry Volume (K Unit), by End-Users 2025 & 2033
- Figure 65: Asia Pacific Power Quality Meter Industry Revenue Share (%), by End-Users 2025 & 2033
- Figure 66: Asia Pacific Power Quality Meter Industry Volume Share (%), by End-Users 2025 & 2033
- Figure 67: Asia Pacific Power Quality Meter Industry Revenue (Million), by Country 2025 & 2033
- Figure 68: Asia Pacific Power Quality Meter Industry Volume (K Unit), by Country 2025 & 2033
- Figure 69: Asia Pacific Power Quality Meter Industry Revenue Share (%), by Country 2025 & 2033
- Figure 70: Asia Pacific Power Quality Meter Industry Volume Share (%), by Country 2025 & 2033
- Figure 71: South America Power Quality Meter Industry Revenue (Million), by Equipment 2025 & 2033
- Figure 72: South America Power Quality Meter Industry Volume (K Unit), by Equipment 2025 & 2033
- Figure 73: South America Power Quality Meter Industry Revenue Share (%), by Equipment 2025 & 2033
- Figure 74: South America Power Quality Meter Industry Volume Share (%), by Equipment 2025 & 2033
- Figure 75: South America Power Quality Meter Industry Revenue (Million), by Phase 2025 & 2033
- Figure 76: South America Power Quality Meter Industry Volume (K Unit), by Phase 2025 & 2033
- Figure 77: South America Power Quality Meter Industry Revenue Share (%), by Phase 2025 & 2033
- Figure 78: South America Power Quality Meter Industry Volume Share (%), by Phase 2025 & 2033
- Figure 79: South America Power Quality Meter Industry Revenue (Million), by End-Users 2025 & 2033
- Figure 80: South America Power Quality Meter Industry Volume (K Unit), by End-Users 2025 & 2033
- Figure 81: South America Power Quality Meter Industry Revenue Share (%), by End-Users 2025 & 2033
- Figure 82: South America Power Quality Meter Industry Volume Share (%), by End-Users 2025 & 2033
- Figure 83: South America Power Quality Meter Industry Revenue (Million), by Country 2025 & 2033
- Figure 84: South America Power Quality Meter Industry Volume (K Unit), by Country 2025 & 2033
- Figure 85: South America Power Quality Meter Industry Revenue Share (%), by Country 2025 & 2033
- Figure 86: South America Power Quality Meter Industry Volume Share (%), by Country 2025 & 2033
- Figure 87: Middle East and Africa Power Quality Meter Industry Revenue (Million), by Equipment 2025 & 2033
- Figure 88: Middle East and Africa Power Quality Meter Industry Volume (K Unit), by Equipment 2025 & 2033
- Figure 89: Middle East and Africa Power Quality Meter Industry Revenue Share (%), by Equipment 2025 & 2033
- Figure 90: Middle East and Africa Power Quality Meter Industry Volume Share (%), by Equipment 2025 & 2033
- Figure 91: Middle East and Africa Power Quality Meter Industry Revenue (Million), by Phase 2025 & 2033
- Figure 92: Middle East and Africa Power Quality Meter Industry Volume (K Unit), by Phase 2025 & 2033
- Figure 93: Middle East and Africa Power Quality Meter Industry Revenue Share (%), by Phase 2025 & 2033
- Figure 94: Middle East and Africa Power Quality Meter Industry Volume Share (%), by Phase 2025 & 2033
- Figure 95: Middle East and Africa Power Quality Meter Industry Revenue (Million), by End-Users 2025 & 2033
- Figure 96: Middle East and Africa Power Quality Meter Industry Volume (K Unit), by End-Users 2025 & 2033
- Figure 97: Middle East and Africa Power Quality Meter Industry Revenue Share (%), by End-Users 2025 & 2033
- Figure 98: Middle East and Africa Power Quality Meter Industry Volume Share (%), by End-Users 2025 & 2033
- Figure 99: Middle East and Africa Power Quality Meter Industry Revenue (Million), by Country 2025 & 2033
- Figure 100: Middle East and Africa Power Quality Meter Industry Volume (K Unit), by Country 2025 & 2033
- Figure 101: Middle East and Africa Power Quality Meter Industry Revenue Share (%), by Country 2025 & 2033
- Figure 102: Middle East and Africa Power Quality Meter Industry Volume Share (%), by Country 2025 & 2033
List of Tables
- Table 1: Global Power Quality Meter Industry Revenue Million Forecast, by Region 2020 & 2033
- Table 2: Global Power Quality Meter Industry Volume K Unit Forecast, by Region 2020 & 2033
- Table 3: Global Power Quality Meter Industry Revenue Million Forecast, by Equipment 2020 & 2033
- Table 4: Global Power Quality Meter Industry Volume K Unit Forecast, by Equipment 2020 & 2033
- Table 5: Global Power Quality Meter Industry Revenue Million Forecast, by Phase 2020 & 2033
- Table 6: Global Power Quality Meter Industry Volume K Unit Forecast, by Phase 2020 & 2033
- Table 7: Global Power Quality Meter Industry Revenue Million Forecast, by End-Users 2020 & 2033
- Table 8: Global Power Quality Meter Industry Volume K Unit Forecast, by End-Users 2020 & 2033
- Table 9: Global Power Quality Meter Industry Revenue Million Forecast, by Region 2020 & 2033
- Table 10: Global Power Quality Meter Industry Volume K Unit Forecast, by Region 2020 & 2033
- Table 11: Global Power Quality Meter Industry Revenue Million Forecast, by Country 2020 & 2033
- Table 12: Global Power Quality Meter Industry Volume K Unit Forecast, by Country 2020 & 2033
- Table 13: United States Power Quality Meter Industry Revenue (Million) Forecast, by Application 2020 & 2033
- Table 14: United States Power Quality Meter Industry Volume (K Unit) Forecast, by Application 2020 & 2033
- Table 15: Canada Power Quality Meter Industry Revenue (Million) Forecast, by Application 2020 & 2033
- Table 16: Canada Power Quality Meter Industry Volume (K Unit) Forecast, by Application 2020 & 2033
- Table 17: Mexico Power Quality Meter Industry Revenue (Million) Forecast, by Application 2020 & 2033
- Table 18: Mexico Power Quality Meter Industry Volume (K Unit) Forecast, by Application 2020 & 2033
- Table 19: Global Power Quality Meter Industry Revenue Million Forecast, by Country 2020 & 2033
- Table 20: Global Power Quality Meter Industry Volume K Unit Forecast, by Country 2020 & 2033
- Table 21: Germany Power Quality Meter Industry Revenue (Million) Forecast, by Application 2020 & 2033
- Table 22: Germany Power Quality Meter Industry Volume (K Unit) Forecast, by Application 2020 & 2033
- Table 23: United Kingdom Power Quality Meter Industry Revenue (Million) Forecast, by Application 2020 & 2033
- Table 24: United Kingdom Power Quality Meter Industry Volume (K Unit) Forecast, by Application 2020 & 2033
- Table 25: France Power Quality Meter Industry Revenue (Million) Forecast, by Application 2020 & 2033
- Table 26: France Power Quality Meter Industry Volume (K Unit) Forecast, by Application 2020 & 2033
- Table 27: Spain Power Quality Meter Industry Revenue (Million) Forecast, by Application 2020 & 2033
- Table 28: Spain Power Quality Meter Industry Volume (K Unit) Forecast, by Application 2020 & 2033
- Table 29: Italy Power Quality Meter Industry Revenue (Million) Forecast, by Application 2020 & 2033
- Table 30: Italy Power Quality Meter Industry Volume (K Unit) Forecast, by Application 2020 & 2033
- Table 31: Spain Power Quality Meter Industry Revenue (Million) Forecast, by Application 2020 & 2033
- Table 32: Spain Power Quality Meter Industry Volume (K Unit) Forecast, by Application 2020 & 2033
- Table 33: Belgium Power Quality Meter Industry Revenue (Million) Forecast, by Application 2020 & 2033
- Table 34: Belgium Power Quality Meter Industry Volume (K Unit) Forecast, by Application 2020 & 2033
- Table 35: Netherland Power Quality Meter Industry Revenue (Million) Forecast, by Application 2020 & 2033
- Table 36: Netherland Power Quality Meter Industry Volume (K Unit) Forecast, by Application 2020 & 2033
- Table 37: Nordics Power Quality Meter Industry Revenue (Million) Forecast, by Application 2020 & 2033
- Table 38: Nordics Power Quality Meter Industry Volume (K Unit) Forecast, by Application 2020 & 2033
- Table 39: Rest of Europe Power Quality Meter Industry Revenue (Million) Forecast, by Application 2020 & 2033
- Table 40: Rest of Europe Power Quality Meter Industry Volume (K Unit) Forecast, by Application 2020 & 2033
- Table 41: Global Power Quality Meter Industry Revenue Million Forecast, by Country 2020 & 2033
- Table 42: Global Power Quality Meter Industry Volume K Unit Forecast, by Country 2020 & 2033
- Table 43: China Power Quality Meter Industry Revenue (Million) Forecast, by Application 2020 & 2033
- Table 44: China Power Quality Meter Industry Volume (K Unit) Forecast, by Application 2020 & 2033
- Table 45: Japan Power Quality Meter Industry Revenue (Million) Forecast, by Application 2020 & 2033
- Table 46: Japan Power Quality Meter Industry Volume (K Unit) Forecast, by Application 2020 & 2033
- Table 47: India Power Quality Meter Industry Revenue (Million) Forecast, by Application 2020 & 2033
- Table 48: India Power Quality Meter Industry Volume (K Unit) Forecast, by Application 2020 & 2033
- Table 49: South Korea Power Quality Meter Industry Revenue (Million) Forecast, by Application 2020 & 2033
- Table 50: South Korea Power Quality Meter Industry Volume (K Unit) Forecast, by Application 2020 & 2033
- Table 51: Southeast Asia Power Quality Meter Industry Revenue (Million) Forecast, by Application 2020 & 2033
- Table 52: Southeast Asia Power Quality Meter Industry Volume (K Unit) Forecast, by Application 2020 & 2033
- Table 53: Australia Power Quality Meter Industry Revenue (Million) Forecast, by Application 2020 & 2033
- Table 54: Australia Power Quality Meter Industry Volume (K Unit) Forecast, by Application 2020 & 2033
- Table 55: Indonesia Power Quality Meter Industry Revenue (Million) Forecast, by Application 2020 & 2033
- Table 56: Indonesia Power Quality Meter Industry Volume (K Unit) Forecast, by Application 2020 & 2033
- Table 57: Phillipes Power Quality Meter Industry Revenue (Million) Forecast, by Application 2020 & 2033
- Table 58: Phillipes Power Quality Meter Industry Volume (K Unit) Forecast, by Application 2020 & 2033
- Table 59: Singapore Power Quality Meter Industry Revenue (Million) Forecast, by Application 2020 & 2033
- Table 60: Singapore Power Quality Meter Industry Volume (K Unit) Forecast, by Application 2020 & 2033
- Table 61: Thailandc Power Quality Meter Industry Revenue (Million) Forecast, by Application 2020 & 2033
- Table 62: Thailandc Power Quality Meter Industry Volume (K Unit) Forecast, by Application 2020 & 2033
- Table 63: Rest of Asia Pacific Power Quality Meter Industry Revenue (Million) Forecast, by Application 2020 & 2033
- Table 64: Rest of Asia Pacific Power Quality Meter Industry Volume (K Unit) Forecast, by Application 2020 & 2033
- Table 65: Global Power Quality Meter Industry Revenue Million Forecast, by Country 2020 & 2033
- Table 66: Global Power Quality Meter Industry Volume K Unit Forecast, by Country 2020 & 2033
- Table 67: Brazil Power Quality Meter Industry Revenue (Million) Forecast, by Application 2020 & 2033
- Table 68: Brazil Power Quality Meter Industry Volume (K Unit) Forecast, by Application 2020 & 2033
- Table 69: Argentina Power Quality Meter Industry Revenue (Million) Forecast, by Application 2020 & 2033
- Table 70: Argentina Power Quality Meter Industry Volume (K Unit) Forecast, by Application 2020 & 2033
- Table 71: Peru Power Quality Meter Industry Revenue (Million) Forecast, by Application 2020 & 2033
- Table 72: Peru Power Quality Meter Industry Volume (K Unit) Forecast, by Application 2020 & 2033
- Table 73: Chile Power Quality Meter Industry Revenue (Million) Forecast, by Application 2020 & 2033
- Table 74: Chile Power Quality Meter Industry Volume (K Unit) Forecast, by Application 2020 & 2033
- Table 75: Colombia Power Quality Meter Industry Revenue (Million) Forecast, by Application 2020 & 2033
- Table 76: Colombia Power Quality Meter Industry Volume (K Unit) Forecast, by Application 2020 & 2033
- Table 77: Ecuador Power Quality Meter Industry Revenue (Million) Forecast, by Application 2020 & 2033
- Table 78: Ecuador Power Quality Meter Industry Volume (K Unit) Forecast, by Application 2020 & 2033
- Table 79: Venezuela Power Quality Meter Industry Revenue (Million) Forecast, by Application 2020 & 2033
- Table 80: Venezuela Power Quality Meter Industry Volume (K Unit) Forecast, by Application 2020 & 2033
- Table 81: Rest of South America Power Quality Meter Industry Revenue (Million) Forecast, by Application 2020 & 2033
- Table 82: Rest of South America Power Quality Meter Industry Volume (K Unit) Forecast, by Application 2020 & 2033
- Table 83: Global Power Quality Meter Industry Revenue Million Forecast, by Country 2020 & 2033
- Table 84: Global Power Quality Meter Industry Volume K Unit Forecast, by Country 2020 & 2033
- Table 85: United Arab Emirates Power Quality Meter Industry Revenue (Million) Forecast, by Application 2020 & 2033
- Table 86: United Arab Emirates Power Quality Meter Industry Volume (K Unit) Forecast, by Application 2020 & 2033
- Table 87: Saudi Arabia Power Quality Meter Industry Revenue (Million) Forecast, by Application 2020 & 2033
- Table 88: Saudi Arabia Power Quality Meter Industry Volume (K Unit) Forecast, by Application 2020 & 2033
- Table 89: South Africa Power Quality Meter Industry Revenue (Million) Forecast, by Application 2020 & 2033
- Table 90: South Africa Power Quality Meter Industry Volume (K Unit) Forecast, by Application 2020 & 2033
- Table 91: Rest of Middle East and Africa Power Quality Meter Industry Revenue (Million) Forecast, by Application 2020 & 2033
- Table 92: Rest of Middle East and Africa Power Quality Meter Industry Volume (K Unit) Forecast, by Application 2020 & 2033
- Table 93: Global Power Quality Meter Industry Revenue Million Forecast, by Equipment 2020 & 2033
- Table 94: Global Power Quality Meter Industry Volume K Unit Forecast, by Equipment 2020 & 2033
- Table 95: Global Power Quality Meter Industry Revenue Million Forecast, by Phase 2020 & 2033
- Table 96: Global Power Quality Meter Industry Volume K Unit Forecast, by Phase 2020 & 2033
- Table 97: Global Power Quality Meter Industry Revenue Million Forecast, by End-Users 2020 & 2033
- Table 98: Global Power Quality Meter Industry Volume K Unit Forecast, by End-Users 2020 & 2033
- Table 99: Global Power Quality Meter Industry Revenue Million Forecast, by Country 2020 & 2033
- Table 100: Global Power Quality Meter Industry Volume K Unit Forecast, by Country 2020 & 2033
- Table 101: United States Power Quality Meter Industry Revenue (Million) Forecast, by Application 2020 & 2033
- Table 102: United States Power Quality Meter Industry Volume (K Unit) Forecast, by Application 2020 & 2033
- Table 103: Canada Power Quality Meter Industry Revenue (Million) Forecast, by Application 2020 & 2033
- Table 104: Canada Power Quality Meter Industry Volume (K Unit) Forecast, by Application 2020 & 2033
- Table 105: Rest of North America Power Quality Meter Industry Revenue (Million) Forecast, by Application 2020 & 2033
- Table 106: Rest of North America Power Quality Meter Industry Volume (K Unit) Forecast, by Application 2020 & 2033
- Table 107: Global Power Quality Meter Industry Revenue Million Forecast, by Equipment 2020 & 2033
- Table 108: Global Power Quality Meter Industry Volume K Unit Forecast, by Equipment 2020 & 2033
- Table 109: Global Power Quality Meter Industry Revenue Million Forecast, by Phase 2020 & 2033
- Table 110: Global Power Quality Meter Industry Volume K Unit Forecast, by Phase 2020 & 2033
- Table 111: Global Power Quality Meter Industry Revenue Million Forecast, by End-Users 2020 & 2033
- Table 112: Global Power Quality Meter Industry Volume K Unit Forecast, by End-Users 2020 & 2033
- Table 113: Global Power Quality Meter Industry Revenue Million Forecast, by Country 2020 & 2033
- Table 114: Global Power Quality Meter Industry Volume K Unit Forecast, by Country 2020 & 2033
- Table 115: Germany Power Quality Meter Industry Revenue (Million) Forecast, by Application 2020 & 2033
- Table 116: Germany Power Quality Meter Industry Volume (K Unit) Forecast, by Application 2020 & 2033
- Table 117: France Power Quality Meter Industry Revenue (Million) Forecast, by Application 2020 & 2033
- Table 118: France Power Quality Meter Industry Volume (K Unit) Forecast, by Application 2020 & 2033
- Table 119: United Kingdom Power Quality Meter Industry Revenue (Million) Forecast, by Application 2020 & 2033
- Table 120: United Kingdom Power Quality Meter Industry Volume (K Unit) Forecast, by Application 2020 & 2033
- Table 121: Italy Power Quality Meter Industry Revenue (Million) Forecast, by Application 2020 & 2033
- Table 122: Italy Power Quality Meter Industry Volume (K Unit) Forecast, by Application 2020 & 2033
- Table 123: Rest of Europe Power Quality Meter Industry Revenue (Million) Forecast, by Application 2020 & 2033
- Table 124: Rest of Europe Power Quality Meter Industry Volume (K Unit) Forecast, by Application 2020 & 2033
- Table 125: Global Power Quality Meter Industry Revenue Million Forecast, by Equipment 2020 & 2033
- Table 126: Global Power Quality Meter Industry Volume K Unit Forecast, by Equipment 2020 & 2033
- Table 127: Global Power Quality Meter Industry Revenue Million Forecast, by Phase 2020 & 2033
- Table 128: Global Power Quality Meter Industry Volume K Unit Forecast, by Phase 2020 & 2033
- Table 129: Global Power Quality Meter Industry Revenue Million Forecast, by End-Users 2020 & 2033
- Table 130: Global Power Quality Meter Industry Volume K Unit Forecast, by End-Users 2020 & 2033
- Table 131: Global Power Quality Meter Industry Revenue Million Forecast, by Country 2020 & 2033
- Table 132: Global Power Quality Meter Industry Volume K Unit Forecast, by Country 2020 & 2033
- Table 133: China Power Quality Meter Industry Revenue (Million) Forecast, by Application 2020 & 2033
- Table 134: China Power Quality Meter Industry Volume (K Unit) Forecast, by Application 2020 & 2033
- Table 135: India Power Quality Meter Industry Revenue (Million) Forecast, by Application 2020 & 2033
- Table 136: India Power Quality Meter Industry Volume (K Unit) Forecast, by Application 2020 & 2033
- Table 137: Japan Power Quality Meter Industry Revenue (Million) Forecast, by Application 2020 & 2033
- Table 138: Japan Power Quality Meter Industry Volume (K Unit) Forecast, by Application 2020 & 2033
- Table 139: Australia Power Quality Meter Industry Revenue (Million) Forecast, by Application 2020 & 2033
- Table 140: Australia Power Quality Meter Industry Volume (K Unit) Forecast, by Application 2020 & 2033
- Table 141: Rest of Asia Pacific Power Quality Meter Industry Revenue (Million) Forecast, by Application 2020 & 2033
- Table 142: Rest of Asia Pacific Power Quality Meter Industry Volume (K Unit) Forecast, by Application 2020 & 2033
- Table 143: Global Power Quality Meter Industry Revenue Million Forecast, by Equipment 2020 & 2033
- Table 144: Global Power Quality Meter Industry Volume K Unit Forecast, by Equipment 2020 & 2033
- Table 145: Global Power Quality Meter Industry Revenue Million Forecast, by Phase 2020 & 2033
- Table 146: Global Power Quality Meter Industry Volume K Unit Forecast, by Phase 2020 & 2033
- Table 147: Global Power Quality Meter Industry Revenue Million Forecast, by End-Users 2020 & 2033
- Table 148: Global Power Quality Meter Industry Volume K Unit Forecast, by End-Users 2020 & 2033
- Table 149: Global Power Quality Meter Industry Revenue Million Forecast, by Country 2020 & 2033
- Table 150: Global Power Quality Meter Industry Volume K Unit Forecast, by Country 2020 & 2033
- Table 151: Brazil Power Quality Meter Industry Revenue (Million) Forecast, by Application 2020 & 2033
- Table 152: Brazil Power Quality Meter Industry Volume (K Unit) Forecast, by Application 2020 & 2033
- Table 153: Argentina Power Quality Meter Industry Revenue (Million) Forecast, by Application 2020 & 2033
- Table 154: Argentina Power Quality Meter Industry Volume (K Unit) Forecast, by Application 2020 & 2033
- Table 155: Chile Power Quality Meter Industry Revenue (Million) Forecast, by Application 2020 & 2033
- Table 156: Chile Power Quality Meter Industry Volume (K Unit) Forecast, by Application 2020 & 2033
- Table 157: Rest of South America Power Quality Meter Industry Revenue (Million) Forecast, by Application 2020 & 2033
- Table 158: Rest of South America Power Quality Meter Industry Volume (K Unit) Forecast, by Application 2020 & 2033
- Table 159: Global Power Quality Meter Industry Revenue Million Forecast, by Equipment 2020 & 2033
- Table 160: Global Power Quality Meter Industry Volume K Unit Forecast, by Equipment 2020 & 2033
- Table 161: Global Power Quality Meter Industry Revenue Million Forecast, by Phase 2020 & 2033
- Table 162: Global Power Quality Meter Industry Volume K Unit Forecast, by Phase 2020 & 2033
- Table 163: Global Power Quality Meter Industry Revenue Million Forecast, by End-Users 2020 & 2033
- Table 164: Global Power Quality Meter Industry Volume K Unit Forecast, by End-Users 2020 & 2033
- Table 165: Global Power Quality Meter Industry Revenue Million Forecast, by Country 2020 & 2033
- Table 166: Global Power Quality Meter Industry Volume K Unit Forecast, by Country 2020 & 2033
- Table 167: United Arab Emirates Power Quality Meter Industry Revenue (Million) Forecast, by Application 2020 & 2033
- Table 168: United Arab Emirates Power Quality Meter Industry Volume (K Unit) Forecast, by Application 2020 & 2033
- Table 169: Qatar Power Quality Meter Industry Revenue (Million) Forecast, by Application 2020 & 2033
- Table 170: Qatar Power Quality Meter Industry Volume (K Unit) Forecast, by Application 2020 & 2033
- Table 171: Saudi Arabia Power Quality Meter Industry Revenue (Million) Forecast, by Application 2020 & 2033
- Table 172: Saudi Arabia Power Quality Meter Industry Volume (K Unit) Forecast, by Application 2020 & 2033
- Table 173: South Africa Power Quality Meter Industry Revenue (Million) Forecast, by Application 2020 & 2033
- Table 174: South Africa Power Quality Meter Industry Volume (K Unit) Forecast, by Application 2020 & 2033
- Table 175: Egypt Power Quality Meter Industry Revenue (Million) Forecast, by Application 2020 & 2033
- Table 176: Egypt Power Quality Meter Industry Volume (K Unit) Forecast, by Application 2020 & 2033
- Table 177: Rest of Middle East and Africa Power Quality Meter Industry Revenue (Million) Forecast, by Application 2020 & 2033
- Table 178: Rest of Middle East and Africa Power Quality Meter Industry Volume (K Unit) Forecast, by Application 2020 & 2033
Frequently Asked Questions
1. What is the projected Compound Annual Growth Rate (CAGR) of the Power Quality Meter Industry?
The projected CAGR is approximately 7.40%.
2. Which companies are prominent players in the Power Quality Meter Industry?
Key companies in the market include Active Power Inc, Hitachi Energy Ltd, Toshiba Corporation, Siemens AG, Schneider Electric SE, EATON Corporation Plc, MTE Corporation, General Electric Company, Schaffner, Emerson Electric Company.
3. What are the main segments of the Power Quality Meter Industry?
The market segments include Equipment, Phase, End-Users.
4. Can you provide details about the market size?
The market size is estimated to be USD 16.82 Million as of 2022.
5. What are some drivers contributing to market growth?
4.; Increasing Demand For Power Quality In Industrial And Manufacturing Sectors4.; Increase In Smart Grid Infrastructure.
6. What are the notable trends driving market growth?
Industrial and Manufacturing Segment to Dominate the Market.
7. Are there any restraints impacting market growth?
4.; High Costs Of Power Quality Equipment.
8. Can you provide examples of recent developments in the market?
In June 2023, Germany’s Government announced plans to digitalise its grid, notably at the low-voltage or distribution level, through a new “smart grids” legal framework. The Metering Point Operation Act mandates a 20% roll-out of smart meters by the end of 2025 and 50% by the end of 2028.
9. What pricing options are available for accessing the report?
Pricing options include single-user, multi-user, and enterprise licenses priced at USD 4750, USD 5250, and USD 8750 respectively.
10. Is the market size provided in terms of value or volume?
The market size is provided in terms of value, measured in Million and volume, measured in K Unit.
11. Are there any specific market keywords associated with the report?
Yes, the market keyword associated with the report is "Power Quality Meter Industry," which aids in identifying and referencing the specific market segment covered.
12. How do I determine which pricing option suits my needs best?
The pricing options vary based on user requirements and access needs. Individual users may opt for single-user licenses, while businesses requiring broader access may choose multi-user or enterprise licenses for cost-effective access to the report.
13. Are there any additional resources or data provided in the Power Quality Meter Industry report?
While the report offers comprehensive insights, it's advisable to review the specific contents or supplementary materials provided to ascertain if additional resources or data are available.
14. How can I stay updated on further developments or reports in the Power Quality Meter Industry?
To stay informed about further developments, trends, and reports in the Power Quality Meter Industry, consider subscribing to industry newsletters, following relevant companies and organizations, or regularly checking reputable industry news sources and publications.
Methodology
Step 1 - Identification of Relevant Samples Size from Population Database


Step 2 - Approaches for Defining Global Market Size (Value, Volume* & Price*)

Note*: In applicable scenarios
Step 3 - Data Sources
Primary Research
- Web Analytics
- Survey Reports
- Research Institute
- Latest Research Reports
- Opinion Leaders
Secondary Research
- Annual Reports
- White Paper
- Latest Press Release
- Industry Association
- Paid Database
- Investor Presentations

Step 4 - Data Triangulation
Involves using different sources of information in order to increase the validity of a study
These sources are likely to be stakeholders in a program - participants, other researchers, program staff, other community members, and so on.
Then we put all data in single framework & apply various statistical tools to find out the dynamic on the market.
During the analysis stage, feedback from the stakeholder groups would be compared to determine areas of agreement as well as areas of divergence
