
Key Insights
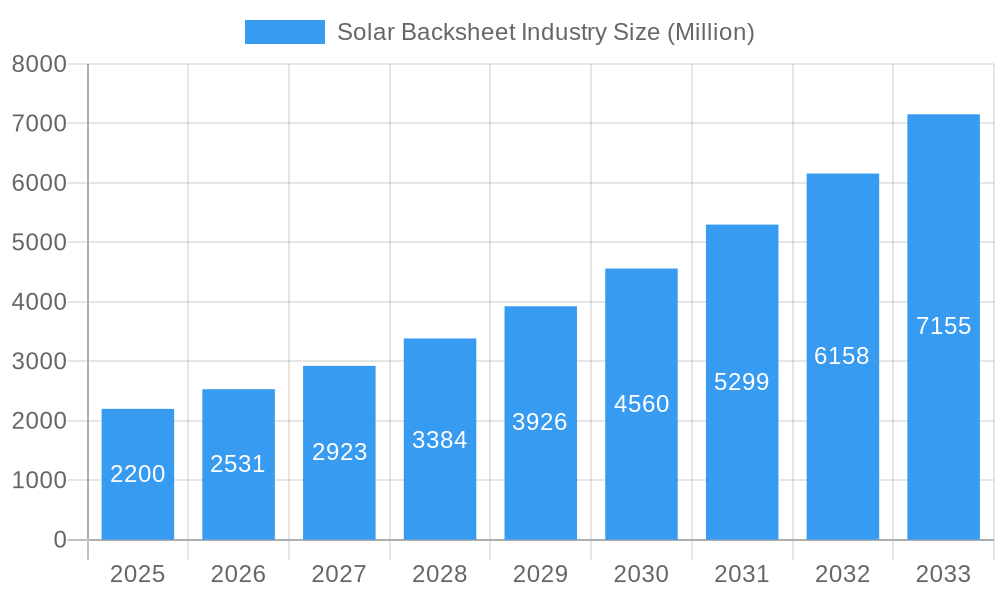
The solar backsheet market, valued at $2.2 billion in 2025, is experiencing robust growth, projected to expand at a Compound Annual Growth Rate (CAGR) exceeding 15.5% from 2025 to 2033. This rapid expansion is driven by the surging demand for solar energy globally, fueled by increasing concerns about climate change and government incentives promoting renewable energy adoption. Technological advancements leading to more durable and efficient backsheets, capable of withstanding harsh weather conditions and improving panel lifespan, are further bolstering market growth. The market is segmented by material type, with fluoropolymer backsheets commanding a significant share due to their superior performance characteristics, although non-fluoropolymer alternatives are gaining traction due to their cost-effectiveness. Key players like DuPont, 3M, and Arkema are actively investing in research and development, driving innovation and competition within the sector. Geographic expansion is also a significant factor, with Asia Pacific, particularly China and India, exhibiting substantial growth potential due to the rapid deployment of solar power projects in these regions. However, fluctuating raw material prices and potential supply chain disruptions pose challenges to consistent market expansion.
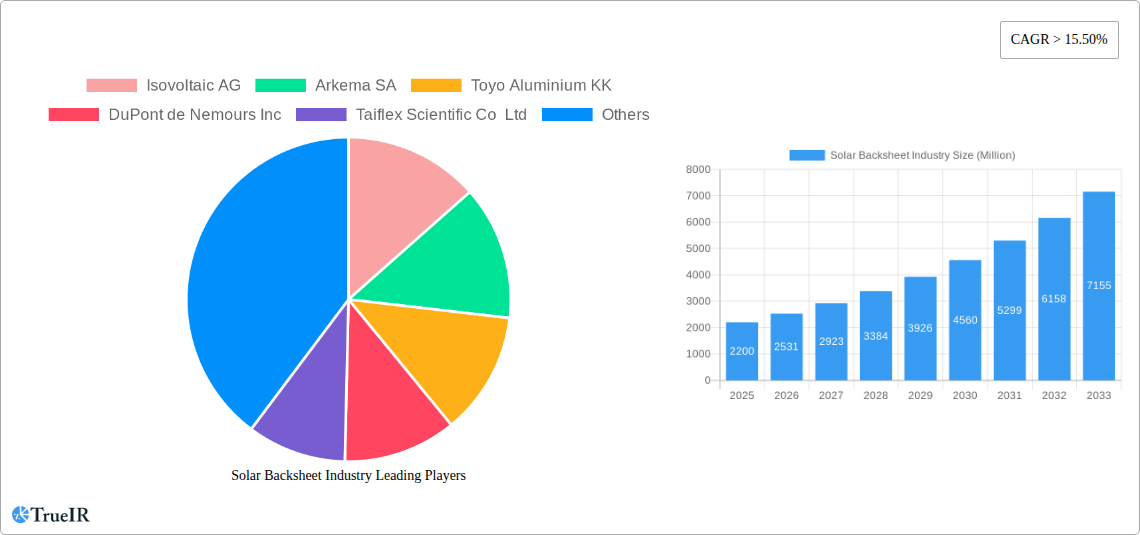
Solar Backsheet Industry Market Size (In Billion)
Despite the challenges, the long-term outlook for the solar backsheet market remains positive. The increasing adoption of large-scale solar power plants and the growing residential solar market are expected to create significant demand for backsheets in the coming years. Furthermore, the ongoing development of next-generation solar technologies, such as perovskite solar cells, could further stimulate market growth by creating new applications for advanced backsheet materials. Competition among manufacturers is likely to intensify, pushing innovation and potentially leading to price reductions, making solar energy more accessible and affordable globally. This competitive landscape, coupled with consistent technological advancements and robust government support, suggests a bright future for the solar backsheet industry.
Solar Backsheet Industry Company Market Share
Solar Backsheet Industry Market Report: 2019-2033
This comprehensive report provides an in-depth analysis of the global solar backsheet industry, offering invaluable insights for stakeholders across the value chain. Covering the period from 2019 to 2033, with a focus on 2025, this study meticulously examines market dynamics, competitive landscapes, and future growth trajectories. The report leverages extensive data analysis and expert insights to provide a clear understanding of the industry's current state and its future prospects. Key players such as Isovoltaic AG, Arkema SA, Toyo Aluminium KK, DuPont de Nemours Inc, Taiflex Scientific Co Ltd, Targray Technology International Inc, Coveme SpA, 3M Co, Krempel GmbH, and Madico Inc are profiled, among others. The report also forecasts a significant market expansion, driven by increasing solar energy adoption globally.
Solar Backsheet Industry Market Structure & Competitive Landscape
The solar backsheet market exhibits a moderately concentrated structure, with a few major players holding significant market share. The Herfindahl-Hirschman Index (HHI) for 2024 is estimated at xx, indicating a moderately consolidated landscape. However, the market is characterized by intense competition, driven by technological innovation and ongoing M&A activity. The volume of M&A transactions in the sector reached approximately xx Million USD in 2024.
- Innovation Drivers: Continuous advancements in material science, focusing on enhancing durability, efficiency, and cost-effectiveness, are key drivers of competition.
- Regulatory Impacts: Government policies supporting renewable energy, including subsidies and tax incentives, significantly influence market growth and shape competitive dynamics. Stringent environmental regulations also impact material selection and manufacturing processes.
- Product Substitutes: While few direct substitutes exist, the market faces indirect competition from alternative encapsulant materials and technologies.
- End-User Segmentation: The market is primarily segmented based on end-users, including residential, commercial, and utility-scale solar projects. The utility-scale segment dominates, contributing to xx% of the total market value in 2024.
- M&A Trends: Consolidation through mergers and acquisitions is a prominent trend, allowing larger players to expand their market share and technological capabilities. The xx Million USD in M&A activity in 2024 is anticipated to continue.
Solar Backsheet Industry Market Trends & Opportunities
The global solar backsheet market is projected to experience robust growth, with a CAGR of xx% during the forecast period (2025-2033). This growth is fueled by the increasing demand for solar energy globally, driven by factors such as rising energy prices, environmental concerns, and government initiatives promoting renewable energy adoption. The market size is estimated at xx Million USD in 2025 and is projected to reach xx Million USD by 2033. Technological advancements, such as the development of more durable and efficient backsheet materials, are further driving market expansion. Consumer preferences are shifting towards high-performance, long-lasting backsheets that ensure optimal solar panel efficiency and longevity. Competitive dynamics are intensifying, with companies focusing on product differentiation, cost reduction, and strategic partnerships to gain a competitive edge. Market penetration rates are expected to increase significantly, particularly in emerging markets with high solar irradiation and supportive government policies. The shift towards higher efficiency solar panels will further drive demand for advanced backsheet materials.
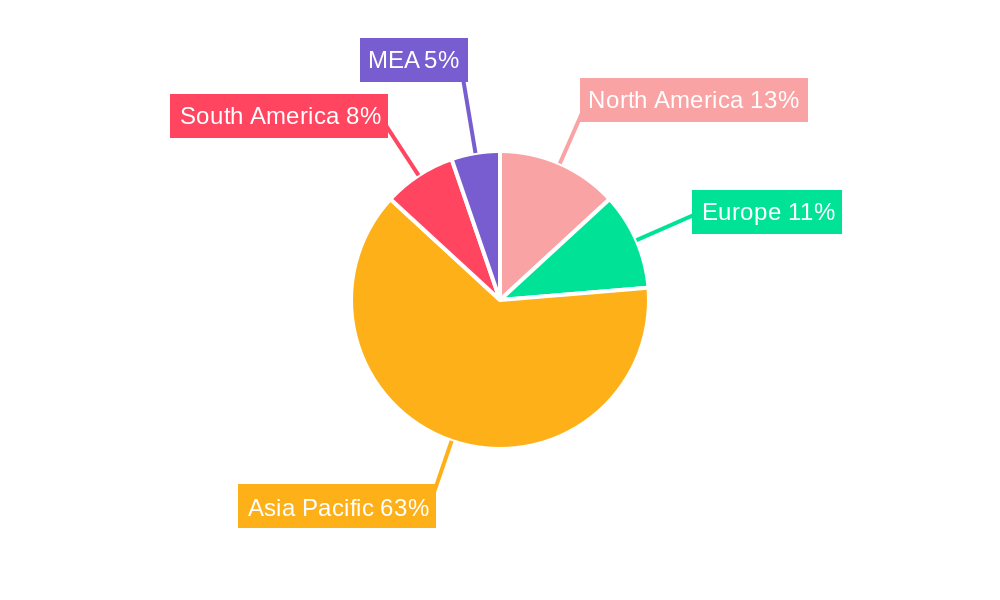
Dominant Markets & Segments in Solar Backsheet Industry
The Asia-Pacific region is currently the dominant market for solar backsheets, accounting for xx% of the global market share in 2024. China, in particular, plays a crucial role, driven by its massive solar energy deployment. However, other regions, such as North America and Europe, are experiencing significant growth, fueled by increasing renewable energy targets and supportive government policies. Within the product segments, the fluoropolymer backsheet segment holds a larger market share due to its superior performance characteristics, such as high durability and UV resistance. However, the non-fluoropolymer segment is gaining traction due to its relatively lower cost and growing environmental concerns regarding the use of fluoropolymers.
Key Growth Drivers in Asia-Pacific:
- Massive solar energy installations fueled by government initiatives.
- Increasing manufacturing capacity and cost competitiveness.
- Strong demand from residential and commercial sectors.
Key Growth Drivers in North America:
- Increasing adoption of solar energy driven by environmental concerns.
- Government incentives and tax benefits for renewable energy projects.
- Growing demand from utility-scale solar power plants.
Key Growth Drivers in Europe:
- Stringent environmental regulations promoting renewable energy adoption.
- Investments in renewable energy infrastructure and projects.
- Growing awareness of the benefits of solar energy.
Solar Backsheet Industry Product Analysis
Technological advancements are driving the development of innovative backsheet products with enhanced performance characteristics. These include improved UV resistance, higher durability, and better water resistance. Companies are focusing on developing lighter and more flexible backsheets to facilitate easier installation and reduce transportation costs. The market is witnessing increased demand for backsheets with enhanced fire safety features, especially for large-scale solar installations. The competitive advantage lies in offering superior performance, cost-effectiveness, and reliability, while adhering to stringent quality standards.
Key Drivers, Barriers & Challenges in Solar Backsheet Industry
Key Drivers:
- Growing demand for renewable energy globally.
- Increasing government support for solar energy projects through subsidies and incentives.
- Technological advancements leading to higher efficiency and cost-effective backsheet materials.
Challenges and Restraints:
- Fluctuations in raw material prices, impacting production costs.
- Stringent environmental regulations regarding the use of certain materials.
- Intense competition among established and emerging players in the market.
- Supply chain disruptions impacting timely production and delivery.
Growth Drivers in the Solar Backsheet Industry Market
The solar backsheet industry is experiencing significant growth propelled by the global push towards renewable energy, government policies promoting solar energy adoption, and continuous technological advancements improving the efficiency and cost-effectiveness of backsheet materials. This includes the development of more durable, weather-resistant, and lighter-weight backsheets improving solar panel lifespan and overall energy output.
Challenges Impacting Solar Backsheet Industry Growth
Despite the strong growth drivers, challenges remain. These include the volatility in raw material prices, specifically for fluoropolymers, affecting production costs and profitability. Supply chain disruptions can also hamper timely delivery and production, while stringent regulations related to material composition and environmental impact add complexity to the manufacturing process.
Key Players Shaping the Solar Backsheet Industry Market
- Isovoltaic AG
- Arkema SA
- Toyo Aluminium KK
- DuPont de Nemours Inc
- Taiflex Scientific Co Ltd
- Targray Technology International Inc
- Coveme SpA
- 3M Co
- Krempel GmbH
- Madico Inc
Significant Solar Backsheet Industry Industry Milestones
- March 2021: Royal DSM sold its Advanced Solar business (backsheet products) to Worthen Industries Inc., signifying industry consolidation.
- October 2021: The 390-MW Likana Concentrated Solar Power project auction in Chile highlighted the expanding market for large-scale PV installations, boosting demand for backsheets.
Future Outlook for Solar Backsheet Industry Market
The future outlook for the solar backsheet industry is positive, driven by the continued expansion of the global solar energy market. Strategic opportunities exist for companies focusing on innovation, cost optimization, and sustainable manufacturing practices. The market will likely witness further consolidation and increased competition, with a focus on developing high-performance, cost-effective, and environmentally friendly backsheet materials. The market is poised for significant growth, driven by technological advancements and supportive government policies.
Solar Backsheet Industry Segmentation
-
1. Types
- 1.1. Fluoropolymer
- 1.2. Non-fluoropolymer
Solar Backsheet Industry Segmentation By Geography
- 1. North America
- 2. Europe
- 3. Asia Pacific
- 4. South America
- 5. Middle East and Africa
Solar Backsheet Industry Regional Market Share
Geographic Coverage of Solar Backsheet Industry
Solar Backsheet Industry REPORT HIGHLIGHTS
| Aspects | Details |
|---|---|
| Study Period | 2020-2034 |
| Base Year | 2025 |
| Estimated Year | 2026 |
| Forecast Period | 2026-2034 |
| Historical Period | 2020-2025 |
| Growth Rate | CAGR of > 15.50% from 2020-2034 |
| Segmentation |
|
Table of Contents
- 1. Introduction
- 1.1. Research Scope
- 1.2. Market Segmentation
- 1.3. Research Methodology
- 1.4. Definitions and Assumptions
- 2. Executive Summary
- 2.1. Introduction
- 3. Market Dynamics
- 3.1. Introduction
- 3.2. Market Drivers
- 3.2.1. 4.; Increasing Investments in Water Treatment by Developing Countries4.; Growing Demand for the Various End-Use Sectors
- 3.3. Market Restrains
- 3.3.1. 4.; Availability of Cheap and Alternative Pumps
- 3.4. Market Trends
- 3.4.1. Fluoropolymer is Expected to Become a Significant Segment
- 4. Market Factor Analysis
- 4.1. Porters Five Forces
- 4.2. Supply/Value Chain
- 4.3. PESTEL analysis
- 4.4. Market Entropy
- 4.5. Patent/Trademark Analysis
- 5. Global Solar Backsheet Industry Analysis, Insights and Forecast, 2020-2032
- 5.1. Market Analysis, Insights and Forecast - by Types
- 5.1.1. Fluoropolymer
- 5.1.2. Non-fluoropolymer
- 5.2. Market Analysis, Insights and Forecast - by Region
- 5.2.1. North America
- 5.2.2. Europe
- 5.2.3. Asia Pacific
- 5.2.4. South America
- 5.2.5. Middle East and Africa
- 5.1. Market Analysis, Insights and Forecast - by Types
- 6. North America Solar Backsheet Industry Analysis, Insights and Forecast, 2020-2032
- 6.1. Market Analysis, Insights and Forecast - by Types
- 6.1.1. Fluoropolymer
- 6.1.2. Non-fluoropolymer
- 6.1. Market Analysis, Insights and Forecast - by Types
- 7. Europe Solar Backsheet Industry Analysis, Insights and Forecast, 2020-2032
- 7.1. Market Analysis, Insights and Forecast - by Types
- 7.1.1. Fluoropolymer
- 7.1.2. Non-fluoropolymer
- 7.1. Market Analysis, Insights and Forecast - by Types
- 8. Asia Pacific Solar Backsheet Industry Analysis, Insights and Forecast, 2020-2032
- 8.1. Market Analysis, Insights and Forecast - by Types
- 8.1.1. Fluoropolymer
- 8.1.2. Non-fluoropolymer
- 8.1. Market Analysis, Insights and Forecast - by Types
- 9. South America Solar Backsheet Industry Analysis, Insights and Forecast, 2020-2032
- 9.1. Market Analysis, Insights and Forecast - by Types
- 9.1.1. Fluoropolymer
- 9.1.2. Non-fluoropolymer
- 9.1. Market Analysis, Insights and Forecast - by Types
- 10. Middle East and Africa Solar Backsheet Industry Analysis, Insights and Forecast, 2020-2032
- 10.1. Market Analysis, Insights and Forecast - by Types
- 10.1.1. Fluoropolymer
- 10.1.2. Non-fluoropolymer
- 10.1. Market Analysis, Insights and Forecast - by Types
- 11. North America Solar Backsheet Industry Analysis, Insights and Forecast, 2020-2032
- 11.1. Market Analysis, Insights and Forecast - By Country/Sub-region
- 11.1.1 United States
- 11.1.2 Canada
- 11.1.3 Mexico
- 12. Europe Solar Backsheet Industry Analysis, Insights and Forecast, 2020-2032
- 12.1. Market Analysis, Insights and Forecast - By Country/Sub-region
- 12.1.1 Germany
- 12.1.2 United Kingdom
- 12.1.3 France
- 12.1.4 Spain
- 12.1.5 Italy
- 12.1.6 Spain
- 12.1.7 Belgium
- 12.1.8 Netherland
- 12.1.9 Nordics
- 12.1.10 Rest of Europe
- 13. Asia Pacific Solar Backsheet Industry Analysis, Insights and Forecast, 2020-2032
- 13.1. Market Analysis, Insights and Forecast - By Country/Sub-region
- 13.1.1 China
- 13.1.2 Japan
- 13.1.3 India
- 13.1.4 South Korea
- 13.1.5 Southeast Asia
- 13.1.6 Australia
- 13.1.7 Indonesia
- 13.1.8 Phillipes
- 13.1.9 Singapore
- 13.1.10 Thailandc
- 13.1.11 Rest of Asia Pacific
- 14. South America Solar Backsheet Industry Analysis, Insights and Forecast, 2020-2032
- 14.1. Market Analysis, Insights and Forecast - By Country/Sub-region
- 14.1.1 Brazil
- 14.1.2 Argentina
- 14.1.3 Peru
- 14.1.4 Chile
- 14.1.5 Colombia
- 14.1.6 Ecuador
- 14.1.7 Venezuela
- 14.1.8 Rest of South America
- 15. North America Solar Backsheet Industry Analysis, Insights and Forecast, 2020-2032
- 15.1. Market Analysis, Insights and Forecast - By Country/Sub-region
- 15.1.1 United States
- 15.1.2 Canada
- 15.1.3 Mexico
- 16. MEA Solar Backsheet Industry Analysis, Insights and Forecast, 2020-2032
- 16.1. Market Analysis, Insights and Forecast - By Country/Sub-region
- 16.1.1 United Arab Emirates
- 16.1.2 Saudi Arabia
- 16.1.3 South Africa
- 16.1.4 Rest of Middle East and Africa
- 17. Competitive Analysis
- 17.1. Global Market Share Analysis 2025
- 17.2. Company Profiles
- 17.2.1 Isovoltaic AG
- 17.2.1.1. Overview
- 17.2.1.2. Products
- 17.2.1.3. SWOT Analysis
- 17.2.1.4. Recent Developments
- 17.2.1.5. Financials (Based on Availability)
- 17.2.2 Arkema SA
- 17.2.2.1. Overview
- 17.2.2.2. Products
- 17.2.2.3. SWOT Analysis
- 17.2.2.4. Recent Developments
- 17.2.2.5. Financials (Based on Availability)
- 17.2.3 Toyo Aluminium KK
- 17.2.3.1. Overview
- 17.2.3.2. Products
- 17.2.3.3. SWOT Analysis
- 17.2.3.4. Recent Developments
- 17.2.3.5. Financials (Based on Availability)
- 17.2.4 DuPont de Nemours Inc
- 17.2.4.1. Overview
- 17.2.4.2. Products
- 17.2.4.3. SWOT Analysis
- 17.2.4.4. Recent Developments
- 17.2.4.5. Financials (Based on Availability)
- 17.2.5 Taiflex Scientific Co Ltd
- 17.2.5.1. Overview
- 17.2.5.2. Products
- 17.2.5.3. SWOT Analysis
- 17.2.5.4. Recent Developments
- 17.2.5.5. Financials (Based on Availability)
- 17.2.6 Targray Technology International Inc *List Not Exhaustive
- 17.2.6.1. Overview
- 17.2.6.2. Products
- 17.2.6.3. SWOT Analysis
- 17.2.6.4. Recent Developments
- 17.2.6.5. Financials (Based on Availability)
- 17.2.7 Coveme SpA
- 17.2.7.1. Overview
- 17.2.7.2. Products
- 17.2.7.3. SWOT Analysis
- 17.2.7.4. Recent Developments
- 17.2.7.5. Financials (Based on Availability)
- 17.2.8 3M Co
- 17.2.8.1. Overview
- 17.2.8.2. Products
- 17.2.8.3. SWOT Analysis
- 17.2.8.4. Recent Developments
- 17.2.8.5. Financials (Based on Availability)
- 17.2.9 Krempel GmbH
- 17.2.9.1. Overview
- 17.2.9.2. Products
- 17.2.9.3. SWOT Analysis
- 17.2.9.4. Recent Developments
- 17.2.9.5. Financials (Based on Availability)
- 17.2.10 Madico Inc
- 17.2.10.1. Overview
- 17.2.10.2. Products
- 17.2.10.3. SWOT Analysis
- 17.2.10.4. Recent Developments
- 17.2.10.5. Financials (Based on Availability)
- 17.2.1 Isovoltaic AG
List of Figures
- Figure 1: Global Solar Backsheet Industry Revenue Breakdown (Million, %) by Region 2025 & 2033
- Figure 2: Global Solar Backsheet Industry Volume Breakdown (Gigawatt, %) by Region 2025 & 2033
- Figure 3: North America Solar Backsheet Industry Revenue (Million), by Country 2025 & 2033
- Figure 4: North America Solar Backsheet Industry Volume (Gigawatt), by Country 2025 & 2033
- Figure 5: North America Solar Backsheet Industry Revenue Share (%), by Country 2025 & 2033
- Figure 6: North America Solar Backsheet Industry Volume Share (%), by Country 2025 & 2033
- Figure 7: Europe Solar Backsheet Industry Revenue (Million), by Country 2025 & 2033
- Figure 8: Europe Solar Backsheet Industry Volume (Gigawatt), by Country 2025 & 2033
- Figure 9: Europe Solar Backsheet Industry Revenue Share (%), by Country 2025 & 2033
- Figure 10: Europe Solar Backsheet Industry Volume Share (%), by Country 2025 & 2033
- Figure 11: Asia Pacific Solar Backsheet Industry Revenue (Million), by Country 2025 & 2033
- Figure 12: Asia Pacific Solar Backsheet Industry Volume (Gigawatt), by Country 2025 & 2033
- Figure 13: Asia Pacific Solar Backsheet Industry Revenue Share (%), by Country 2025 & 2033
- Figure 14: Asia Pacific Solar Backsheet Industry Volume Share (%), by Country 2025 & 2033
- Figure 15: South America Solar Backsheet Industry Revenue (Million), by Country 2025 & 2033
- Figure 16: South America Solar Backsheet Industry Volume (Gigawatt), by Country 2025 & 2033
- Figure 17: South America Solar Backsheet Industry Revenue Share (%), by Country 2025 & 2033
- Figure 18: South America Solar Backsheet Industry Volume Share (%), by Country 2025 & 2033
- Figure 19: North America Solar Backsheet Industry Revenue (Million), by Country 2025 & 2033
- Figure 20: North America Solar Backsheet Industry Volume (Gigawatt), by Country 2025 & 2033
- Figure 21: North America Solar Backsheet Industry Revenue Share (%), by Country 2025 & 2033
- Figure 22: North America Solar Backsheet Industry Volume Share (%), by Country 2025 & 2033
- Figure 23: MEA Solar Backsheet Industry Revenue (Million), by Country 2025 & 2033
- Figure 24: MEA Solar Backsheet Industry Volume (Gigawatt), by Country 2025 & 2033
- Figure 25: MEA Solar Backsheet Industry Revenue Share (%), by Country 2025 & 2033
- Figure 26: MEA Solar Backsheet Industry Volume Share (%), by Country 2025 & 2033
- Figure 27: North America Solar Backsheet Industry Revenue (Million), by Types 2025 & 2033
- Figure 28: North America Solar Backsheet Industry Volume (Gigawatt), by Types 2025 & 2033
- Figure 29: North America Solar Backsheet Industry Revenue Share (%), by Types 2025 & 2033
- Figure 30: North America Solar Backsheet Industry Volume Share (%), by Types 2025 & 2033
- Figure 31: North America Solar Backsheet Industry Revenue (Million), by Country 2025 & 2033
- Figure 32: North America Solar Backsheet Industry Volume (Gigawatt), by Country 2025 & 2033
- Figure 33: North America Solar Backsheet Industry Revenue Share (%), by Country 2025 & 2033
- Figure 34: North America Solar Backsheet Industry Volume Share (%), by Country 2025 & 2033
- Figure 35: Europe Solar Backsheet Industry Revenue (Million), by Types 2025 & 2033
- Figure 36: Europe Solar Backsheet Industry Volume (Gigawatt), by Types 2025 & 2033
- Figure 37: Europe Solar Backsheet Industry Revenue Share (%), by Types 2025 & 2033
- Figure 38: Europe Solar Backsheet Industry Volume Share (%), by Types 2025 & 2033
- Figure 39: Europe Solar Backsheet Industry Revenue (Million), by Country 2025 & 2033
- Figure 40: Europe Solar Backsheet Industry Volume (Gigawatt), by Country 2025 & 2033
- Figure 41: Europe Solar Backsheet Industry Revenue Share (%), by Country 2025 & 2033
- Figure 42: Europe Solar Backsheet Industry Volume Share (%), by Country 2025 & 2033
- Figure 43: Asia Pacific Solar Backsheet Industry Revenue (Million), by Types 2025 & 2033
- Figure 44: Asia Pacific Solar Backsheet Industry Volume (Gigawatt), by Types 2025 & 2033
- Figure 45: Asia Pacific Solar Backsheet Industry Revenue Share (%), by Types 2025 & 2033
- Figure 46: Asia Pacific Solar Backsheet Industry Volume Share (%), by Types 2025 & 2033
- Figure 47: Asia Pacific Solar Backsheet Industry Revenue (Million), by Country 2025 & 2033
- Figure 48: Asia Pacific Solar Backsheet Industry Volume (Gigawatt), by Country 2025 & 2033
- Figure 49: Asia Pacific Solar Backsheet Industry Revenue Share (%), by Country 2025 & 2033
- Figure 50: Asia Pacific Solar Backsheet Industry Volume Share (%), by Country 2025 & 2033
- Figure 51: South America Solar Backsheet Industry Revenue (Million), by Types 2025 & 2033
- Figure 52: South America Solar Backsheet Industry Volume (Gigawatt), by Types 2025 & 2033
- Figure 53: South America Solar Backsheet Industry Revenue Share (%), by Types 2025 & 2033
- Figure 54: South America Solar Backsheet Industry Volume Share (%), by Types 2025 & 2033
- Figure 55: South America Solar Backsheet Industry Revenue (Million), by Country 2025 & 2033
- Figure 56: South America Solar Backsheet Industry Volume (Gigawatt), by Country 2025 & 2033
- Figure 57: South America Solar Backsheet Industry Revenue Share (%), by Country 2025 & 2033
- Figure 58: South America Solar Backsheet Industry Volume Share (%), by Country 2025 & 2033
- Figure 59: Middle East and Africa Solar Backsheet Industry Revenue (Million), by Types 2025 & 2033
- Figure 60: Middle East and Africa Solar Backsheet Industry Volume (Gigawatt), by Types 2025 & 2033
- Figure 61: Middle East and Africa Solar Backsheet Industry Revenue Share (%), by Types 2025 & 2033
- Figure 62: Middle East and Africa Solar Backsheet Industry Volume Share (%), by Types 2025 & 2033
- Figure 63: Middle East and Africa Solar Backsheet Industry Revenue (Million), by Country 2025 & 2033
- Figure 64: Middle East and Africa Solar Backsheet Industry Volume (Gigawatt), by Country 2025 & 2033
- Figure 65: Middle East and Africa Solar Backsheet Industry Revenue Share (%), by Country 2025 & 2033
- Figure 66: Middle East and Africa Solar Backsheet Industry Volume Share (%), by Country 2025 & 2033
List of Tables
- Table 1: Global Solar Backsheet Industry Revenue Million Forecast, by Region 2020 & 2033
- Table 2: Global Solar Backsheet Industry Volume Gigawatt Forecast, by Region 2020 & 2033
- Table 3: Global Solar Backsheet Industry Revenue Million Forecast, by Types 2020 & 2033
- Table 4: Global Solar Backsheet Industry Volume Gigawatt Forecast, by Types 2020 & 2033
- Table 5: Global Solar Backsheet Industry Revenue Million Forecast, by Region 2020 & 2033
- Table 6: Global Solar Backsheet Industry Volume Gigawatt Forecast, by Region 2020 & 2033
- Table 7: Global Solar Backsheet Industry Revenue Million Forecast, by Country 2020 & 2033
- Table 8: Global Solar Backsheet Industry Volume Gigawatt Forecast, by Country 2020 & 2033
- Table 9: United States Solar Backsheet Industry Revenue (Million) Forecast, by Application 2020 & 2033
- Table 10: United States Solar Backsheet Industry Volume (Gigawatt) Forecast, by Application 2020 & 2033
- Table 11: Canada Solar Backsheet Industry Revenue (Million) Forecast, by Application 2020 & 2033
- Table 12: Canada Solar Backsheet Industry Volume (Gigawatt) Forecast, by Application 2020 & 2033
- Table 13: Mexico Solar Backsheet Industry Revenue (Million) Forecast, by Application 2020 & 2033
- Table 14: Mexico Solar Backsheet Industry Volume (Gigawatt) Forecast, by Application 2020 & 2033
- Table 15: Global Solar Backsheet Industry Revenue Million Forecast, by Country 2020 & 2033
- Table 16: Global Solar Backsheet Industry Volume Gigawatt Forecast, by Country 2020 & 2033
- Table 17: Germany Solar Backsheet Industry Revenue (Million) Forecast, by Application 2020 & 2033
- Table 18: Germany Solar Backsheet Industry Volume (Gigawatt) Forecast, by Application 2020 & 2033
- Table 19: United Kingdom Solar Backsheet Industry Revenue (Million) Forecast, by Application 2020 & 2033
- Table 20: United Kingdom Solar Backsheet Industry Volume (Gigawatt) Forecast, by Application 2020 & 2033
- Table 21: France Solar Backsheet Industry Revenue (Million) Forecast, by Application 2020 & 2033
- Table 22: France Solar Backsheet Industry Volume (Gigawatt) Forecast, by Application 2020 & 2033
- Table 23: Spain Solar Backsheet Industry Revenue (Million) Forecast, by Application 2020 & 2033
- Table 24: Spain Solar Backsheet Industry Volume (Gigawatt) Forecast, by Application 2020 & 2033
- Table 25: Italy Solar Backsheet Industry Revenue (Million) Forecast, by Application 2020 & 2033
- Table 26: Italy Solar Backsheet Industry Volume (Gigawatt) Forecast, by Application 2020 & 2033
- Table 27: Spain Solar Backsheet Industry Revenue (Million) Forecast, by Application 2020 & 2033
- Table 28: Spain Solar Backsheet Industry Volume (Gigawatt) Forecast, by Application 2020 & 2033
- Table 29: Belgium Solar Backsheet Industry Revenue (Million) Forecast, by Application 2020 & 2033
- Table 30: Belgium Solar Backsheet Industry Volume (Gigawatt) Forecast, by Application 2020 & 2033
- Table 31: Netherland Solar Backsheet Industry Revenue (Million) Forecast, by Application 2020 & 2033
- Table 32: Netherland Solar Backsheet Industry Volume (Gigawatt) Forecast, by Application 2020 & 2033
- Table 33: Nordics Solar Backsheet Industry Revenue (Million) Forecast, by Application 2020 & 2033
- Table 34: Nordics Solar Backsheet Industry Volume (Gigawatt) Forecast, by Application 2020 & 2033
- Table 35: Rest of Europe Solar Backsheet Industry Revenue (Million) Forecast, by Application 2020 & 2033
- Table 36: Rest of Europe Solar Backsheet Industry Volume (Gigawatt) Forecast, by Application 2020 & 2033
- Table 37: Global Solar Backsheet Industry Revenue Million Forecast, by Country 2020 & 2033
- Table 38: Global Solar Backsheet Industry Volume Gigawatt Forecast, by Country 2020 & 2033
- Table 39: China Solar Backsheet Industry Revenue (Million) Forecast, by Application 2020 & 2033
- Table 40: China Solar Backsheet Industry Volume (Gigawatt) Forecast, by Application 2020 & 2033
- Table 41: Japan Solar Backsheet Industry Revenue (Million) Forecast, by Application 2020 & 2033
- Table 42: Japan Solar Backsheet Industry Volume (Gigawatt) Forecast, by Application 2020 & 2033
- Table 43: India Solar Backsheet Industry Revenue (Million) Forecast, by Application 2020 & 2033
- Table 44: India Solar Backsheet Industry Volume (Gigawatt) Forecast, by Application 2020 & 2033
- Table 45: South Korea Solar Backsheet Industry Revenue (Million) Forecast, by Application 2020 & 2033
- Table 46: South Korea Solar Backsheet Industry Volume (Gigawatt) Forecast, by Application 2020 & 2033
- Table 47: Southeast Asia Solar Backsheet Industry Revenue (Million) Forecast, by Application 2020 & 2033
- Table 48: Southeast Asia Solar Backsheet Industry Volume (Gigawatt) Forecast, by Application 2020 & 2033
- Table 49: Australia Solar Backsheet Industry Revenue (Million) Forecast, by Application 2020 & 2033
- Table 50: Australia Solar Backsheet Industry Volume (Gigawatt) Forecast, by Application 2020 & 2033
- Table 51: Indonesia Solar Backsheet Industry Revenue (Million) Forecast, by Application 2020 & 2033
- Table 52: Indonesia Solar Backsheet Industry Volume (Gigawatt) Forecast, by Application 2020 & 2033
- Table 53: Phillipes Solar Backsheet Industry Revenue (Million) Forecast, by Application 2020 & 2033
- Table 54: Phillipes Solar Backsheet Industry Volume (Gigawatt) Forecast, by Application 2020 & 2033
- Table 55: Singapore Solar Backsheet Industry Revenue (Million) Forecast, by Application 2020 & 2033
- Table 56: Singapore Solar Backsheet Industry Volume (Gigawatt) Forecast, by Application 2020 & 2033
- Table 57: Thailandc Solar Backsheet Industry Revenue (Million) Forecast, by Application 2020 & 2033
- Table 58: Thailandc Solar Backsheet Industry Volume (Gigawatt) Forecast, by Application 2020 & 2033
- Table 59: Rest of Asia Pacific Solar Backsheet Industry Revenue (Million) Forecast, by Application 2020 & 2033
- Table 60: Rest of Asia Pacific Solar Backsheet Industry Volume (Gigawatt) Forecast, by Application 2020 & 2033
- Table 61: Global Solar Backsheet Industry Revenue Million Forecast, by Country 2020 & 2033
- Table 62: Global Solar Backsheet Industry Volume Gigawatt Forecast, by Country 2020 & 2033
- Table 63: Brazil Solar Backsheet Industry Revenue (Million) Forecast, by Application 2020 & 2033
- Table 64: Brazil Solar Backsheet Industry Volume (Gigawatt) Forecast, by Application 2020 & 2033
- Table 65: Argentina Solar Backsheet Industry Revenue (Million) Forecast, by Application 2020 & 2033
- Table 66: Argentina Solar Backsheet Industry Volume (Gigawatt) Forecast, by Application 2020 & 2033
- Table 67: Peru Solar Backsheet Industry Revenue (Million) Forecast, by Application 2020 & 2033
- Table 68: Peru Solar Backsheet Industry Volume (Gigawatt) Forecast, by Application 2020 & 2033
- Table 69: Chile Solar Backsheet Industry Revenue (Million) Forecast, by Application 2020 & 2033
- Table 70: Chile Solar Backsheet Industry Volume (Gigawatt) Forecast, by Application 2020 & 2033
- Table 71: Colombia Solar Backsheet Industry Revenue (Million) Forecast, by Application 2020 & 2033
- Table 72: Colombia Solar Backsheet Industry Volume (Gigawatt) Forecast, by Application 2020 & 2033
- Table 73: Ecuador Solar Backsheet Industry Revenue (Million) Forecast, by Application 2020 & 2033
- Table 74: Ecuador Solar Backsheet Industry Volume (Gigawatt) Forecast, by Application 2020 & 2033
- Table 75: Venezuela Solar Backsheet Industry Revenue (Million) Forecast, by Application 2020 & 2033
- Table 76: Venezuela Solar Backsheet Industry Volume (Gigawatt) Forecast, by Application 2020 & 2033
- Table 77: Rest of South America Solar Backsheet Industry Revenue (Million) Forecast, by Application 2020 & 2033
- Table 78: Rest of South America Solar Backsheet Industry Volume (Gigawatt) Forecast, by Application 2020 & 2033
- Table 79: Global Solar Backsheet Industry Revenue Million Forecast, by Country 2020 & 2033
- Table 80: Global Solar Backsheet Industry Volume Gigawatt Forecast, by Country 2020 & 2033
- Table 81: United States Solar Backsheet Industry Revenue (Million) Forecast, by Application 2020 & 2033
- Table 82: United States Solar Backsheet Industry Volume (Gigawatt) Forecast, by Application 2020 & 2033
- Table 83: Canada Solar Backsheet Industry Revenue (Million) Forecast, by Application 2020 & 2033
- Table 84: Canada Solar Backsheet Industry Volume (Gigawatt) Forecast, by Application 2020 & 2033
- Table 85: Mexico Solar Backsheet Industry Revenue (Million) Forecast, by Application 2020 & 2033
- Table 86: Mexico Solar Backsheet Industry Volume (Gigawatt) Forecast, by Application 2020 & 2033
- Table 87: Global Solar Backsheet Industry Revenue Million Forecast, by Country 2020 & 2033
- Table 88: Global Solar Backsheet Industry Volume Gigawatt Forecast, by Country 2020 & 2033
- Table 89: United Arab Emirates Solar Backsheet Industry Revenue (Million) Forecast, by Application 2020 & 2033
- Table 90: United Arab Emirates Solar Backsheet Industry Volume (Gigawatt) Forecast, by Application 2020 & 2033
- Table 91: Saudi Arabia Solar Backsheet Industry Revenue (Million) Forecast, by Application 2020 & 2033
- Table 92: Saudi Arabia Solar Backsheet Industry Volume (Gigawatt) Forecast, by Application 2020 & 2033
- Table 93: South Africa Solar Backsheet Industry Revenue (Million) Forecast, by Application 2020 & 2033
- Table 94: South Africa Solar Backsheet Industry Volume (Gigawatt) Forecast, by Application 2020 & 2033
- Table 95: Rest of Middle East and Africa Solar Backsheet Industry Revenue (Million) Forecast, by Application 2020 & 2033
- Table 96: Rest of Middle East and Africa Solar Backsheet Industry Volume (Gigawatt) Forecast, by Application 2020 & 2033
- Table 97: Global Solar Backsheet Industry Revenue Million Forecast, by Types 2020 & 2033
- Table 98: Global Solar Backsheet Industry Volume Gigawatt Forecast, by Types 2020 & 2033
- Table 99: Global Solar Backsheet Industry Revenue Million Forecast, by Country 2020 & 2033
- Table 100: Global Solar Backsheet Industry Volume Gigawatt Forecast, by Country 2020 & 2033
- Table 101: Global Solar Backsheet Industry Revenue Million Forecast, by Types 2020 & 2033
- Table 102: Global Solar Backsheet Industry Volume Gigawatt Forecast, by Types 2020 & 2033
- Table 103: Global Solar Backsheet Industry Revenue Million Forecast, by Country 2020 & 2033
- Table 104: Global Solar Backsheet Industry Volume Gigawatt Forecast, by Country 2020 & 2033
- Table 105: Global Solar Backsheet Industry Revenue Million Forecast, by Types 2020 & 2033
- Table 106: Global Solar Backsheet Industry Volume Gigawatt Forecast, by Types 2020 & 2033
- Table 107: Global Solar Backsheet Industry Revenue Million Forecast, by Country 2020 & 2033
- Table 108: Global Solar Backsheet Industry Volume Gigawatt Forecast, by Country 2020 & 2033
- Table 109: Global Solar Backsheet Industry Revenue Million Forecast, by Types 2020 & 2033
- Table 110: Global Solar Backsheet Industry Volume Gigawatt Forecast, by Types 2020 & 2033
- Table 111: Global Solar Backsheet Industry Revenue Million Forecast, by Country 2020 & 2033
- Table 112: Global Solar Backsheet Industry Volume Gigawatt Forecast, by Country 2020 & 2033
- Table 113: Global Solar Backsheet Industry Revenue Million Forecast, by Types 2020 & 2033
- Table 114: Global Solar Backsheet Industry Volume Gigawatt Forecast, by Types 2020 & 2033
- Table 115: Global Solar Backsheet Industry Revenue Million Forecast, by Country 2020 & 2033
- Table 116: Global Solar Backsheet Industry Volume Gigawatt Forecast, by Country 2020 & 2033
Frequently Asked Questions
1. What is the projected Compound Annual Growth Rate (CAGR) of the Solar Backsheet Industry?
The projected CAGR is approximately > 15.50%.
2. Which companies are prominent players in the Solar Backsheet Industry?
Key companies in the market include Isovoltaic AG, Arkema SA, Toyo Aluminium KK, DuPont de Nemours Inc, Taiflex Scientific Co Ltd, Targray Technology International Inc *List Not Exhaustive, Coveme SpA, 3M Co, Krempel GmbH, Madico Inc.
3. What are the main segments of the Solar Backsheet Industry?
The market segments include Types.
4. Can you provide details about the market size?
The market size is estimated to be USD 2200 Million as of 2022.
5. What are some drivers contributing to market growth?
4.; Increasing Investments in Water Treatment by Developing Countries4.; Growing Demand for the Various End-Use Sectors.
6. What are the notable trends driving market growth?
Fluoropolymer is Expected to Become a Significant Segment.
7. Are there any restraints impacting market growth?
4.; Availability of Cheap and Alternative Pumps.
8. Can you provide examples of recent developments in the market?
In March 2021, Royal DSM, a global science-based company in health, nutrition, and sustainable living, agreed to sell its Advanced Solar business involved in backsheet products to the Worthen Industries Inc.
9. What pricing options are available for accessing the report?
Pricing options include single-user, multi-user, and enterprise licenses priced at USD 4750, USD 5250, and USD 8750 respectively.
10. Is the market size provided in terms of value or volume?
The market size is provided in terms of value, measured in Million and volume, measured in Gigawatt.
11. Are there any specific market keywords associated with the report?
Yes, the market keyword associated with the report is "Solar Backsheet Industry," which aids in identifying and referencing the specific market segment covered.
12. How do I determine which pricing option suits my needs best?
The pricing options vary based on user requirements and access needs. Individual users may opt for single-user licenses, while businesses requiring broader access may choose multi-user or enterprise licenses for cost-effective access to the report.
13. Are there any additional resources or data provided in the Solar Backsheet Industry report?
While the report offers comprehensive insights, it's advisable to review the specific contents or supplementary materials provided to ascertain if additional resources or data are available.
14. How can I stay updated on further developments or reports in the Solar Backsheet Industry?
To stay informed about further developments, trends, and reports in the Solar Backsheet Industry, consider subscribing to industry newsletters, following relevant companies and organizations, or regularly checking reputable industry news sources and publications.
Methodology
Step 1 - Identification of Relevant Samples Size from Population Database


Step 2 - Approaches for Defining Global Market Size (Value, Volume* & Price*)

Note*: In applicable scenarios
Step 3 - Data Sources
Primary Research
- Web Analytics
- Survey Reports
- Research Institute
- Latest Research Reports
- Opinion Leaders
Secondary Research
- Annual Reports
- White Paper
- Latest Press Release
- Industry Association
- Paid Database
- Investor Presentations

Step 4 - Data Triangulation
Involves using different sources of information in order to increase the validity of a study
These sources are likely to be stakeholders in a program - participants, other researchers, program staff, other community members, and so on.
Then we put all data in single framework & apply various statistical tools to find out the dynamic on the market.
During the analysis stage, feedback from the stakeholder groups would be compared to determine areas of agreement as well as areas of divergence
