

Key Insights
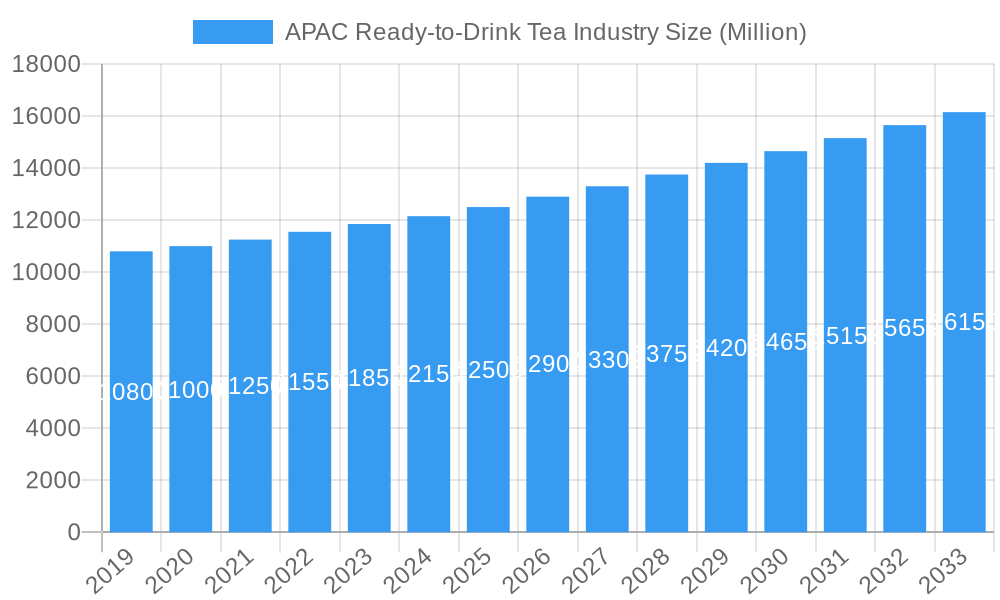
The Asia Pacific (APAC) Ready-to-Drink (RTD) Tea market is projected for substantial growth, forecasted to reach 51.8 billion by 2025, with a compound annual growth rate (CAGR) of 4.2%. This upward trend is driven by evolving consumer preferences for healthier beverage choices, rising disposable incomes, and the demand for convenient, on-the-go refreshment. Key factors fueling this expansion include the growing middle class in major Asian economies and increasing awareness of tea's health benefits. Product innovation, featuring diverse flavors and functional tea varieties, alongside strategic marketing, is attracting a wider consumer base. The market's growth is further supported by expanding distribution networks, particularly the surge in online retail and convenience stores, enhancing RTD tea accessibility.
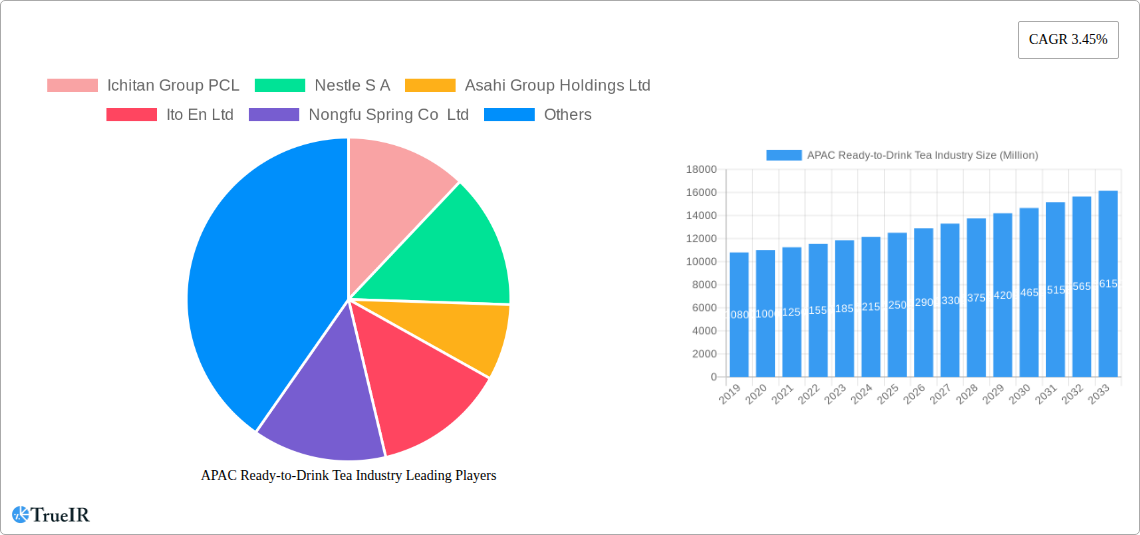
APAC Ready-to-Drink Tea Industry Market Size (In Billion)
Dominant market segments include Green Tea and Herbal Tea, valued for their perceived wellness properties. Aseptic packaging and PET bottles are leading packaging formats due to their convenience and cost-efficiency, aligning with regional fast-paced lifestyles. Off-trade channels, especially convenience stores and online platforms, are experiencing significant gains, reflecting changing consumer purchasing habits. While demand is robust, the market faces challenges such as intense competition from coffee and juices, and price volatility of tea leaves. Nevertheless, the APAC RTD Tea market's outlook remains highly promising, underpinned by sustained consumer appeal and ongoing innovation.
APAC Ready-to-Drink Tea Industry Company Market Share
APAC Ready-to-Drink Tea Industry Market Structure & Competitive Landscape
The APAC Ready-to-Drink (RTD) tea market is characterized by a dynamic and evolving competitive landscape, marked by both established global giants and agile local players. Market concentration is moderate, with significant market share held by a few leading companies, but with ample room for niche players and emerging brands. Innovation serves as a crucial driver, with companies continuously introducing new flavors, functional benefits, and sustainable packaging solutions to capture consumer attention. Regulatory impacts, while varying across countries, generally focus on food safety, labeling, and sugar content, influencing product development and marketing strategies. Product substitutes, including RTD coffee, juices, and other flavored beverages, present ongoing competition, necessitating continuous product differentiation and value proposition enhancement. End-user segmentation is broad, spanning health-conscious consumers, busy professionals, and younger demographics seeking convenient and refreshing beverage options. Mergers and acquisitions (M&A) trends, though not as rampant as in some other industries, play a role in market consolidation and expansion, with companies strategically acquiring smaller brands or technologies to bolster their portfolios. For instance, the acquisition of regional brands by larger conglomerates aims to leverage existing distribution networks and brand loyalty. The concentration ratio is estimated to be around XX%, indicating a competitive yet consolidated market. M&A volumes have seen a steady XX% increase year-on-year.
APAC Ready-to-Drink Tea Industry Market Trends & Opportunities
The APAC Ready-to-Drink (RTD) tea market is poised for significant expansion, driven by a confluence of evolving consumer preferences, technological advancements, and robust economic growth across the region. The market size is projected to witness a robust Compound Annual Growth Rate (CAGR) of approximately XX% from 2025 to 2033, reaching an estimated value of over X Million by the end of the forecast period. This growth trajectory is underpinned by a burgeoning middle class, increasing disposable incomes, and a growing demand for convenient, healthy, and on-the-go beverage solutions.
Technological shifts are profoundly impacting the RTD tea industry, from advanced brewing and filtration techniques that enhance flavor profiles and shelf life to innovative packaging technologies that improve sustainability and consumer experience. The proliferation of online retail channels has created new avenues for market penetration, allowing brands to reach consumers directly and offer a wider product selection. Smart manufacturing processes and supply chain optimizations are also contributing to increased efficiency and reduced costs, further fueling market growth.
Consumer preferences are increasingly leaning towards healthier options, driving demand for RTD teas with natural ingredients, lower sugar content, and added functional benefits such as vitamins, antioxidants, and adaptogens. Traditional tea varieties, particularly green tea and herbal infusions, are gaining popularity alongside innovative blends and flavors catering to diverse palates. The demand for premium and artisanal RTD teas is also on the rise, as consumers seek unique taste experiences and perceive these products as offering higher quality and value.
Competitive dynamics are intensifying, with both global beverage giants and local champions vying for market share. Companies are focusing on product innovation, aggressive marketing campaigns, and strategic partnerships to differentiate themselves. The rise of e-commerce and direct-to-consumer (DTC) models presents significant opportunities for brands to build stronger customer relationships and gather valuable market insights. Furthermore, a growing emphasis on sustainability and ethical sourcing is influencing consumer purchasing decisions, creating an opportunity for brands that can demonstrate a commitment to environmentally friendly practices and fair labor. The market penetration rate for RTD tea is expected to reach XX% by 2033, indicating substantial room for continued growth and adoption.
Dominant Markets & Segments in APAC Ready-to-Drink Tea Industry
The APAC Ready-to-Drink (RTD) tea industry exhibits distinct dominance across various geographical regions and product segments, driven by a complex interplay of consumer habits, economic development, and market penetration.
Dominant Regions and Countries:
- East Asia: China and Japan currently represent the largest and most mature markets within the APAC region. China's vast population, rapidly growing disposable income, and increasing urbanization have fueled an enormous demand for RTD beverages, including tea. The country's robust e-commerce infrastructure also plays a crucial role in the distribution of RTD teas. Japan, with its long-standing tea culture, demonstrates a high per capita consumption of RTD teas, particularly iced green tea, and exhibits a strong preference for premium and innovative offerings.
- Southeast Asia: Countries like Thailand, Indonesia, and Vietnam are emerging as significant growth hubs. Increasing urbanization, a young demographic, and a growing middle class are driving the demand for convenient and refreshing beverages. Government initiatives promoting healthier lifestyles and the expansion of modern retail formats further bolster market growth.
Dominant Segments:
Soft Drink Type:
- Green Tea: This segment holds the largest market share due to its perceived health benefits, refreshing taste, and widespread cultural acceptance across many APAC nations.
- Iced Tea: A perpetually popular category, iced tea continues to capture significant market share, driven by its versatility and appeal as a year-round beverage.
- Herbal Tea: Growing consumer interest in wellness and natural remedies is propelling the herbal tea segment, with consumers seeking specific functional benefits.
- Other RTD Tea: This category encompasses a diverse range of innovative blends and specialty teas, catering to evolving consumer tastes and demanding a more nuanced approach to product development.
Packaging Type:
- PET Bottles: Dominating the market, PET bottles offer convenience, affordability, and portability, making them the preferred choice for mass consumption and on-the-go accessibility.
- Aseptic Packages: Increasingly favored for their long shelf life and ability to preserve product quality without refrigeration, aseptic packages are gaining traction, especially for premium and functional RTD teas.
- Metal Cans: While holding a smaller share, metal cans are popular for their perceived premium appeal and effective preservation of carbonated RTD teas.
- Glass Bottles: Though facing declining popularity due to fragility and cost, glass bottles are still relevant for niche premium products and traditional offerings.
Distribution Channel:
- Off-trade:
- Convenience Stores: These outlets are crucial for impulse purchases and cater to immediate consumer needs, representing a substantial distribution channel.
- Online Retail: The rapid growth of e-commerce platforms is transforming the distribution landscape, offering unprecedented reach and convenience to consumers.
- Supermarket/Hypermarket: These large format retailers provide a wide selection and attract a broad consumer base, contributing significantly to RTD tea sales.
- On-trade: This channel, including cafes and restaurants, offers opportunities for premium and specialized RTD tea offerings, catering to consumers seeking an out-of-home beverage experience.
- Off-trade:
Growth drivers across these segments include expanding retail infrastructure, supportive government policies encouraging the beverage industry, and increasing consumer awareness of the health benefits associated with tea consumption.
APAC Ready-to-Drink Tea Industry Product Analysis
Product innovation in the APAC Ready-to-Drink (RTD) tea market is driven by a commitment to meeting diverse consumer needs and preferences. Companies are focusing on creating RTD teas with enhanced functional benefits, such as added vitamins, antioxidants, and probiotics, tapping into the growing wellness trend. The introduction of novel flavor profiles, including exotic fruit blends, floral infusions, and savory notes, caters to adventurous palates. Technological advancements in brewing and extraction methods are enabling the production of RTD teas that closely mimic the taste and aroma of freshly brewed beverages. Competitive advantages are being secured through sustainable packaging solutions, such as recyclable materials and reduced plastic usage, aligning with growing environmental consciousness. Furthermore, the development of low-sugar and sugar-free variants addresses concerns about health and obesity, expanding the appeal of RTD teas to a wider demographic. This focus on product differentiation, health attributes, and consumer-centric innovation is key to capturing market share.
Key Drivers, Barriers & Challenges in APAC Ready-to-Drink Tea Industry
Key Drivers:
- Rising Disposable Incomes: Growing economies across APAC are leading to increased purchasing power, enabling consumers to spend more on convenient and premium beverages like RTD teas.
- Health and Wellness Trends: A global shift towards healthier lifestyles fuels demand for RTD teas perceived as natural, low-sugar, and potentially offering functional benefits.
- Urbanization and Busy Lifestyles: The increasing urban population and fast-paced lives create a strong demand for convenient, on-the-go beverage solutions.
- Product Innovation and Diversification: Continuous introduction of new flavors, formulations (e.g., functional ingredients, low-sugar options), and packaging types keeps the market dynamic and appealing.
- E-commerce Growth: The expanding online retail landscape provides wider accessibility and direct consumer engagement, driving sales and market reach.
Barriers & Challenges:
- Intense Competition: The market is crowded with both global giants and local players, leading to price wars and pressure on profit margins.
- Regulatory Landscape: Varying food safety regulations, labeling requirements, and potential sugar taxes across different APAC countries can complicate market entry and product compliance.
- Supply Chain Volatility: Disruptions in raw material sourcing (tea leaves, packaging materials) due to climate change or geopolitical factors can impact production and costs.
- Consumer Price Sensitivity: While demand for premium products is rising, a significant portion of the market remains price-sensitive, making it challenging to pass on increased costs.
- Sustainability Concerns: Growing consumer and regulatory pressure for sustainable packaging and ethical sourcing requires significant investment and can add to operational costs.
Growth Drivers in the APAC Ready-to-Drink Tea Industry Market
Key growth drivers for the APAC Ready-to-Drink (RTD) Tea Industry include the burgeoning middle class with increasing disposable incomes, particularly in emerging economies within Southeast Asia and China, boosting consumer spending power. The escalating health and wellness consciousness among consumers is a significant catalyst, driving demand for RTD teas with perceived natural ingredients, lower sugar content, and added functional benefits like antioxidants and vitamins. Urbanization and the rise of fast-paced lifestyles are creating a substantial demand for convenient, on-the-go beverage options. Technological advancements in brewing and preservation techniques are enabling the creation of more diverse and appealing RTD tea products. Furthermore, supportive government policies in some regions aimed at promoting healthy consumption habits and the expansion of modern retail and e-commerce channels are playing a crucial role in market expansion.
Challenges Impacting APAC Ready-to-Drink Tea Industry Growth
Several challenges are impacting the growth of the APAC Ready-to-Drink Tea Industry. The intense competitive landscape, marked by the presence of numerous global and local players, leads to fierce price competition and necessitates significant marketing investments. Evolving regulatory frameworks across different countries concerning sugar content, labeling, and food safety can create compliance hurdles and necessitate product reformulation. Supply chain disruptions, including fluctuations in tea leaf availability due to climate change and the rising cost of packaging materials, pose a significant threat to consistent production and profitability. Consumer price sensitivity, especially in price-conscious markets, can limit the ability of companies to pass on increased operational or raw material costs. Finally, growing environmental concerns are placing pressure on companies to adopt more sustainable packaging solutions, requiring substantial investment in research and development and infrastructure.
Key Players Shaping the APAC Ready-to-Drink Tea Industry Market
- Ichitan Group PCL
- Nestle S A
- Asahi Group Holdings Ltd
- Ito En Ltd
- Nongfu Spring Co Ltd
- Tata Consumer Products Ltd
- PT Anggada Putra Rekso Mulia
- Suntory Holdings Limited
- JDB Group
- Tingyi (Cayman Islands) Holding Corporation
- The Coca-Cola Company
- Uni-President Enterprises Corp
- Kirin Holdings Company Limited
- Thai Beverages PCL
- Sapporo Holdings Limited
Significant APAC Ready-to-Drink Tea Industry Industry Milestones
- November 2023: The Coca-Cola Company's brand ChaiChun brought exquisite teas to Delhi with its new store, The ChaiChun Store, expanding its business.
- September 2022: Ayataka, a brand of iced green tea produced by Coca-Cola, has announced the release of its new Ayataka Cafe Matcha Latte which will hit stores across Japan.
- June 2021: Sermsuk launched “est Play plus vitamins B6 and B12”, a vitamin-infused carbonated soft drink (CSD) certified by “Healthier Choice” nutritional logo.
Future Outlook for APAC Ready-to-Drink Tea Industry Market
The future outlook for the APAC Ready-to-Drink (RTD) tea market is exceptionally promising, characterized by sustained growth and evolving consumer dynamics. Key growth catalysts include an expanding middle class with increasing discretionary income, a heightened focus on health and wellness driving demand for functional and low-sugar options, and the continued proliferation of convenient lifestyle choices facilitated by urbanization. Strategic opportunities lie in tapping into emerging markets, further innovating product portfolios with unique flavors and health-centric ingredients, and leveraging the expansive reach of e-commerce and direct-to-consumer models. The market potential is substantial, with ongoing advancements in packaging technology and a growing preference for sustainable products creating further avenues for differentiation and consumer engagement, ensuring the RTD tea market remains a vibrant and expanding segment within the broader beverage industry.
APAC Ready-to-Drink Tea Industry Segmentation
-
1. Soft Drink Type
- 1.1. Green Tea
- 1.2. Herbal Tea
- 1.3. Iced Tea
- 1.4. Other RTD Tea
-
2. Packaging Type
- 2.1. Aseptic packages
- 2.2. Glass Bottles
- 2.3. Metal Can
- 2.4. PET Bottles
-
3. Distribution Channel
-
3.1. Off-trade
- 3.1.1. Convenience Stores
- 3.1.2. Online Retail
- 3.1.3. Supermarket/Hypermarket
- 3.1.4. Others
- 3.2. On-trade
-
3.1. Off-trade
APAC Ready-to-Drink Tea Industry Segmentation By Geography
-
1. North America
- 1.1. United States
- 1.2. Canada
- 1.3. Mexico
-
2. South America
- 2.1. Brazil
- 2.2. Argentina
- 2.3. Rest of South America
-
3. Europe
- 3.1. United Kingdom
- 3.2. Germany
- 3.3. France
- 3.4. Italy
- 3.5. Spain
- 3.6. Russia
- 3.7. Benelux
- 3.8. Nordics
- 3.9. Rest of Europe
-
4. Middle East & Africa
- 4.1. Turkey
- 4.2. Israel
- 4.3. GCC
- 4.4. North Africa
- 4.5. South Africa
- 4.6. Rest of Middle East & Africa
-
5. Asia Pacific
- 5.1. China
- 5.2. India
- 5.3. Japan
- 5.4. South Korea
- 5.5. ASEAN
- 5.6. Oceania
- 5.7. Rest of Asia Pacific
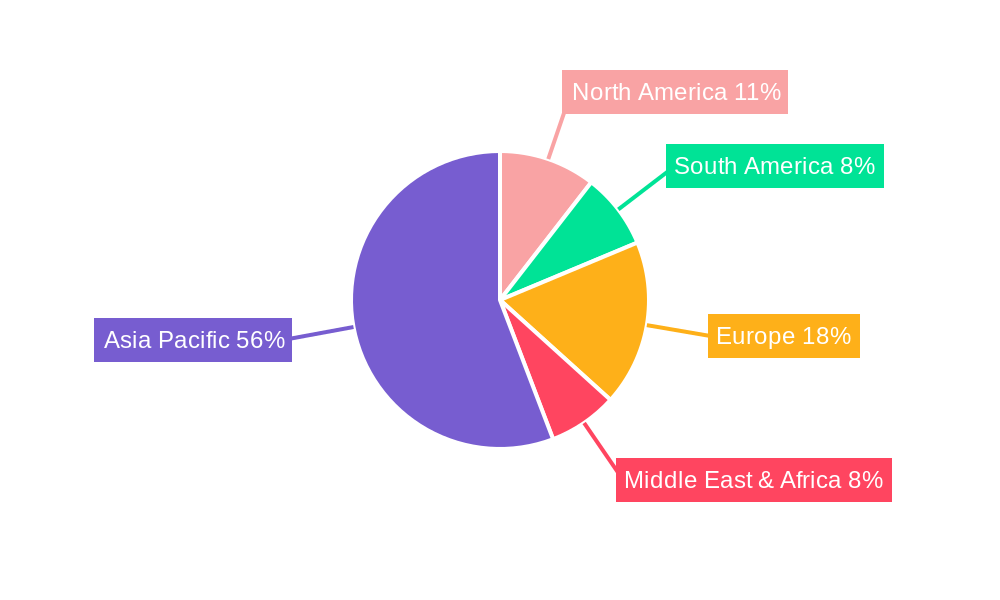
APAC Ready-to-Drink Tea Industry Regional Market Share
Geographic Coverage of APAC Ready-to-Drink Tea Industry
APAC Ready-to-Drink Tea Industry REPORT HIGHLIGHTS
| Aspects | Details |
|---|---|
| Study Period | 2020-2034 |
| Base Year | 2025 |
| Estimated Year | 2026 |
| Forecast Period | 2026-2034 |
| Historical Period | 2020-2025 |
| Growth Rate | CAGR of 4.2% from 2020-2034 |
| Segmentation |
|
Table of Contents
- 1. Introduction
- 1.1. Research Scope
- 1.2. Market Segmentation
- 1.3. Research Objective
- 1.4. Definitions and Assumptions
- 2. Executive Summary
- 2.1. Market Snapshot
- 3. Market Dynamics
- 3.1. Market Drivers
- 3.2. Market Restrains
- 3.3. Market Trends
- 3.4. Market Opportunities
- 4. Market Factor Analysis
- 4.1. Porters Five Forces
- 4.1.1. Bargaining Power of Suppliers
- 4.1.2. Bargaining Power of Buyers
- 4.1.3. Threat of New Entrants
- 4.1.4. Threat of Substitutes
- 4.1.5. Competitive Rivalry
- 4.2. PESTEL analysis
- 4.3. BCG Analysis
- 4.3.1. Stars (High Growth, High Market Share)
- 4.3.2. Cash Cows (Low Growth, High Market Share)
- 4.3.3. Question Mark (High Growth, Low Market Share)
- 4.3.4. Dogs (Low Growth, Low Market Share)
- 4.4. Ansoff Matrix Analysis
- 4.5. Supply Chain Analysis
- 4.6. Regulatory Landscape
- 4.7. Current Market Potential and Opportunity Assessment (TAM–SAM–SOM Framework)
- 4.8. TIR Analyst Note
- 4.1. Porters Five Forces
- 5. Market Analysis, Insights and Forecast 2021-2033
- 5.1. Market Analysis, Insights and Forecast - by Soft Drink Type
- 5.1.1. Green Tea
- 5.1.2. Herbal Tea
- 5.1.3. Iced Tea
- 5.1.4. Other RTD Tea
- 5.2. Market Analysis, Insights and Forecast - by Packaging Type
- 5.2.1. Aseptic packages
- 5.2.2. Glass Bottles
- 5.2.3. Metal Can
- 5.2.4. PET Bottles
- 5.3. Market Analysis, Insights and Forecast - by Distribution Channel
- 5.3.1. Off-trade
- 5.3.1.1. Convenience Stores
- 5.3.1.2. Online Retail
- 5.3.1.3. Supermarket/Hypermarket
- 5.3.1.4. Others
- 5.3.2. On-trade
- 5.3.1. Off-trade
- 5.4. Market Analysis, Insights and Forecast - by Region
- 5.4.1. North America
- 5.4.2. South America
- 5.4.3. Europe
- 5.4.4. Middle East & Africa
- 5.4.5. Asia Pacific
- 5.1. Market Analysis, Insights and Forecast - by Soft Drink Type
- 6. Global APAC Ready-to-Drink Tea Industry Analysis, Insights and Forecast, 2021-2033
- 6.1. Market Analysis, Insights and Forecast - by Soft Drink Type
- 6.1.1. Green Tea
- 6.1.2. Herbal Tea
- 6.1.3. Iced Tea
- 6.1.4. Other RTD Tea
- 6.2. Market Analysis, Insights and Forecast - by Packaging Type
- 6.2.1. Aseptic packages
- 6.2.2. Glass Bottles
- 6.2.3. Metal Can
- 6.2.4. PET Bottles
- 6.3. Market Analysis, Insights and Forecast - by Distribution Channel
- 6.3.1. Off-trade
- 6.3.1.1. Convenience Stores
- 6.3.1.2. Online Retail
- 6.3.1.3. Supermarket/Hypermarket
- 6.3.1.4. Others
- 6.3.2. On-trade
- 6.3.1. Off-trade
- 6.1. Market Analysis, Insights and Forecast - by Soft Drink Type
- 7. North America APAC Ready-to-Drink Tea Industry Analysis, Insights and Forecast, 2020-2032
- 7.1. Market Analysis, Insights and Forecast - by Soft Drink Type
- 7.1.1. Green Tea
- 7.1.2. Herbal Tea
- 7.1.3. Iced Tea
- 7.1.4. Other RTD Tea
- 7.2. Market Analysis, Insights and Forecast - by Packaging Type
- 7.2.1. Aseptic packages
- 7.2.2. Glass Bottles
- 7.2.3. Metal Can
- 7.2.4. PET Bottles
- 7.3. Market Analysis, Insights and Forecast - by Distribution Channel
- 7.3.1. Off-trade
- 7.3.1.1. Convenience Stores
- 7.3.1.2. Online Retail
- 7.3.1.3. Supermarket/Hypermarket
- 7.3.1.4. Others
- 7.3.2. On-trade
- 7.3.1. Off-trade
- 7.1. Market Analysis, Insights and Forecast - by Soft Drink Type
- 8. South America APAC Ready-to-Drink Tea Industry Analysis, Insights and Forecast, 2020-2032
- 8.1. Market Analysis, Insights and Forecast - by Soft Drink Type
- 8.1.1. Green Tea
- 8.1.2. Herbal Tea
- 8.1.3. Iced Tea
- 8.1.4. Other RTD Tea
- 8.2. Market Analysis, Insights and Forecast - by Packaging Type
- 8.2.1. Aseptic packages
- 8.2.2. Glass Bottles
- 8.2.3. Metal Can
- 8.2.4. PET Bottles
- 8.3. Market Analysis, Insights and Forecast - by Distribution Channel
- 8.3.1. Off-trade
- 8.3.1.1. Convenience Stores
- 8.3.1.2. Online Retail
- 8.3.1.3. Supermarket/Hypermarket
- 8.3.1.4. Others
- 8.3.2. On-trade
- 8.3.1. Off-trade
- 8.1. Market Analysis, Insights and Forecast - by Soft Drink Type
- 9. Europe APAC Ready-to-Drink Tea Industry Analysis, Insights and Forecast, 2020-2032
- 9.1. Market Analysis, Insights and Forecast - by Soft Drink Type
- 9.1.1. Green Tea
- 9.1.2. Herbal Tea
- 9.1.3. Iced Tea
- 9.1.4. Other RTD Tea
- 9.2. Market Analysis, Insights and Forecast - by Packaging Type
- 9.2.1. Aseptic packages
- 9.2.2. Glass Bottles
- 9.2.3. Metal Can
- 9.2.4. PET Bottles
- 9.3. Market Analysis, Insights and Forecast - by Distribution Channel
- 9.3.1. Off-trade
- 9.3.1.1. Convenience Stores
- 9.3.1.2. Online Retail
- 9.3.1.3. Supermarket/Hypermarket
- 9.3.1.4. Others
- 9.3.2. On-trade
- 9.3.1. Off-trade
- 9.1. Market Analysis, Insights and Forecast - by Soft Drink Type
- 10. Middle East & Africa APAC Ready-to-Drink Tea Industry Analysis, Insights and Forecast, 2020-2032
- 10.1. Market Analysis, Insights and Forecast - by Soft Drink Type
- 10.1.1. Green Tea
- 10.1.2. Herbal Tea
- 10.1.3. Iced Tea
- 10.1.4. Other RTD Tea
- 10.2. Market Analysis, Insights and Forecast - by Packaging Type
- 10.2.1. Aseptic packages
- 10.2.2. Glass Bottles
- 10.2.3. Metal Can
- 10.2.4. PET Bottles
- 10.3. Market Analysis, Insights and Forecast - by Distribution Channel
- 10.3.1. Off-trade
- 10.3.1.1. Convenience Stores
- 10.3.1.2. Online Retail
- 10.3.1.3. Supermarket/Hypermarket
- 10.3.1.4. Others
- 10.3.2. On-trade
- 10.3.1. Off-trade
- 10.1. Market Analysis, Insights and Forecast - by Soft Drink Type
- 11. Asia Pacific APAC Ready-to-Drink Tea Industry Analysis, Insights and Forecast, 2020-2032
- 11.1. Market Analysis, Insights and Forecast - by Soft Drink Type
- 11.1.1. Green Tea
- 11.1.2. Herbal Tea
- 11.1.3. Iced Tea
- 11.1.4. Other RTD Tea
- 11.2. Market Analysis, Insights and Forecast - by Packaging Type
- 11.2.1. Aseptic packages
- 11.2.2. Glass Bottles
- 11.2.3. Metal Can
- 11.2.4. PET Bottles
- 11.3. Market Analysis, Insights and Forecast - by Distribution Channel
- 11.3.1. Off-trade
- 11.3.1.1. Convenience Stores
- 11.3.1.2. Online Retail
- 11.3.1.3. Supermarket/Hypermarket
- 11.3.1.4. Others
- 11.3.2. On-trade
- 11.3.1. Off-trade
- 11.1. Market Analysis, Insights and Forecast - by Soft Drink Type
- 12. Competitive Analysis
- 12.1. Company Profiles
- 12.1.1 Ichitan Group PCL
- 12.1.1.1. Company Overview
- 12.1.1.2. Products
- 12.1.1.3. Company Financials
- 12.1.1.4. SWOT Analysis
- 12.1.2 Nestle S A
- 12.1.2.1. Company Overview
- 12.1.2.2. Products
- 12.1.2.3. Company Financials
- 12.1.2.4. SWOT Analysis
- 12.1.3 Asahi Group Holdings Ltd
- 12.1.3.1. Company Overview
- 12.1.3.2. Products
- 12.1.3.3. Company Financials
- 12.1.3.4. SWOT Analysis
- 12.1.4 Ito En Ltd
- 12.1.4.1. Company Overview
- 12.1.4.2. Products
- 12.1.4.3. Company Financials
- 12.1.4.4. SWOT Analysis
- 12.1.5 Nongfu Spring Co Ltd
- 12.1.5.1. Company Overview
- 12.1.5.2. Products
- 12.1.5.3. Company Financials
- 12.1.5.4. SWOT Analysis
- 12.1.6 Tata Consumer Products Ltd
- 12.1.6.1. Company Overview
- 12.1.6.2. Products
- 12.1.6.3. Company Financials
- 12.1.6.4. SWOT Analysis
- 12.1.7 PT Anggada Putra Rekso Mulia
- 12.1.7.1. Company Overview
- 12.1.7.2. Products
- 12.1.7.3. Company Financials
- 12.1.7.4. SWOT Analysis
- 12.1.8 Suntory Holdings Limited
- 12.1.8.1. Company Overview
- 12.1.8.2. Products
- 12.1.8.3. Company Financials
- 12.1.8.4. SWOT Analysis
- 12.1.9 JDB Group
- 12.1.9.1. Company Overview
- 12.1.9.2. Products
- 12.1.9.3. Company Financials
- 12.1.9.4. SWOT Analysis
- 12.1.10 Tingyi (Cayman Islands) Holding Corporation
- 12.1.10.1. Company Overview
- 12.1.10.2. Products
- 12.1.10.3. Company Financials
- 12.1.10.4. SWOT Analysis
- 12.1.11 The Coca-Cola Company
- 12.1.11.1. Company Overview
- 12.1.11.2. Products
- 12.1.11.3. Company Financials
- 12.1.11.4. SWOT Analysis
- 12.1.12 Uni-President Enterprises Corp
- 12.1.12.1. Company Overview
- 12.1.12.2. Products
- 12.1.12.3. Company Financials
- 12.1.12.4. SWOT Analysis
- 12.1.13 Kirin Holdings Company Limited
- 12.1.13.1. Company Overview
- 12.1.13.2. Products
- 12.1.13.3. Company Financials
- 12.1.13.4. SWOT Analysis
- 12.1.14 Thai Beverages PCL
- 12.1.14.1. Company Overview
- 12.1.14.2. Products
- 12.1.14.3. Company Financials
- 12.1.14.4. SWOT Analysis
- 12.1.15 Sapporo Holdings Limited
- 12.1.15.1. Company Overview
- 12.1.15.2. Products
- 12.1.15.3. Company Financials
- 12.1.15.4. SWOT Analysis
- 12.1.1 Ichitan Group PCL
- 12.2. Market Entropy
- 12.2.1 Company's Key Areas Served
- 12.2.2 Recent Developments
- 12.3. Company Market Share Analysis 2025
- 12.3.1 Top 5 Companies Market Share Analysis
- 12.3.2 Top 3 Companies Market Share Analysis
- 12.4. List of Potential Customers
- 13. Research Methodology
List of Figures
- Figure 1: Global APAC Ready-to-Drink Tea Industry Revenue Breakdown (billion, %) by Region 2025 & 2033
- Figure 2: North America APAC Ready-to-Drink Tea Industry Revenue (billion), by Soft Drink Type 2025 & 2033
- Figure 3: North America APAC Ready-to-Drink Tea Industry Revenue Share (%), by Soft Drink Type 2025 & 2033
- Figure 4: North America APAC Ready-to-Drink Tea Industry Revenue (billion), by Packaging Type 2025 & 2033
- Figure 5: North America APAC Ready-to-Drink Tea Industry Revenue Share (%), by Packaging Type 2025 & 2033
- Figure 6: North America APAC Ready-to-Drink Tea Industry Revenue (billion), by Distribution Channel 2025 & 2033
- Figure 7: North America APAC Ready-to-Drink Tea Industry Revenue Share (%), by Distribution Channel 2025 & 2033
- Figure 8: North America APAC Ready-to-Drink Tea Industry Revenue (billion), by Country 2025 & 2033
- Figure 9: North America APAC Ready-to-Drink Tea Industry Revenue Share (%), by Country 2025 & 2033
- Figure 10: South America APAC Ready-to-Drink Tea Industry Revenue (billion), by Soft Drink Type 2025 & 2033
- Figure 11: South America APAC Ready-to-Drink Tea Industry Revenue Share (%), by Soft Drink Type 2025 & 2033
- Figure 12: South America APAC Ready-to-Drink Tea Industry Revenue (billion), by Packaging Type 2025 & 2033
- Figure 13: South America APAC Ready-to-Drink Tea Industry Revenue Share (%), by Packaging Type 2025 & 2033
- Figure 14: South America APAC Ready-to-Drink Tea Industry Revenue (billion), by Distribution Channel 2025 & 2033
- Figure 15: South America APAC Ready-to-Drink Tea Industry Revenue Share (%), by Distribution Channel 2025 & 2033
- Figure 16: South America APAC Ready-to-Drink Tea Industry Revenue (billion), by Country 2025 & 2033
- Figure 17: South America APAC Ready-to-Drink Tea Industry Revenue Share (%), by Country 2025 & 2033
- Figure 18: Europe APAC Ready-to-Drink Tea Industry Revenue (billion), by Soft Drink Type 2025 & 2033
- Figure 19: Europe APAC Ready-to-Drink Tea Industry Revenue Share (%), by Soft Drink Type 2025 & 2033
- Figure 20: Europe APAC Ready-to-Drink Tea Industry Revenue (billion), by Packaging Type 2025 & 2033
- Figure 21: Europe APAC Ready-to-Drink Tea Industry Revenue Share (%), by Packaging Type 2025 & 2033
- Figure 22: Europe APAC Ready-to-Drink Tea Industry Revenue (billion), by Distribution Channel 2025 & 2033
- Figure 23: Europe APAC Ready-to-Drink Tea Industry Revenue Share (%), by Distribution Channel 2025 & 2033
- Figure 24: Europe APAC Ready-to-Drink Tea Industry Revenue (billion), by Country 2025 & 2033
- Figure 25: Europe APAC Ready-to-Drink Tea Industry Revenue Share (%), by Country 2025 & 2033
- Figure 26: Middle East & Africa APAC Ready-to-Drink Tea Industry Revenue (billion), by Soft Drink Type 2025 & 2033
- Figure 27: Middle East & Africa APAC Ready-to-Drink Tea Industry Revenue Share (%), by Soft Drink Type 2025 & 2033
- Figure 28: Middle East & Africa APAC Ready-to-Drink Tea Industry Revenue (billion), by Packaging Type 2025 & 2033
- Figure 29: Middle East & Africa APAC Ready-to-Drink Tea Industry Revenue Share (%), by Packaging Type 2025 & 2033
- Figure 30: Middle East & Africa APAC Ready-to-Drink Tea Industry Revenue (billion), by Distribution Channel 2025 & 2033
- Figure 31: Middle East & Africa APAC Ready-to-Drink Tea Industry Revenue Share (%), by Distribution Channel 2025 & 2033
- Figure 32: Middle East & Africa APAC Ready-to-Drink Tea Industry Revenue (billion), by Country 2025 & 2033
- Figure 33: Middle East & Africa APAC Ready-to-Drink Tea Industry Revenue Share (%), by Country 2025 & 2033
- Figure 34: Asia Pacific APAC Ready-to-Drink Tea Industry Revenue (billion), by Soft Drink Type 2025 & 2033
- Figure 35: Asia Pacific APAC Ready-to-Drink Tea Industry Revenue Share (%), by Soft Drink Type 2025 & 2033
- Figure 36: Asia Pacific APAC Ready-to-Drink Tea Industry Revenue (billion), by Packaging Type 2025 & 2033
- Figure 37: Asia Pacific APAC Ready-to-Drink Tea Industry Revenue Share (%), by Packaging Type 2025 & 2033
- Figure 38: Asia Pacific APAC Ready-to-Drink Tea Industry Revenue (billion), by Distribution Channel 2025 & 2033
- Figure 39: Asia Pacific APAC Ready-to-Drink Tea Industry Revenue Share (%), by Distribution Channel 2025 & 2033
- Figure 40: Asia Pacific APAC Ready-to-Drink Tea Industry Revenue (billion), by Country 2025 & 2033
- Figure 41: Asia Pacific APAC Ready-to-Drink Tea Industry Revenue Share (%), by Country 2025 & 2033
List of Tables
- Table 1: Global APAC Ready-to-Drink Tea Industry Revenue billion Forecast, by Soft Drink Type 2020 & 2033
- Table 2: Global APAC Ready-to-Drink Tea Industry Revenue billion Forecast, by Packaging Type 2020 & 2033
- Table 3: Global APAC Ready-to-Drink Tea Industry Revenue billion Forecast, by Distribution Channel 2020 & 2033
- Table 4: Global APAC Ready-to-Drink Tea Industry Revenue billion Forecast, by Region 2020 & 2033
- Table 5: Global APAC Ready-to-Drink Tea Industry Revenue billion Forecast, by Soft Drink Type 2020 & 2033
- Table 6: Global APAC Ready-to-Drink Tea Industry Revenue billion Forecast, by Packaging Type 2020 & 2033
- Table 7: Global APAC Ready-to-Drink Tea Industry Revenue billion Forecast, by Distribution Channel 2020 & 2033
- Table 8: Global APAC Ready-to-Drink Tea Industry Revenue billion Forecast, by Country 2020 & 2033
- Table 9: United States APAC Ready-to-Drink Tea Industry Revenue (billion) Forecast, by Application 2020 & 2033
- Table 10: Canada APAC Ready-to-Drink Tea Industry Revenue (billion) Forecast, by Application 2020 & 2033
- Table 11: Mexico APAC Ready-to-Drink Tea Industry Revenue (billion) Forecast, by Application 2020 & 2033
- Table 12: Global APAC Ready-to-Drink Tea Industry Revenue billion Forecast, by Soft Drink Type 2020 & 2033
- Table 13: Global APAC Ready-to-Drink Tea Industry Revenue billion Forecast, by Packaging Type 2020 & 2033
- Table 14: Global APAC Ready-to-Drink Tea Industry Revenue billion Forecast, by Distribution Channel 2020 & 2033
- Table 15: Global APAC Ready-to-Drink Tea Industry Revenue billion Forecast, by Country 2020 & 2033
- Table 16: Brazil APAC Ready-to-Drink Tea Industry Revenue (billion) Forecast, by Application 2020 & 2033
- Table 17: Argentina APAC Ready-to-Drink Tea Industry Revenue (billion) Forecast, by Application 2020 & 2033
- Table 18: Rest of South America APAC Ready-to-Drink Tea Industry Revenue (billion) Forecast, by Application 2020 & 2033
- Table 19: Global APAC Ready-to-Drink Tea Industry Revenue billion Forecast, by Soft Drink Type 2020 & 2033
- Table 20: Global APAC Ready-to-Drink Tea Industry Revenue billion Forecast, by Packaging Type 2020 & 2033
- Table 21: Global APAC Ready-to-Drink Tea Industry Revenue billion Forecast, by Distribution Channel 2020 & 2033
- Table 22: Global APAC Ready-to-Drink Tea Industry Revenue billion Forecast, by Country 2020 & 2033
- Table 23: United Kingdom APAC Ready-to-Drink Tea Industry Revenue (billion) Forecast, by Application 2020 & 2033
- Table 24: Germany APAC Ready-to-Drink Tea Industry Revenue (billion) Forecast, by Application 2020 & 2033
- Table 25: France APAC Ready-to-Drink Tea Industry Revenue (billion) Forecast, by Application 2020 & 2033
- Table 26: Italy APAC Ready-to-Drink Tea Industry Revenue (billion) Forecast, by Application 2020 & 2033
- Table 27: Spain APAC Ready-to-Drink Tea Industry Revenue (billion) Forecast, by Application 2020 & 2033
- Table 28: Russia APAC Ready-to-Drink Tea Industry Revenue (billion) Forecast, by Application 2020 & 2033
- Table 29: Benelux APAC Ready-to-Drink Tea Industry Revenue (billion) Forecast, by Application 2020 & 2033
- Table 30: Nordics APAC Ready-to-Drink Tea Industry Revenue (billion) Forecast, by Application 2020 & 2033
- Table 31: Rest of Europe APAC Ready-to-Drink Tea Industry Revenue (billion) Forecast, by Application 2020 & 2033
- Table 32: Global APAC Ready-to-Drink Tea Industry Revenue billion Forecast, by Soft Drink Type 2020 & 2033
- Table 33: Global APAC Ready-to-Drink Tea Industry Revenue billion Forecast, by Packaging Type 2020 & 2033
- Table 34: Global APAC Ready-to-Drink Tea Industry Revenue billion Forecast, by Distribution Channel 2020 & 2033
- Table 35: Global APAC Ready-to-Drink Tea Industry Revenue billion Forecast, by Country 2020 & 2033
- Table 36: Turkey APAC Ready-to-Drink Tea Industry Revenue (billion) Forecast, by Application 2020 & 2033
- Table 37: Israel APAC Ready-to-Drink Tea Industry Revenue (billion) Forecast, by Application 2020 & 2033
- Table 38: GCC APAC Ready-to-Drink Tea Industry Revenue (billion) Forecast, by Application 2020 & 2033
- Table 39: North Africa APAC Ready-to-Drink Tea Industry Revenue (billion) Forecast, by Application 2020 & 2033
- Table 40: South Africa APAC Ready-to-Drink Tea Industry Revenue (billion) Forecast, by Application 2020 & 2033
- Table 41: Rest of Middle East & Africa APAC Ready-to-Drink Tea Industry Revenue (billion) Forecast, by Application 2020 & 2033
- Table 42: Global APAC Ready-to-Drink Tea Industry Revenue billion Forecast, by Soft Drink Type 2020 & 2033
- Table 43: Global APAC Ready-to-Drink Tea Industry Revenue billion Forecast, by Packaging Type 2020 & 2033
- Table 44: Global APAC Ready-to-Drink Tea Industry Revenue billion Forecast, by Distribution Channel 2020 & 2033
- Table 45: Global APAC Ready-to-Drink Tea Industry Revenue billion Forecast, by Country 2020 & 2033
- Table 46: China APAC Ready-to-Drink Tea Industry Revenue (billion) Forecast, by Application 2020 & 2033
- Table 47: India APAC Ready-to-Drink Tea Industry Revenue (billion) Forecast, by Application 2020 & 2033
- Table 48: Japan APAC Ready-to-Drink Tea Industry Revenue (billion) Forecast, by Application 2020 & 2033
- Table 49: South Korea APAC Ready-to-Drink Tea Industry Revenue (billion) Forecast, by Application 2020 & 2033
- Table 50: ASEAN APAC Ready-to-Drink Tea Industry Revenue (billion) Forecast, by Application 2020 & 2033
- Table 51: Oceania APAC Ready-to-Drink Tea Industry Revenue (billion) Forecast, by Application 2020 & 2033
- Table 52: Rest of Asia Pacific APAC Ready-to-Drink Tea Industry Revenue (billion) Forecast, by Application 2020 & 2033
Frequently Asked Questions
1. What is the projected Compound Annual Growth Rate (CAGR) of the APAC Ready-to-Drink Tea Industry?
The projected CAGR is approximately 4.2%.
2. Which companies are prominent players in the APAC Ready-to-Drink Tea Industry?
Key companies in the market include Ichitan Group PCL, Nestle S A, Asahi Group Holdings Ltd, Ito En Ltd, Nongfu Spring Co Ltd, Tata Consumer Products Ltd, PT Anggada Putra Rekso Mulia, Suntory Holdings Limited, JDB Group, Tingyi (Cayman Islands) Holding Corporation, The Coca-Cola Company, Uni-President Enterprises Corp, Kirin Holdings Company Limited, Thai Beverages PCL, Sapporo Holdings Limited.
3. What are the main segments of the APAC Ready-to-Drink Tea Industry?
The market segments include Soft Drink Type, Packaging Type, Distribution Channel.
4. Can you provide details about the market size?
The market size is estimated to be USD 51.8 billion as of 2022.
5. What are some drivers contributing to market growth?
Rising Trend of Ingestible Beauty Products; Growing demand for Nutrient-Enriched Cosmetic Products.
6. What are the notable trends driving market growth?
OTHER KEY INDUSTRY TRENDS COVERED IN THE REPORT.
7. Are there any restraints impacting market growth?
Availability of Counterfeit Beauty Supplements Products.
8. Can you provide examples of recent developments in the market?
November 2023: The Coca-Cola Company's brand ChaiChun brought exquisite teas to Delhi with its new store, The ChaiChun Store, expanding its business.September 2022: Ayataka, a brand of iced green tea produced by Coca-Cola, has announced the release of its new Ayataka Cafe Matcha Latte which will hit stores across JapanJune 2021: Sermsuk launched “est Play plus vitamins B6 and B12”, a vitamin-infused carbonated soft drink (CSD) certified by “Healthier Choice” nutritional logo.
9. What pricing options are available for accessing the report?
Pricing options include single-user, multi-user, and enterprise licenses priced at USD 3800, USD 4500, and USD 5800 respectively.
10. Is the market size provided in terms of value or volume?
The market size is provided in terms of value, measured in billion.
11. Are there any specific market keywords associated with the report?
Yes, the market keyword associated with the report is "APAC Ready-to-Drink Tea Industry," which aids in identifying and referencing the specific market segment covered.
12. How do I determine which pricing option suits my needs best?
The pricing options vary based on user requirements and access needs. Individual users may opt for single-user licenses, while businesses requiring broader access may choose multi-user or enterprise licenses for cost-effective access to the report.
13. Are there any additional resources or data provided in the APAC Ready-to-Drink Tea Industry report?
While the report offers comprehensive insights, it's advisable to review the specific contents or supplementary materials provided to ascertain if additional resources or data are available.
14. How can I stay updated on further developments or reports in the APAC Ready-to-Drink Tea Industry?
To stay informed about further developments, trends, and reports in the APAC Ready-to-Drink Tea Industry, consider subscribing to industry newsletters, following relevant companies and organizations, or regularly checking reputable industry news sources and publications.
Methodology
Step 1 - Identification of Relevant Samples Size from Population Database


Step 2 - Approaches for Defining Global Market Size (Value, Volume* & Price*)

Note*: In applicable scenarios
Step 3 - Data Sources
Primary Research
- Web Analytics
- Survey Reports
- Research Institute
- Latest Research Reports
- Opinion Leaders
Secondary Research
- Annual Reports
- White Paper
- Latest Press Release
- Industry Association
- Paid Database
- Investor Presentations

Step 4 - Data Triangulation
Involves using different sources of information in order to increase the validity of a study
These sources are likely to be stakeholders in a program - participants, other researchers, program staff, other community members, and so on.
Then we put all data in single framework & apply various statistical tools to find out the dynamic on the market.
During the analysis stage, feedback from the stakeholder groups would be compared to determine areas of agreement as well as areas of divergence