

Key Insights
The U.S. Organic Chocolate Market is projected for substantial expansion, currently valued at $28.91 billion. This growth is propelled by heightened consumer consciousness of organic product health advantages and ethical sourcing, a rising preference for premium artisanal chocolate, and persistent demand for healthier indulgence alternatives. The market is anticipated to achieve a Compound Annual Growth Rate (CAGR) of 4.58% from the base year 2025, indicating sustained positive momentum.
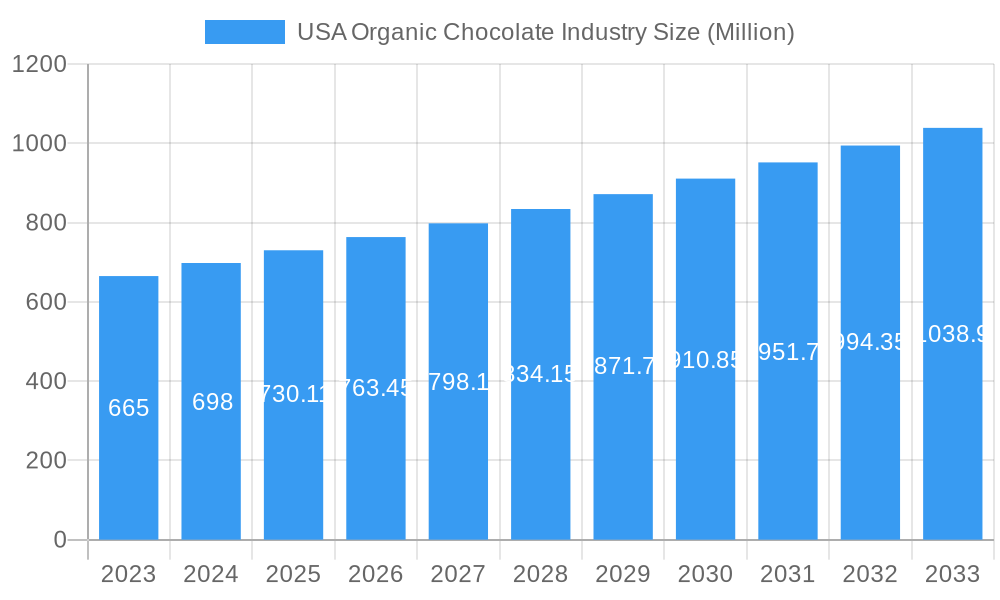
USA Organic Chocolate Industry Market Size (In Billion)
Key growth catalysts include the escalating popularity of dark chocolate, recognized for its antioxidant benefits, and ongoing innovation in flavor profiles and sustainable packaging by leading manufacturers. Expanded distribution channels, especially robust growth in e-commerce and convenience stores, are increasing organic chocolate accessibility, driving sales and market penetration.
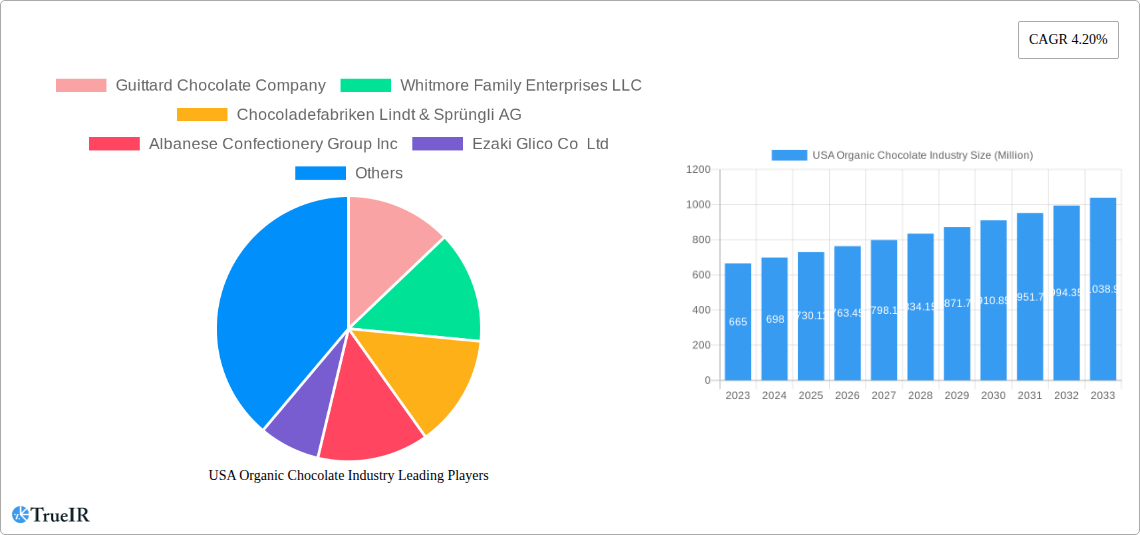
USA Organic Chocolate Industry Company Market Share
The competitive environment within the U.S. Organic Chocolate Market is characterized by both established international corporations and emerging specialized brands. Prominent players such as Guittard Chocolate Company, Mars Incorporated, Mondelēz International Inc., and The Hershey Company are leveraging their brand equity and wide distribution networks to secure significant market share in the organic segment. Concurrently, dedicated organic chocolate manufacturers are distinguishing themselves through unique sourcing practices, superior ingredients, and strong ethical stances. The market is segmented by confectionery type, with dark chocolate dominating demand, followed by milk and white chocolate. Distribution channels are varied, with supermarkets/hypermarkets and online retail stores serving as primary consumer purchase points, supported by the increasing presence of convenience stores. Future expansion will likely be driven by continuous product innovation, strategic collaborations, and an enduring consumer trend towards healthier, sustainably produced food options.
USA Organic Chocolate Industry Market Analysis & Forecast 2019-2033
This comprehensive report provides an in-depth analysis of the USA organic chocolate industry, a rapidly expanding market driven by increasing consumer demand for healthier, ethically sourced, and sustainable confectionery options. The study covers the historical period from 2019 to 2024, with a base year of 2025, and forecasts market performance through 2033. We delve into market structure, key trends, dominant segments, product innovations, driving forces, challenges, and the competitive landscape shaped by major industry players.
USA Organic Chocolate Industry Market Structure & Competitive Landscape
The USA organic chocolate industry is characterized by a dynamic market structure exhibiting moderate concentration. Leading players are increasingly focusing on innovation and sustainable sourcing to gain competitive advantages. Regulatory impacts, particularly those related to organic certifications and labeling, play a crucial role in shaping market entry and operational strategies. The threat of product substitutes, while present from conventional chocolates, is mitigated by the growing consumer preference for organic attributes. End-user segmentation reveals a strong demand from health-conscious consumers and ethically minded shoppers. Mergers and acquisitions (M&A) trends indicate strategic consolidations aimed at expanding market reach and product portfolios. For instance, recent M&A activities in the broader chocolate industry, projected to reach over 100 Million in deal value annually, signal a consolidation phase. Concentration ratios, estimated to be around 60% for the top 5 players, highlight the significant influence of established brands, while smaller artisanal producers contribute to market diversity. Innovation drivers include the development of novel flavor profiles, plant-based organic chocolate alternatives, and enhanced traceability through blockchain technology.
USA Organic Chocolate Industry Market Trends & Opportunities
The USA organic chocolate market is poised for significant growth, driven by a confluence of evolving consumer preferences and robust industry advancements. The market size is projected to expand at a Compound Annual Growth Rate (CAGR) of approximately 9.5% during the forecast period of 2025–2033, reaching an estimated value exceeding 5,000 Million by 2033. This surge is propelled by a heightened consumer awareness regarding the health benefits associated with organic ingredients, such as the absence of synthetic pesticides and fertilizers, and a growing emphasis on ethical sourcing and environmental sustainability. Consumers are increasingly willing to pay a premium for organic products, a trend evident in the rising market penetration rates for organic confectionery, which are estimated to reach over 40% by 2028. Technological shifts are playing a pivotal role, with advancements in bean-to-bar processing, sustainable packaging solutions, and transparent supply chain management enhancing consumer trust and brand loyalty. The demand for dark organic chocolate, rich in antioxidants, continues to dominate, but milk and white organic chocolate variants are also witnessing steady growth as manufacturers innovate with organic milk alternatives and ethically sourced cocoa butter. Competitive dynamics are intensifying, with both established confectionery giants and emerging artisanal brands vying for market share. This presents significant opportunities for companies focusing on unique flavor combinations, single-origin organic cocoa, and eco-friendly production methods. The rise of online retail stores and direct-to-consumer (DTC) channels offers a direct avenue for brands to connect with their target audience, share their sustainability stories, and cultivate a loyal customer base. Furthermore, the increasing popularity of plant-based diets is spurring innovation in vegan organic chocolate, expanding the market's appeal to a broader demographic. The overall market opportunity lies in catering to the discerning consumer who seeks not just taste but also a positive impact on personal well-being and the planet.
Dominant Markets & Segments in USA Organic Chocolate Industry
The USA organic chocolate industry is witnessing robust growth across multiple segments, with distinct regions and distribution channels emerging as key contributors. Geographically, North America, particularly the United States, represents the largest and most dynamic market. Within the USA, regions with higher disposable incomes and a greater prevalence of health-conscious consumers, such as the West Coast and parts of the Northeast, exhibit a stronger demand for organic chocolate.
Confectionery Variant:
- Dark Chocolate: This segment holds a dominant position due to its perceived health benefits, higher cocoa content, and sophisticated flavor profiles. Consumer preference for its antioxidant properties and lower sugar content drives its popularity. The market share for dark organic chocolate is estimated at over 55%.
- Milk and White Chocolate: While traditionally holding a smaller share than dark chocolate, these segments are experiencing accelerated growth, driven by product innovation and the availability of organic milk and plant-based milk alternatives. The demand for sweeter, more indulgent options continues to fuel their expansion, with an estimated market share of 35% and 10% respectively.
Distribution Channel:
- Supermarket/Hypermarket: This remains the primary distribution channel, offering widespread accessibility and convenience to a broad consumer base. The growing shelf space dedicated to organic products in these outlets further bolsters its dominance, contributing approximately 45% of sales.
- Online Retail Store: This channel is experiencing exponential growth, driven by the convenience of home delivery, the ability to discover niche brands, and the availability of a wider product selection. The increasing adoption of e-commerce by consumers for food and beverage purchases makes this a critical growth avenue, accounting for an estimated 30% of the market.
- Convenience Store: While a smaller contributor, convenience stores are increasingly stocking premium and organic options to cater to evolving consumer needs, particularly for impulse purchases. Their market share is estimated at 15%.
- Others: This category includes specialty organic stores, farmers' markets, and direct-to-consumer (DTC) sales, which, while smaller in volume, often represent higher profit margins and direct customer engagement, contributing around 10%.
Key growth drivers in these dominant markets include supportive government policies promoting organic farming, increased consumer awareness campaigns about the benefits of organic products, and the expansion of retail infrastructure in key regions. The growing disposable income of the target demographic further fuels demand for premium organic chocolate products across these channels.
USA Organic Chocolate Industry Product Analysis
Product innovation in the USA organic chocolate industry is primarily focused on enhancing flavor profiles, improving health attributes, and ensuring sustainable sourcing. Manufacturers are developing a diverse range of organic chocolate products, from single-origin dark chocolates with complex tasting notes to creamy milk and white chocolates crafted with organic dairy or plant-based alternatives. Competitive advantages are being built through certifications like USDA Organic and Fair Trade, which resonate strongly with ethically conscious consumers. Technological advancements in bean-to-bar processing allow for greater control over quality and flavor development, while innovative packaging solutions are addressing the growing demand for eco-friendly and compostable materials. The market fit is excellent as companies increasingly align their offerings with consumer desires for health, transparency, and environmental responsibility.
Key Drivers, Barriers & Challenges in USA Organic Chocolate Industry
Key Drivers: The USA organic chocolate industry is propelled by several key drivers. Technological advancements in sustainable farming and processing techniques are enhancing product quality and reducing environmental impact. Economic growth and rising disposable incomes allow consumers to allocate more spending towards premium organic products. Policy-driven factors, such as government incentives for organic agriculture and clear labeling regulations, foster market growth and consumer trust. For instance, the increasing consumer demand for transparency in food sourcing, a key trend, acts as a significant driver.
Barriers & Challenges: Despite its growth, the industry faces significant barriers and challenges. Supply chain complexities, including the sourcing of organic cocoa beans and potential disruptions, can impact availability and cost. Regulatory hurdles related to organic certification processes and differing state-level regulations can create compliance challenges. Competitive pressures from both established conventional chocolate brands and a growing number of organic competitors necessitate continuous innovation and effective marketing strategies. The higher cost of organic ingredients compared to conventional ones can also be a restraint, limiting market penetration among price-sensitive consumers.
Growth Drivers in the USA Organic Chocolate Industry Market
The growth drivers in the USA organic chocolate industry market are multifaceted. Technologically, advancements in sustainable cocoa cultivation and processing are enhancing the quality and yield of organic beans. Economically, rising disposable incomes among key consumer demographics translate to increased purchasing power for premium organic products. Policy-driven factors, such as the USDA Organic certification and initiatives promoting fair trade practices, build consumer confidence and market credibility. Furthermore, growing consumer awareness regarding the health benefits of organic ingredients, such as the absence of pesticides and GMOs, directly fuels demand. The increasing preference for ethical and sustainable consumption patterns is a significant catalyst, pushing brands to adopt more responsible sourcing and production methods.
Challenges Impacting USA Organic Chocolate Industry Growth
Challenges impacting USA organic chocolate industry growth are primarily centered around supply chain intricacies. The global nature of cocoa sourcing means that fluctuations in climate, political stability in producing regions, and logistical issues can significantly disrupt the availability and cost of organic cocoa beans, estimated to cause price volatility of up to 15% annually. Regulatory complexities, while aiming to ensure authenticity, can also present hurdles for new entrants and smaller businesses navigating the certification landscape. Competitive pressures are mounting, with both established brands expanding their organic lines and a burgeoning number of artisanal producers vying for consumer attention, leading to increased marketing costs. Furthermore, the premium pricing of organic chocolate, driven by higher production costs, can be a significant barrier for a segment of consumers, potentially capping market expansion.
Key Players Shaping the USA Organic Chocolate Industry Market
- Guittard Chocolate Company
- Whitmore Family Enterprises LLC
- Chocoladefabriken Lindt & Sprüngli AG
- Albanese Confectionery Group Inc
- Ezaki Glico Co Ltd
- Vosges Haut-Chocolat LLC
- Salmon River Foods Inc
- Ferrero International SA
- TCHO Ventures Inc
- Mars Incorporated
- Yıldız Holding A
- Barry Callebaut AG
- Mast Brothers & Co
- Mondelēz International Inc
- The Hershey Company
Significant USA Organic Chocolate Industry Industry Milestones
- November 2022: Yıldız Holding AS' brand GODIVA launched "Holiday Collection Packs" of premium chocolates. The chocolate packs include Milk Chocolate Praline Heart, Midnight Swirl, and White Chocolate Raspberry Star, targeting seasonal gifting and premium indulgence.
- October 2022: Lindt & Sprungli USA launched its first-ever 3D virtual store. Lindt's new online storefront allows consumers across the country to engage in the enchanting brand experience of a Lindt Chocolate store from the comfort of their homes or even on the go, enhancing digital customer engagement.
- September 2022: Mondelēz International Inc. expanded its Green & Black premium organic chocolate brand with the launch of a new range, Smooth, in North America, catering to the growing demand for premium organic options with accessible flavor profiles.
Future Outlook for USA Organic Chocolate Industry Market
The future outlook for the USA organic chocolate industry is exceptionally bright, driven by sustained consumer demand for healthier, ethically produced, and environmentally conscious products. Key growth catalysts include the continued innovation in plant-based organic chocolate, the expansion of direct-to-consumer (DTC) models offering personalized experiences and greater brand storytelling, and the increasing adoption of sustainable packaging solutions. Market potential is further amplified by the growing awareness of the health benefits associated with organic cocoa and the rising disposable incomes of target demographics. Strategic opportunities lie in leveraging advanced traceability technologies to enhance transparency, developing unique flavor profiles through collaborations, and expanding into underserved regional markets. The industry is well-positioned for robust expansion, with an estimated market size projected to reach over 5,000 Million by 2033.
USA Organic Chocolate Industry Segmentation
-
1. Confectionery Variant
- 1.1. Dark Chocolate
- 1.2. Milk and White Chocolate
-
2. Distribution Channel
- 2.1. Convenience Store
- 2.2. Online Retail Store
- 2.3. Supermarket/Hypermarket
- 2.4. Others
USA Organic Chocolate Industry Segmentation By Geography
-
1. North America
- 1.1. United States
- 1.2. Canada
- 1.3. Mexico
-
2. South America
- 2.1. Brazil
- 2.2. Argentina
- 2.3. Rest of South America
-
3. Europe
- 3.1. United Kingdom
- 3.2. Germany
- 3.3. France
- 3.4. Italy
- 3.5. Spain
- 3.6. Russia
- 3.7. Benelux
- 3.8. Nordics
- 3.9. Rest of Europe
-
4. Middle East & Africa
- 4.1. Turkey
- 4.2. Israel
- 4.3. GCC
- 4.4. North Africa
- 4.5. South Africa
- 4.6. Rest of Middle East & Africa
-
5. Asia Pacific
- 5.1. China
- 5.2. India
- 5.3. Japan
- 5.4. South Korea
- 5.5. ASEAN
- 5.6. Oceania
- 5.7. Rest of Asia Pacific
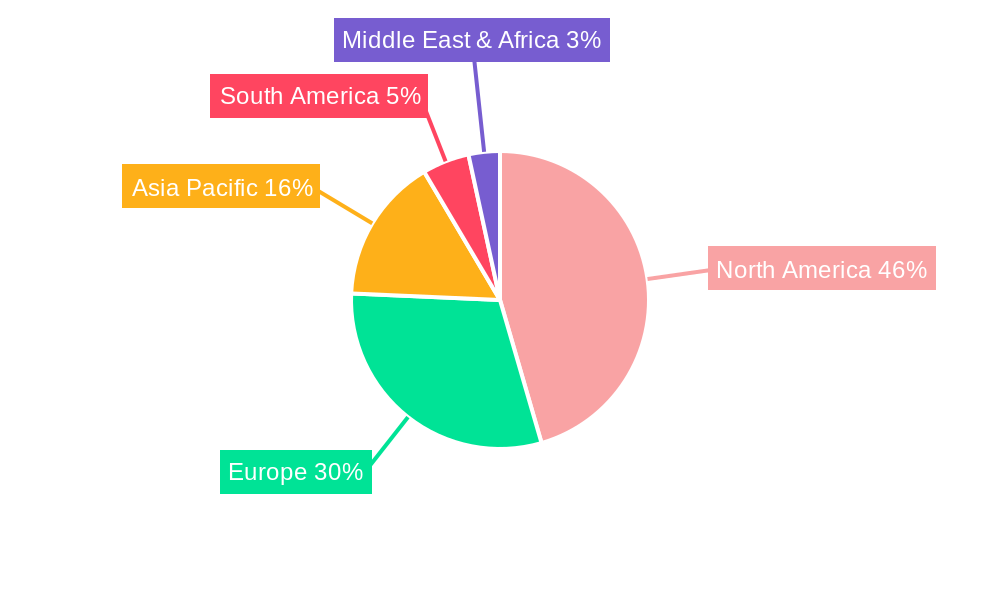
USA Organic Chocolate Industry Regional Market Share
Geographic Coverage of USA Organic Chocolate Industry
USA Organic Chocolate Industry REPORT HIGHLIGHTS
| Aspects | Details |
|---|---|
| Study Period | 2020-2034 |
| Base Year | 2025 |
| Estimated Year | 2026 |
| Forecast Period | 2026-2034 |
| Historical Period | 2020-2025 |
| Growth Rate | CAGR of 4.58% from 2020-2034 |
| Segmentation |
|
Table of Contents
- 1. Introduction
- 1.1. Research Scope
- 1.2. Market Segmentation
- 1.3. Research Methodology
- 1.4. Definitions and Assumptions
- 2. Executive Summary
- 2.1. Introduction
- 3. Market Dynamics
- 3.1. Introduction
- 3.2. Market Drivers
- 3.2.1. Escalating Demand for Processed Poultry Products; Favorable Government Initiatives to Boost Production
- 3.3. Market Restrains
- 3.3.1. Rising Vegan Trend among Young Consumers; Deeper Penetration of Red Meat Across Saudi Arabia
- 3.4. Market Trends
- 3.4.1. OTHER KEY INDUSTRY TRENDS COVERED IN THE REPORT
- 4. Market Factor Analysis
- 4.1. Porters Five Forces
- 4.2. Supply/Value Chain
- 4.3. PESTEL analysis
- 4.4. Market Entropy
- 4.5. Patent/Trademark Analysis
- 5. Global USA Organic Chocolate Industry Analysis, Insights and Forecast, 2020-2032
- 5.1. Market Analysis, Insights and Forecast - by Confectionery Variant
- 5.1.1. Dark Chocolate
- 5.1.2. Milk and White Chocolate
- 5.2. Market Analysis, Insights and Forecast - by Distribution Channel
- 5.2.1. Convenience Store
- 5.2.2. Online Retail Store
- 5.2.3. Supermarket/Hypermarket
- 5.2.4. Others
- 5.3. Market Analysis, Insights and Forecast - by Region
- 5.3.1. North America
- 5.3.2. South America
- 5.3.3. Europe
- 5.3.4. Middle East & Africa
- 5.3.5. Asia Pacific
- 5.1. Market Analysis, Insights and Forecast - by Confectionery Variant
- 6. North America USA Organic Chocolate Industry Analysis, Insights and Forecast, 2020-2032
- 6.1. Market Analysis, Insights and Forecast - by Confectionery Variant
- 6.1.1. Dark Chocolate
- 6.1.2. Milk and White Chocolate
- 6.2. Market Analysis, Insights and Forecast - by Distribution Channel
- 6.2.1. Convenience Store
- 6.2.2. Online Retail Store
- 6.2.3. Supermarket/Hypermarket
- 6.2.4. Others
- 6.1. Market Analysis, Insights and Forecast - by Confectionery Variant
- 7. South America USA Organic Chocolate Industry Analysis, Insights and Forecast, 2020-2032
- 7.1. Market Analysis, Insights and Forecast - by Confectionery Variant
- 7.1.1. Dark Chocolate
- 7.1.2. Milk and White Chocolate
- 7.2. Market Analysis, Insights and Forecast - by Distribution Channel
- 7.2.1. Convenience Store
- 7.2.2. Online Retail Store
- 7.2.3. Supermarket/Hypermarket
- 7.2.4. Others
- 7.1. Market Analysis, Insights and Forecast - by Confectionery Variant
- 8. Europe USA Organic Chocolate Industry Analysis, Insights and Forecast, 2020-2032
- 8.1. Market Analysis, Insights and Forecast - by Confectionery Variant
- 8.1.1. Dark Chocolate
- 8.1.2. Milk and White Chocolate
- 8.2. Market Analysis, Insights and Forecast - by Distribution Channel
- 8.2.1. Convenience Store
- 8.2.2. Online Retail Store
- 8.2.3. Supermarket/Hypermarket
- 8.2.4. Others
- 8.1. Market Analysis, Insights and Forecast - by Confectionery Variant
- 9. Middle East & Africa USA Organic Chocolate Industry Analysis, Insights and Forecast, 2020-2032
- 9.1. Market Analysis, Insights and Forecast - by Confectionery Variant
- 9.1.1. Dark Chocolate
- 9.1.2. Milk and White Chocolate
- 9.2. Market Analysis, Insights and Forecast - by Distribution Channel
- 9.2.1. Convenience Store
- 9.2.2. Online Retail Store
- 9.2.3. Supermarket/Hypermarket
- 9.2.4. Others
- 9.1. Market Analysis, Insights and Forecast - by Confectionery Variant
- 10. Asia Pacific USA Organic Chocolate Industry Analysis, Insights and Forecast, 2020-2032
- 10.1. Market Analysis, Insights and Forecast - by Confectionery Variant
- 10.1.1. Dark Chocolate
- 10.1.2. Milk and White Chocolate
- 10.2. Market Analysis, Insights and Forecast - by Distribution Channel
- 10.2.1. Convenience Store
- 10.2.2. Online Retail Store
- 10.2.3. Supermarket/Hypermarket
- 10.2.4. Others
- 10.1. Market Analysis, Insights and Forecast - by Confectionery Variant
- 11. Competitive Analysis
- 11.1. Global Market Share Analysis 2025
- 11.2. Company Profiles
- 11.2.1 Guittard Chocolate Company
- 11.2.1.1. Overview
- 11.2.1.2. Products
- 11.2.1.3. SWOT Analysis
- 11.2.1.4. Recent Developments
- 11.2.1.5. Financials (Based on Availability)
- 11.2.2 Whitmore Family Enterprises LLC
- 11.2.2.1. Overview
- 11.2.2.2. Products
- 11.2.2.3. SWOT Analysis
- 11.2.2.4. Recent Developments
- 11.2.2.5. Financials (Based on Availability)
- 11.2.3 Chocoladefabriken Lindt & Sprüngli AG
- 11.2.3.1. Overview
- 11.2.3.2. Products
- 11.2.3.3. SWOT Analysis
- 11.2.3.4. Recent Developments
- 11.2.3.5. Financials (Based on Availability)
- 11.2.4 Albanese Confectionery Group Inc
- 11.2.4.1. Overview
- 11.2.4.2. Products
- 11.2.4.3. SWOT Analysis
- 11.2.4.4. Recent Developments
- 11.2.4.5. Financials (Based on Availability)
- 11.2.5 Ezaki Glico Co Ltd
- 11.2.5.1. Overview
- 11.2.5.2. Products
- 11.2.5.3. SWOT Analysis
- 11.2.5.4. Recent Developments
- 11.2.5.5. Financials (Based on Availability)
- 11.2.6 Vosges Haut-Chocolat LLC
- 11.2.6.1. Overview
- 11.2.6.2. Products
- 11.2.6.3. SWOT Analysis
- 11.2.6.4. Recent Developments
- 11.2.6.5. Financials (Based on Availability)
- 11.2.7 Salmon River Foods Inc
- 11.2.7.1. Overview
- 11.2.7.2. Products
- 11.2.7.3. SWOT Analysis
- 11.2.7.4. Recent Developments
- 11.2.7.5. Financials (Based on Availability)
- 11.2.8 Ferrero International SA
- 11.2.8.1. Overview
- 11.2.8.2. Products
- 11.2.8.3. SWOT Analysis
- 11.2.8.4. Recent Developments
- 11.2.8.5. Financials (Based on Availability)
- 11.2.9 TCHO Ventures Inc
- 11.2.9.1. Overview
- 11.2.9.2. Products
- 11.2.9.3. SWOT Analysis
- 11.2.9.4. Recent Developments
- 11.2.9.5. Financials (Based on Availability)
- 11.2.10 Mars Incorporated
- 11.2.10.1. Overview
- 11.2.10.2. Products
- 11.2.10.3. SWOT Analysis
- 11.2.10.4. Recent Developments
- 11.2.10.5. Financials (Based on Availability)
- 11.2.11 Yıldız Holding A
- 11.2.11.1. Overview
- 11.2.11.2. Products
- 11.2.11.3. SWOT Analysis
- 11.2.11.4. Recent Developments
- 11.2.11.5. Financials (Based on Availability)
- 11.2.12 Barry Callebaut AG
- 11.2.12.1. Overview
- 11.2.12.2. Products
- 11.2.12.3. SWOT Analysis
- 11.2.12.4. Recent Developments
- 11.2.12.5. Financials (Based on Availability)
- 11.2.13 Mast Brothers & Co
- 11.2.13.1. Overview
- 11.2.13.2. Products
- 11.2.13.3. SWOT Analysis
- 11.2.13.4. Recent Developments
- 11.2.13.5. Financials (Based on Availability)
- 11.2.14 Mondelēz International Inc
- 11.2.14.1. Overview
- 11.2.14.2. Products
- 11.2.14.3. SWOT Analysis
- 11.2.14.4. Recent Developments
- 11.2.14.5. Financials (Based on Availability)
- 11.2.15 The Hershey Company
- 11.2.15.1. Overview
- 11.2.15.2. Products
- 11.2.15.3. SWOT Analysis
- 11.2.15.4. Recent Developments
- 11.2.15.5. Financials (Based on Availability)
- 11.2.1 Guittard Chocolate Company
List of Figures
- Figure 1: Global USA Organic Chocolate Industry Revenue Breakdown (billion, %) by Region 2025 & 2033
- Figure 2: Global USA Organic Chocolate Industry Volume Breakdown (Tons, %) by Region 2025 & 2033
- Figure 3: North America USA Organic Chocolate Industry Revenue (billion), by Confectionery Variant 2025 & 2033
- Figure 4: North America USA Organic Chocolate Industry Volume (Tons), by Confectionery Variant 2025 & 2033
- Figure 5: North America USA Organic Chocolate Industry Revenue Share (%), by Confectionery Variant 2025 & 2033
- Figure 6: North America USA Organic Chocolate Industry Volume Share (%), by Confectionery Variant 2025 & 2033
- Figure 7: North America USA Organic Chocolate Industry Revenue (billion), by Distribution Channel 2025 & 2033
- Figure 8: North America USA Organic Chocolate Industry Volume (Tons), by Distribution Channel 2025 & 2033
- Figure 9: North America USA Organic Chocolate Industry Revenue Share (%), by Distribution Channel 2025 & 2033
- Figure 10: North America USA Organic Chocolate Industry Volume Share (%), by Distribution Channel 2025 & 2033
- Figure 11: North America USA Organic Chocolate Industry Revenue (billion), by Country 2025 & 2033
- Figure 12: North America USA Organic Chocolate Industry Volume (Tons), by Country 2025 & 2033
- Figure 13: North America USA Organic Chocolate Industry Revenue Share (%), by Country 2025 & 2033
- Figure 14: North America USA Organic Chocolate Industry Volume Share (%), by Country 2025 & 2033
- Figure 15: South America USA Organic Chocolate Industry Revenue (billion), by Confectionery Variant 2025 & 2033
- Figure 16: South America USA Organic Chocolate Industry Volume (Tons), by Confectionery Variant 2025 & 2033
- Figure 17: South America USA Organic Chocolate Industry Revenue Share (%), by Confectionery Variant 2025 & 2033
- Figure 18: South America USA Organic Chocolate Industry Volume Share (%), by Confectionery Variant 2025 & 2033
- Figure 19: South America USA Organic Chocolate Industry Revenue (billion), by Distribution Channel 2025 & 2033
- Figure 20: South America USA Organic Chocolate Industry Volume (Tons), by Distribution Channel 2025 & 2033
- Figure 21: South America USA Organic Chocolate Industry Revenue Share (%), by Distribution Channel 2025 & 2033
- Figure 22: South America USA Organic Chocolate Industry Volume Share (%), by Distribution Channel 2025 & 2033
- Figure 23: South America USA Organic Chocolate Industry Revenue (billion), by Country 2025 & 2033
- Figure 24: South America USA Organic Chocolate Industry Volume (Tons), by Country 2025 & 2033
- Figure 25: South America USA Organic Chocolate Industry Revenue Share (%), by Country 2025 & 2033
- Figure 26: South America USA Organic Chocolate Industry Volume Share (%), by Country 2025 & 2033
- Figure 27: Europe USA Organic Chocolate Industry Revenue (billion), by Confectionery Variant 2025 & 2033
- Figure 28: Europe USA Organic Chocolate Industry Volume (Tons), by Confectionery Variant 2025 & 2033
- Figure 29: Europe USA Organic Chocolate Industry Revenue Share (%), by Confectionery Variant 2025 & 2033
- Figure 30: Europe USA Organic Chocolate Industry Volume Share (%), by Confectionery Variant 2025 & 2033
- Figure 31: Europe USA Organic Chocolate Industry Revenue (billion), by Distribution Channel 2025 & 2033
- Figure 32: Europe USA Organic Chocolate Industry Volume (Tons), by Distribution Channel 2025 & 2033
- Figure 33: Europe USA Organic Chocolate Industry Revenue Share (%), by Distribution Channel 2025 & 2033
- Figure 34: Europe USA Organic Chocolate Industry Volume Share (%), by Distribution Channel 2025 & 2033
- Figure 35: Europe USA Organic Chocolate Industry Revenue (billion), by Country 2025 & 2033
- Figure 36: Europe USA Organic Chocolate Industry Volume (Tons), by Country 2025 & 2033
- Figure 37: Europe USA Organic Chocolate Industry Revenue Share (%), by Country 2025 & 2033
- Figure 38: Europe USA Organic Chocolate Industry Volume Share (%), by Country 2025 & 2033
- Figure 39: Middle East & Africa USA Organic Chocolate Industry Revenue (billion), by Confectionery Variant 2025 & 2033
- Figure 40: Middle East & Africa USA Organic Chocolate Industry Volume (Tons), by Confectionery Variant 2025 & 2033
- Figure 41: Middle East & Africa USA Organic Chocolate Industry Revenue Share (%), by Confectionery Variant 2025 & 2033
- Figure 42: Middle East & Africa USA Organic Chocolate Industry Volume Share (%), by Confectionery Variant 2025 & 2033
- Figure 43: Middle East & Africa USA Organic Chocolate Industry Revenue (billion), by Distribution Channel 2025 & 2033
- Figure 44: Middle East & Africa USA Organic Chocolate Industry Volume (Tons), by Distribution Channel 2025 & 2033
- Figure 45: Middle East & Africa USA Organic Chocolate Industry Revenue Share (%), by Distribution Channel 2025 & 2033
- Figure 46: Middle East & Africa USA Organic Chocolate Industry Volume Share (%), by Distribution Channel 2025 & 2033
- Figure 47: Middle East & Africa USA Organic Chocolate Industry Revenue (billion), by Country 2025 & 2033
- Figure 48: Middle East & Africa USA Organic Chocolate Industry Volume (Tons), by Country 2025 & 2033
- Figure 49: Middle East & Africa USA Organic Chocolate Industry Revenue Share (%), by Country 2025 & 2033
- Figure 50: Middle East & Africa USA Organic Chocolate Industry Volume Share (%), by Country 2025 & 2033
- Figure 51: Asia Pacific USA Organic Chocolate Industry Revenue (billion), by Confectionery Variant 2025 & 2033
- Figure 52: Asia Pacific USA Organic Chocolate Industry Volume (Tons), by Confectionery Variant 2025 & 2033
- Figure 53: Asia Pacific USA Organic Chocolate Industry Revenue Share (%), by Confectionery Variant 2025 & 2033
- Figure 54: Asia Pacific USA Organic Chocolate Industry Volume Share (%), by Confectionery Variant 2025 & 2033
- Figure 55: Asia Pacific USA Organic Chocolate Industry Revenue (billion), by Distribution Channel 2025 & 2033
- Figure 56: Asia Pacific USA Organic Chocolate Industry Volume (Tons), by Distribution Channel 2025 & 2033
- Figure 57: Asia Pacific USA Organic Chocolate Industry Revenue Share (%), by Distribution Channel 2025 & 2033
- Figure 58: Asia Pacific USA Organic Chocolate Industry Volume Share (%), by Distribution Channel 2025 & 2033
- Figure 59: Asia Pacific USA Organic Chocolate Industry Revenue (billion), by Country 2025 & 2033
- Figure 60: Asia Pacific USA Organic Chocolate Industry Volume (Tons), by Country 2025 & 2033
- Figure 61: Asia Pacific USA Organic Chocolate Industry Revenue Share (%), by Country 2025 & 2033
- Figure 62: Asia Pacific USA Organic Chocolate Industry Volume Share (%), by Country 2025 & 2033
List of Tables
- Table 1: Global USA Organic Chocolate Industry Revenue billion Forecast, by Confectionery Variant 2020 & 2033
- Table 2: Global USA Organic Chocolate Industry Volume Tons Forecast, by Confectionery Variant 2020 & 2033
- Table 3: Global USA Organic Chocolate Industry Revenue billion Forecast, by Distribution Channel 2020 & 2033
- Table 4: Global USA Organic Chocolate Industry Volume Tons Forecast, by Distribution Channel 2020 & 2033
- Table 5: Global USA Organic Chocolate Industry Revenue billion Forecast, by Region 2020 & 2033
- Table 6: Global USA Organic Chocolate Industry Volume Tons Forecast, by Region 2020 & 2033
- Table 7: Global USA Organic Chocolate Industry Revenue billion Forecast, by Confectionery Variant 2020 & 2033
- Table 8: Global USA Organic Chocolate Industry Volume Tons Forecast, by Confectionery Variant 2020 & 2033
- Table 9: Global USA Organic Chocolate Industry Revenue billion Forecast, by Distribution Channel 2020 & 2033
- Table 10: Global USA Organic Chocolate Industry Volume Tons Forecast, by Distribution Channel 2020 & 2033
- Table 11: Global USA Organic Chocolate Industry Revenue billion Forecast, by Country 2020 & 2033
- Table 12: Global USA Organic Chocolate Industry Volume Tons Forecast, by Country 2020 & 2033
- Table 13: United States USA Organic Chocolate Industry Revenue (billion) Forecast, by Application 2020 & 2033
- Table 14: United States USA Organic Chocolate Industry Volume (Tons) Forecast, by Application 2020 & 2033
- Table 15: Canada USA Organic Chocolate Industry Revenue (billion) Forecast, by Application 2020 & 2033
- Table 16: Canada USA Organic Chocolate Industry Volume (Tons) Forecast, by Application 2020 & 2033
- Table 17: Mexico USA Organic Chocolate Industry Revenue (billion) Forecast, by Application 2020 & 2033
- Table 18: Mexico USA Organic Chocolate Industry Volume (Tons) Forecast, by Application 2020 & 2033
- Table 19: Global USA Organic Chocolate Industry Revenue billion Forecast, by Confectionery Variant 2020 & 2033
- Table 20: Global USA Organic Chocolate Industry Volume Tons Forecast, by Confectionery Variant 2020 & 2033
- Table 21: Global USA Organic Chocolate Industry Revenue billion Forecast, by Distribution Channel 2020 & 2033
- Table 22: Global USA Organic Chocolate Industry Volume Tons Forecast, by Distribution Channel 2020 & 2033
- Table 23: Global USA Organic Chocolate Industry Revenue billion Forecast, by Country 2020 & 2033
- Table 24: Global USA Organic Chocolate Industry Volume Tons Forecast, by Country 2020 & 2033
- Table 25: Brazil USA Organic Chocolate Industry Revenue (billion) Forecast, by Application 2020 & 2033
- Table 26: Brazil USA Organic Chocolate Industry Volume (Tons) Forecast, by Application 2020 & 2033
- Table 27: Argentina USA Organic Chocolate Industry Revenue (billion) Forecast, by Application 2020 & 2033
- Table 28: Argentina USA Organic Chocolate Industry Volume (Tons) Forecast, by Application 2020 & 2033
- Table 29: Rest of South America USA Organic Chocolate Industry Revenue (billion) Forecast, by Application 2020 & 2033
- Table 30: Rest of South America USA Organic Chocolate Industry Volume (Tons) Forecast, by Application 2020 & 2033
- Table 31: Global USA Organic Chocolate Industry Revenue billion Forecast, by Confectionery Variant 2020 & 2033
- Table 32: Global USA Organic Chocolate Industry Volume Tons Forecast, by Confectionery Variant 2020 & 2033
- Table 33: Global USA Organic Chocolate Industry Revenue billion Forecast, by Distribution Channel 2020 & 2033
- Table 34: Global USA Organic Chocolate Industry Volume Tons Forecast, by Distribution Channel 2020 & 2033
- Table 35: Global USA Organic Chocolate Industry Revenue billion Forecast, by Country 2020 & 2033
- Table 36: Global USA Organic Chocolate Industry Volume Tons Forecast, by Country 2020 & 2033
- Table 37: United Kingdom USA Organic Chocolate Industry Revenue (billion) Forecast, by Application 2020 & 2033
- Table 38: United Kingdom USA Organic Chocolate Industry Volume (Tons) Forecast, by Application 2020 & 2033
- Table 39: Germany USA Organic Chocolate Industry Revenue (billion) Forecast, by Application 2020 & 2033
- Table 40: Germany USA Organic Chocolate Industry Volume (Tons) Forecast, by Application 2020 & 2033
- Table 41: France USA Organic Chocolate Industry Revenue (billion) Forecast, by Application 2020 & 2033
- Table 42: France USA Organic Chocolate Industry Volume (Tons) Forecast, by Application 2020 & 2033
- Table 43: Italy USA Organic Chocolate Industry Revenue (billion) Forecast, by Application 2020 & 2033
- Table 44: Italy USA Organic Chocolate Industry Volume (Tons) Forecast, by Application 2020 & 2033
- Table 45: Spain USA Organic Chocolate Industry Revenue (billion) Forecast, by Application 2020 & 2033
- Table 46: Spain USA Organic Chocolate Industry Volume (Tons) Forecast, by Application 2020 & 2033
- Table 47: Russia USA Organic Chocolate Industry Revenue (billion) Forecast, by Application 2020 & 2033
- Table 48: Russia USA Organic Chocolate Industry Volume (Tons) Forecast, by Application 2020 & 2033
- Table 49: Benelux USA Organic Chocolate Industry Revenue (billion) Forecast, by Application 2020 & 2033
- Table 50: Benelux USA Organic Chocolate Industry Volume (Tons) Forecast, by Application 2020 & 2033
- Table 51: Nordics USA Organic Chocolate Industry Revenue (billion) Forecast, by Application 2020 & 2033
- Table 52: Nordics USA Organic Chocolate Industry Volume (Tons) Forecast, by Application 2020 & 2033
- Table 53: Rest of Europe USA Organic Chocolate Industry Revenue (billion) Forecast, by Application 2020 & 2033
- Table 54: Rest of Europe USA Organic Chocolate Industry Volume (Tons) Forecast, by Application 2020 & 2033
- Table 55: Global USA Organic Chocolate Industry Revenue billion Forecast, by Confectionery Variant 2020 & 2033
- Table 56: Global USA Organic Chocolate Industry Volume Tons Forecast, by Confectionery Variant 2020 & 2033
- Table 57: Global USA Organic Chocolate Industry Revenue billion Forecast, by Distribution Channel 2020 & 2033
- Table 58: Global USA Organic Chocolate Industry Volume Tons Forecast, by Distribution Channel 2020 & 2033
- Table 59: Global USA Organic Chocolate Industry Revenue billion Forecast, by Country 2020 & 2033
- Table 60: Global USA Organic Chocolate Industry Volume Tons Forecast, by Country 2020 & 2033
- Table 61: Turkey USA Organic Chocolate Industry Revenue (billion) Forecast, by Application 2020 & 2033
- Table 62: Turkey USA Organic Chocolate Industry Volume (Tons) Forecast, by Application 2020 & 2033
- Table 63: Israel USA Organic Chocolate Industry Revenue (billion) Forecast, by Application 2020 & 2033
- Table 64: Israel USA Organic Chocolate Industry Volume (Tons) Forecast, by Application 2020 & 2033
- Table 65: GCC USA Organic Chocolate Industry Revenue (billion) Forecast, by Application 2020 & 2033
- Table 66: GCC USA Organic Chocolate Industry Volume (Tons) Forecast, by Application 2020 & 2033
- Table 67: North Africa USA Organic Chocolate Industry Revenue (billion) Forecast, by Application 2020 & 2033
- Table 68: North Africa USA Organic Chocolate Industry Volume (Tons) Forecast, by Application 2020 & 2033
- Table 69: South Africa USA Organic Chocolate Industry Revenue (billion) Forecast, by Application 2020 & 2033
- Table 70: South Africa USA Organic Chocolate Industry Volume (Tons) Forecast, by Application 2020 & 2033
- Table 71: Rest of Middle East & Africa USA Organic Chocolate Industry Revenue (billion) Forecast, by Application 2020 & 2033
- Table 72: Rest of Middle East & Africa USA Organic Chocolate Industry Volume (Tons) Forecast, by Application 2020 & 2033
- Table 73: Global USA Organic Chocolate Industry Revenue billion Forecast, by Confectionery Variant 2020 & 2033
- Table 74: Global USA Organic Chocolate Industry Volume Tons Forecast, by Confectionery Variant 2020 & 2033
- Table 75: Global USA Organic Chocolate Industry Revenue billion Forecast, by Distribution Channel 2020 & 2033
- Table 76: Global USA Organic Chocolate Industry Volume Tons Forecast, by Distribution Channel 2020 & 2033
- Table 77: Global USA Organic Chocolate Industry Revenue billion Forecast, by Country 2020 & 2033
- Table 78: Global USA Organic Chocolate Industry Volume Tons Forecast, by Country 2020 & 2033
- Table 79: China USA Organic Chocolate Industry Revenue (billion) Forecast, by Application 2020 & 2033
- Table 80: China USA Organic Chocolate Industry Volume (Tons) Forecast, by Application 2020 & 2033
- Table 81: India USA Organic Chocolate Industry Revenue (billion) Forecast, by Application 2020 & 2033
- Table 82: India USA Organic Chocolate Industry Volume (Tons) Forecast, by Application 2020 & 2033
- Table 83: Japan USA Organic Chocolate Industry Revenue (billion) Forecast, by Application 2020 & 2033
- Table 84: Japan USA Organic Chocolate Industry Volume (Tons) Forecast, by Application 2020 & 2033
- Table 85: South Korea USA Organic Chocolate Industry Revenue (billion) Forecast, by Application 2020 & 2033
- Table 86: South Korea USA Organic Chocolate Industry Volume (Tons) Forecast, by Application 2020 & 2033
- Table 87: ASEAN USA Organic Chocolate Industry Revenue (billion) Forecast, by Application 2020 & 2033
- Table 88: ASEAN USA Organic Chocolate Industry Volume (Tons) Forecast, by Application 2020 & 2033
- Table 89: Oceania USA Organic Chocolate Industry Revenue (billion) Forecast, by Application 2020 & 2033
- Table 90: Oceania USA Organic Chocolate Industry Volume (Tons) Forecast, by Application 2020 & 2033
- Table 91: Rest of Asia Pacific USA Organic Chocolate Industry Revenue (billion) Forecast, by Application 2020 & 2033
- Table 92: Rest of Asia Pacific USA Organic Chocolate Industry Volume (Tons) Forecast, by Application 2020 & 2033
Frequently Asked Questions
1. What is the projected Compound Annual Growth Rate (CAGR) of the USA Organic Chocolate Industry?
The projected CAGR is approximately 4.58%.
2. Which companies are prominent players in the USA Organic Chocolate Industry?
Key companies in the market include Guittard Chocolate Company, Whitmore Family Enterprises LLC, Chocoladefabriken Lindt & Sprüngli AG, Albanese Confectionery Group Inc, Ezaki Glico Co Ltd, Vosges Haut-Chocolat LLC, Salmon River Foods Inc, Ferrero International SA, TCHO Ventures Inc, Mars Incorporated, Yıldız Holding A, Barry Callebaut AG, Mast Brothers & Co, Mondelēz International Inc, The Hershey Company.
3. What are the main segments of the USA Organic Chocolate Industry?
The market segments include Confectionery Variant, Distribution Channel.
4. Can you provide details about the market size?
The market size is estimated to be USD 28.91 billion as of 2022.
5. What are some drivers contributing to market growth?
Escalating Demand for Processed Poultry Products; Favorable Government Initiatives to Boost Production.
6. What are the notable trends driving market growth?
OTHER KEY INDUSTRY TRENDS COVERED IN THE REPORT.
7. Are there any restraints impacting market growth?
Rising Vegan Trend among Young Consumers; Deeper Penetration of Red Meat Across Saudi Arabia.
8. Can you provide examples of recent developments in the market?
November 2022: Yıldız Holding AS' brand GODIVA launched "Holiday Collection Packs" of premium chocolates. The chocolate packs include Milk Chocolate Praline Heart, Midnight Swirl, and White Chocolate Raspberry Star.October 2022: Lindt & Sprungli USA launched its first-ever 3D virtual store. Lindt's new online storefront allows consumers across the country to engage in the enchanting brand experience of a Lindt Chocolate store from the comfort of their homes or even on the go.September 2022: Mondelēz International Inc. expanded its Green & Black premium organic chocolate brand with the launch of a new range, Smooth, in North America.
9. What pricing options are available for accessing the report?
Pricing options include single-user, multi-user, and enterprise licenses priced at USD 3800, USD 4500, and USD 5800 respectively.
10. Is the market size provided in terms of value or volume?
The market size is provided in terms of value, measured in billion and volume, measured in Tons.
11. Are there any specific market keywords associated with the report?
Yes, the market keyword associated with the report is "USA Organic Chocolate Industry," which aids in identifying and referencing the specific market segment covered.
12. How do I determine which pricing option suits my needs best?
The pricing options vary based on user requirements and access needs. Individual users may opt for single-user licenses, while businesses requiring broader access may choose multi-user or enterprise licenses for cost-effective access to the report.
13. Are there any additional resources or data provided in the USA Organic Chocolate Industry report?
While the report offers comprehensive insights, it's advisable to review the specific contents or supplementary materials provided to ascertain if additional resources or data are available.
14. How can I stay updated on further developments or reports in the USA Organic Chocolate Industry?
To stay informed about further developments, trends, and reports in the USA Organic Chocolate Industry, consider subscribing to industry newsletters, following relevant companies and organizations, or regularly checking reputable industry news sources and publications.
Methodology
Step 1 - Identification of Relevant Samples Size from Population Database


Step 2 - Approaches for Defining Global Market Size (Value, Volume* & Price*)

Note*: In applicable scenarios
Step 3 - Data Sources
Primary Research
- Web Analytics
- Survey Reports
- Research Institute
- Latest Research Reports
- Opinion Leaders
Secondary Research
- Annual Reports
- White Paper
- Latest Press Release
- Industry Association
- Paid Database
- Investor Presentations

Step 4 - Data Triangulation
Involves using different sources of information in order to increase the validity of a study
These sources are likely to be stakeholders in a program - participants, other researchers, program staff, other community members, and so on.
Then we put all data in single framework & apply various statistical tools to find out the dynamic on the market.
During the analysis stage, feedback from the stakeholder groups would be compared to determine areas of agreement as well as areas of divergence