

Key Insights
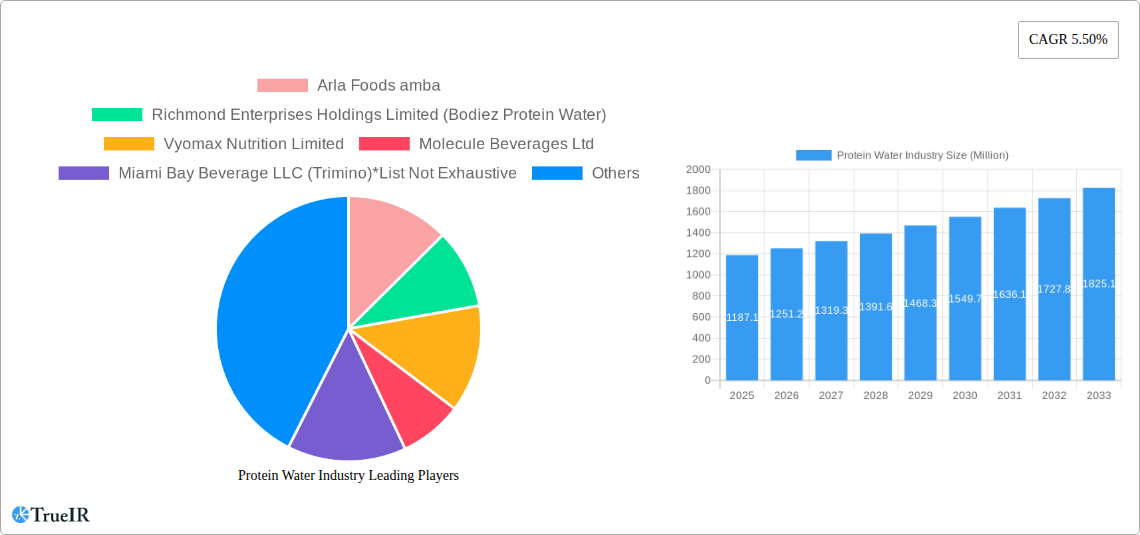
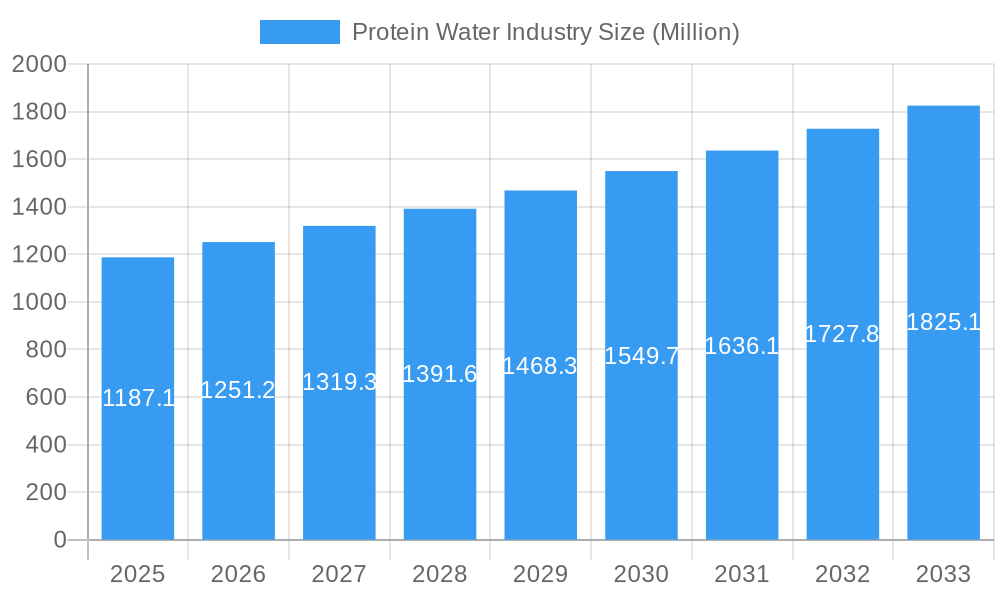
The global Protein Water market is poised for significant expansion, currently valued at an estimated USD 1187.1 million in 2025, and projected to grow at a robust Compound Annual Growth Rate (CAGR) of 5.50% through 2033. This impressive growth trajectory is fueled by a confluence of evolving consumer preferences and lifestyle shifts. A primary driver is the increasing health and wellness consciousness among consumers, who are actively seeking convenient and effective ways to supplement their protein intake. This is particularly evident in the rise of fitness-oriented lifestyles, where protein is recognized as a crucial component for muscle repair, recovery, and overall well-being. Furthermore, the growing demand for low-calorie, sugar-free beverage options that offer functional benefits beyond simple hydration presents a substantial opportunity for protein water. The market's expansion is also bolstered by ongoing product innovation, with manufacturers increasingly focusing on developing diverse flavor profiles and catering to specific dietary needs, such as vegan or lactose-free options, thus broadening the appeal of protein water across various consumer segments.
Protein Water Industry Market Size (In Billion)
The competitive landscape of the protein water industry is dynamic, characterized by the presence of both established food and beverage giants and emerging specialized brands. Key players like Arla Foods amba, Glanbia PLC (Optimum Nutrition Inc), and Richmond Enterprises Holdings Limited are actively innovating and expanding their product portfolios to capture market share. Distribution channels are also evolving, with a notable shift towards online sales, offering greater accessibility and convenience to consumers. While the market is experiencing strong growth, certain factors could influence its pace. These include the potential for higher-than-anticipated production costs for specialized ingredients or packaging, and increased competition from other functional beverage categories that offer similar health benefits. However, the overarching trend of consumers prioritizing health and seeking convenient, protein-rich options is expected to sustain a positive growth outlook for the protein water market in the coming years, making it an attractive segment for investment and innovation.
Protein Water Industry Company Market Share
This in-depth protein water market report delivers critical insights into the burgeoning functional beverage industry. Analyzing the global protein water market size, growth trends, and competitive landscape, this report provides a definitive roadmap for stakeholders. Leveraging high-volume keywords such as "whey protein water," "vegan protein water," and "low-calorie protein drinks," we offer actionable intelligence for strategic decision-making within this dynamic sector. The study spans from 2019 to 2033, with a base and estimated year of 2025, and a comprehensive forecast period from 2025 to 2033. Historical data from 2019-2024 is thoroughly examined.
Protein Water Industry Market Structure & Competitive Landscape
The protein water market exhibits a moderately concentrated structure, with a blend of established global beverage giants and agile niche players driving innovation. Key companies like Arla Foods amba, Richmond Enterprises Holdings Limited (Bodiez Protein Water), Vyomax Nutrition Limited, Molecule Beverages Ltd, and Miami Bay Beverage LLC (Trimino) are actively shaping the market. The report delves into innovation drivers, emphasizing the demand for healthier, convenient, and performance-enhancing beverages. Regulatory impacts, particularly concerning labeling and health claims, are assessed for their influence on market entry and product development. Potential product substitutes, such as RTD protein shakes and powdered supplements, are analyzed for their competitive threat. End-user segmentation reveals distinct consumer needs, from athletes seeking muscle recovery to health-conscious individuals prioritizing convenient protein intake. Merger and acquisition (M&A) trends are examined, with an estimated volume of Ten Million transactions anticipated in the coming years, signaling ongoing consolidation and strategic partnerships. Concentration ratios for the top players indicate a landscape where strategic agility and product differentiation are paramount.
Protein Water Industry Market Trends & Opportunities
The protein water market is poised for substantial growth, driven by an escalating consumer focus on health and wellness. The market size is projected to reach One Hundred Million by the end of the forecast period, expanding at a robust Compound Annual Growth Rate (CAGR) of 15% from 2025 to 2033. Technological shifts are enabling the development of more palatable and stable protein formulations, enhancing consumer experience. Consumer preferences are increasingly leaning towards low-sugar, low-calorie, and plant-based protein options, creating significant opportunities for brands catering to these demands. The competitive dynamics are characterized by intense product innovation, strategic marketing campaigns, and expanding distribution networks. Market penetration rates are expected to surge as protein water transitions from a niche product to a mainstream functional beverage. The rise of online channels and direct-to-consumer (DTC) models is further accelerating market reach and consumer engagement. Emerging trends include the incorporation of additional functional ingredients like vitamins and probiotics, and the development of specialized protein waters for specific dietary needs.
Dominant Markets & Segments in Protein Water Industry
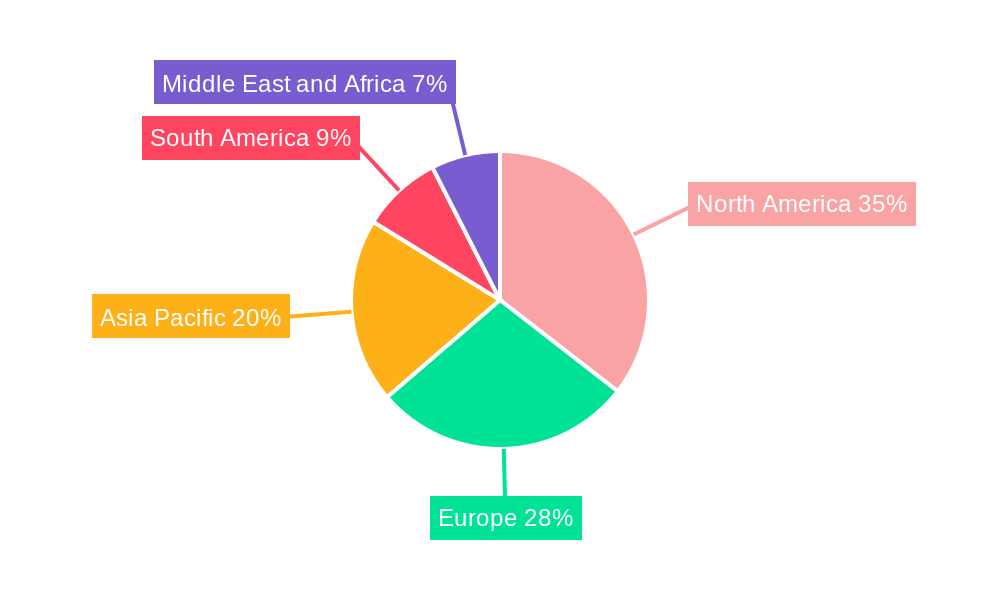
The global protein water market is experiencing significant growth across various regions and segments. North America currently holds a dominant position, driven by a well-established health and fitness culture and high disposable incomes. Within North America, the United States leads in market share, fueled by widespread consumer adoption of functional beverages.
- Type: The Flavored protein water segment is the most dominant, accounting for an estimated 60% of the market share. Consumers are actively seeking convenient and palatable ways to increase protein intake, making the appeal of diverse and refreshing flavors a key growth driver. Unflavored variants cater to a more niche but growing segment of consumers who prefer to customize their beverages or avoid artificial additives.
- Distribution Channel: Supermarkets/Hypermarkets currently lead in terms of distribution, offering broad accessibility and impulse purchase opportunities. However, Online Channels are rapidly gaining traction, projected to capture 35% of the market by the end of the forecast period. This growth is attributed to the convenience, wider product selection, and direct-to-consumer engagement offered by e-commerce platforms. Convenience Stores also play a crucial role in impulse buys and on-the-go consumption.
Key growth drivers in dominant regions include supportive government policies promoting healthy lifestyles, increasing investment in R&D for innovative product development, and expanding retail infrastructure. Market dominance is further reinforced by strong brand recognition, effective marketing strategies targeting health-conscious demographics, and the strategic placement of products in high-traffic retail locations and online marketplaces.
Protein Water Industry Product Analysis
Product innovations in the protein water industry are central to its growth. Manufacturers are focusing on developing clear protein water formulations with improved taste profiles and enhanced stability. Competitive advantages are being built through the introduction of vegan protein water options, catering to a growing plant-based consumer base, and the incorporation of zero-sugar and low-calorie attributes. Technological advancements in protein extraction and filtration are crucial for creating palatable, transparent, and easily digestible products. The market fit is strengthened by products that align with evolving consumer demands for functional beverages that support active lifestyles and general well-being.
Key Drivers, Barriers & Challenges in Protein Water Industry
Key Drivers: The protein water market is propelled by increasing consumer awareness of the health benefits of protein, the rising popularity of fitness and active lifestyles, and a growing demand for convenient, on-the-go nutrition solutions. Technological advancements in protein processing and flavor masking are making protein water more appealing. The global shift towards healthier beverage choices, including low-calorie and sugar-free options, further fuels market expansion.
Barriers & Challenges: Significant challenges include the high cost of protein sourcing and processing, which can lead to premium pricing that limits accessibility for some consumers. Regulatory hurdles related to health claims and labeling can also pose complexities. Intense competition from established beverage categories and other protein supplement markets, alongside potential supply chain disruptions for key ingredients, also presents obstacles. Educating consumers about the distinct benefits of protein water compared to other protein sources remains an ongoing challenge.
Growth Drivers in the Protein Water Industry Market
Key growth drivers for the protein water industry are multifaceted. Technologically, advancements in whey protein isolate and plant-based protein extraction are leading to cleaner, more palatable products. Economically, rising disposable incomes globally and increasing consumer spending on health and wellness products are significant catalysts. Policy-driven factors, such as government initiatives promoting healthy eating and active living, indirectly support market expansion. Furthermore, the growing trend of personalized nutrition and the demand for functional beverages that offer specific health benefits are creating substantial opportunities. The expansion of e-commerce and direct-to-consumer sales models is also a critical growth driver, increasing market reach and accessibility.
Challenges Impacting Protein Water Industry Growth
Challenges impacting the protein water industry growth include the perceived high cost of protein-infused beverages compared to traditional water or juices, which can act as a restraint for price-sensitive consumers. Regulatory complexities surrounding health claims and nutritional labeling across different regions necessitate careful compliance. Supply chain issues related to the sourcing of high-quality protein ingredients, particularly specialized plant-based proteins, can lead to volatility in availability and cost. Competitive pressures from established protein shake brands and other functional beverage categories require continuous innovation and effective marketing to differentiate protein water. Consumer education on the unique benefits and optimal consumption occasions for protein water also remains a challenge.
Key Players Shaping the Protein Water Industry Market
- Arla Foods amba
- Richmond Enterprises Holdings Limited (Bodiez Protein Water)
- Vyomax Nutrition Limited
- Molecule Beverages Ltd
- Miami Bay Beverage LLC (Trimino)
- Aquatein
- Fizzique LLC
- Protein2o Inc
- Agropur Inc (BiPro USA)
- Glanbia PLC (Optimum Nutrition Inc)
Significant Protein Water Industry Industry Milestones
- July 2022: Mumbai-based Aquatein (Athlex Beverages Private Limited), India's first protein water brand, launched three new products, strategically expanding its offline presence to 1200 direct points of sales and planning international expansion into the Middle East and North Africa (MENA) region.
- April 2022: The United Kingdom's flavored protein water brand, Vieve, introduced a new range of vegan protein waters in Wild Cherry and Peach & Orange flavors, offering 10g of protein, zero sugar, and 50 calories per bottle.
- August 2021: All Market Inc., the parent company of Vita Coco, launched PWR LIFT, a new line of zero-sugar flavored protein waters containing 10g of whey protein and 50 calories per 16.9 oz PET bottle across four distinct flavors.
Future Outlook for Protein Water Industry Market
The future outlook for the protein water market is exceptionally bright, driven by sustained consumer demand for healthier and more convenient beverage options. Strategic opportunities lie in expanding product lines to cater to diverse dietary needs, including specialized formulations for athletes, seniors, and those with specific health goals. The increasing penetration of online retail and the growing adoption of direct-to-consumer models will facilitate wider market reach and personalized engagement. Continued investment in research and development for novel protein sources and enhanced flavor profiles will be critical for maintaining a competitive edge. The global expansion into emerging markets, coupled with innovative marketing strategies that highlight the unique benefits of protein water, will further propel market growth, solidifying its position as a key player in the functional beverage landscape.
Protein Water Industry Segmentation
-
1. Type
- 1.1. Flavored
- 1.2. Unflavored
-
2. Distribution Channel
- 2.1. Supermarkets/Hypermarkets
- 2.2. Convenience Stores
- 2.3. Online Channels
- 2.4. Others
Protein Water Industry Segmentation By Geography
-
1. North America
- 1.1. United States
- 1.2. Canada
- 1.3. Mexico
- 1.4. Rest of North America
-
2. Europe
- 2.1. Spain
- 2.2. United Kingdom
- 2.3. Germany
- 2.4. France
- 2.5. Italy
- 2.6. Russia
- 2.7. Rest of Europe
-
3. Asia Pacific
- 3.1. China
- 3.2. Japan
- 3.3. India
- 3.4. Australia
- 3.5. Rest of Asia Pacific
-
4. South America
- 4.1. Brazil
- 4.2. Argentina
- 4.3. Rest of South America
-
5. Middle East and Africa
- 5.1. South Africa
- 5.2. Saudi Arabia
- 5.3. Rest of Middle East and Africa
Protein Water Industry Regional Market Share
Geographic Coverage of Protein Water Industry
Protein Water Industry REPORT HIGHLIGHTS
| Aspects | Details |
|---|---|
| Study Period | 2020-2034 |
| Base Year | 2025 |
| Estimated Year | 2026 |
| Forecast Period | 2026-2034 |
| Historical Period | 2020-2025 |
| Growth Rate | CAGR of 5.50% from 2020-2034 |
| Segmentation |
|
Table of Contents
- 1. Introduction
- 1.1. Research Scope
- 1.2. Market Segmentation
- 1.3. Research Objective
- 1.4. Definitions and Assumptions
- 2. Executive Summary
- 2.1. Market Snapshot
- 3. Market Dynamics
- 3.1. Market Drivers
- 3.2. Market Restrains
- 3.3. Market Trends
- 3.4. Market Opportunities
- 4. Market Factor Analysis
- 4.1. Porters Five Forces
- 4.1.1. Bargaining Power of Suppliers
- 4.1.2. Bargaining Power of Buyers
- 4.1.3. Threat of New Entrants
- 4.1.4. Threat of Substitutes
- 4.1.5. Competitive Rivalry
- 4.2. PESTEL analysis
- 4.3. BCG Analysis
- 4.3.1. Stars (High Growth, High Market Share)
- 4.3.2. Cash Cows (Low Growth, High Market Share)
- 4.3.3. Question Mark (High Growth, Low Market Share)
- 4.3.4. Dogs (Low Growth, Low Market Share)
- 4.4. Ansoff Matrix Analysis
- 4.5. Supply Chain Analysis
- 4.6. Regulatory Landscape
- 4.7. Current Market Potential and Opportunity Assessment (TAM–SAM–SOM Framework)
- 4.8. TIR Analyst Note
- 4.1. Porters Five Forces
- 5. Market Analysis, Insights and Forecast 2021-2033
- 5.1. Market Analysis, Insights and Forecast - by Type
- 5.1.1. Flavored
- 5.1.2. Unflavored
- 5.2. Market Analysis, Insights and Forecast - by Distribution Channel
- 5.2.1. Supermarkets/Hypermarkets
- 5.2.2. Convenience Stores
- 5.2.3. Online Channels
- 5.2.4. Others
- 5.3. Market Analysis, Insights and Forecast - by Region
- 5.3.1. North America
- 5.3.2. Europe
- 5.3.3. Asia Pacific
- 5.3.4. South America
- 5.3.5. Middle East and Africa
- 5.1. Market Analysis, Insights and Forecast - by Type
- 6. Global Protein Water Industry Analysis, Insights and Forecast, 2021-2033
- 6.1. Market Analysis, Insights and Forecast - by Type
- 6.1.1. Flavored
- 6.1.2. Unflavored
- 6.2. Market Analysis, Insights and Forecast - by Distribution Channel
- 6.2.1. Supermarkets/Hypermarkets
- 6.2.2. Convenience Stores
- 6.2.3. Online Channels
- 6.2.4. Others
- 6.1. Market Analysis, Insights and Forecast - by Type
- 7. North America Protein Water Industry Analysis, Insights and Forecast, 2020-2032
- 7.1. Market Analysis, Insights and Forecast - by Type
- 7.1.1. Flavored
- 7.1.2. Unflavored
- 7.2. Market Analysis, Insights and Forecast - by Distribution Channel
- 7.2.1. Supermarkets/Hypermarkets
- 7.2.2. Convenience Stores
- 7.2.3. Online Channels
- 7.2.4. Others
- 7.1. Market Analysis, Insights and Forecast - by Type
- 8. Europe Protein Water Industry Analysis, Insights and Forecast, 2020-2032
- 8.1. Market Analysis, Insights and Forecast - by Type
- 8.1.1. Flavored
- 8.1.2. Unflavored
- 8.2. Market Analysis, Insights and Forecast - by Distribution Channel
- 8.2.1. Supermarkets/Hypermarkets
- 8.2.2. Convenience Stores
- 8.2.3. Online Channels
- 8.2.4. Others
- 8.1. Market Analysis, Insights and Forecast - by Type
- 9. Asia Pacific Protein Water Industry Analysis, Insights and Forecast, 2020-2032
- 9.1. Market Analysis, Insights and Forecast - by Type
- 9.1.1. Flavored
- 9.1.2. Unflavored
- 9.2. Market Analysis, Insights and Forecast - by Distribution Channel
- 9.2.1. Supermarkets/Hypermarkets
- 9.2.2. Convenience Stores
- 9.2.3. Online Channels
- 9.2.4. Others
- 9.1. Market Analysis, Insights and Forecast - by Type
- 10. South America Protein Water Industry Analysis, Insights and Forecast, 2020-2032
- 10.1. Market Analysis, Insights and Forecast - by Type
- 10.1.1. Flavored
- 10.1.2. Unflavored
- 10.2. Market Analysis, Insights and Forecast - by Distribution Channel
- 10.2.1. Supermarkets/Hypermarkets
- 10.2.2. Convenience Stores
- 10.2.3. Online Channels
- 10.2.4. Others
- 10.1. Market Analysis, Insights and Forecast - by Type
- 11. Middle East and Africa Protein Water Industry Analysis, Insights and Forecast, 2020-2032
- 11.1. Market Analysis, Insights and Forecast - by Type
- 11.1.1. Flavored
- 11.1.2. Unflavored
- 11.2. Market Analysis, Insights and Forecast - by Distribution Channel
- 11.2.1. Supermarkets/Hypermarkets
- 11.2.2. Convenience Stores
- 11.2.3. Online Channels
- 11.2.4. Others
- 11.1. Market Analysis, Insights and Forecast - by Type
- 12. Competitive Analysis
- 12.1. Company Profiles
- 12.1.1 Arla Foods amba
- 12.1.1.1. Company Overview
- 12.1.1.2. Products
- 12.1.1.3. Company Financials
- 12.1.1.4. SWOT Analysis
- 12.1.2 Richmond Enterprises Holdings Limited (Bodiez Protein Water)
- 12.1.2.1. Company Overview
- 12.1.2.2. Products
- 12.1.2.3. Company Financials
- 12.1.2.4. SWOT Analysis
- 12.1.3 Vyomax Nutrition Limited
- 12.1.3.1. Company Overview
- 12.1.3.2. Products
- 12.1.3.3. Company Financials
- 12.1.3.4. SWOT Analysis
- 12.1.4 Molecule Beverages Ltd
- 12.1.4.1. Company Overview
- 12.1.4.2. Products
- 12.1.4.3. Company Financials
- 12.1.4.4. SWOT Analysis
- 12.1.5 Miami Bay Beverage LLC (Trimino)*List Not Exhaustive
- 12.1.5.1. Company Overview
- 12.1.5.2. Products
- 12.1.5.3. Company Financials
- 12.1.5.4. SWOT Analysis
- 12.1.6 Aquatein
- 12.1.6.1. Company Overview
- 12.1.6.2. Products
- 12.1.6.3. Company Financials
- 12.1.6.4. SWOT Analysis
- 12.1.7 Fizzique LLC
- 12.1.7.1. Company Overview
- 12.1.7.2. Products
- 12.1.7.3. Company Financials
- 12.1.7.4. SWOT Analysis
- 12.1.8 Protein2o Inc
- 12.1.8.1. Company Overview
- 12.1.8.2. Products
- 12.1.8.3. Company Financials
- 12.1.8.4. SWOT Analysis
- 12.1.9 Agropur Inc (BiPro USA)
- 12.1.9.1. Company Overview
- 12.1.9.2. Products
- 12.1.9.3. Company Financials
- 12.1.9.4. SWOT Analysis
- 12.1.10 Glanbia PLC (Optimum Nutrition Inc )
- 12.1.10.1. Company Overview
- 12.1.10.2. Products
- 12.1.10.3. Company Financials
- 12.1.10.4. SWOT Analysis
- 12.1.1 Arla Foods amba
- 12.2. Market Entropy
- 12.2.1 Company's Key Areas Served
- 12.2.2 Recent Developments
- 12.3. Company Market Share Analysis 2025
- 12.3.1 Top 5 Companies Market Share Analysis
- 12.3.2 Top 3 Companies Market Share Analysis
- 12.4. List of Potential Customers
- 13. Research Methodology
List of Figures
- Figure 1: Global Protein Water Industry Revenue Breakdown (Million, %) by Region 2025 & 2033
- Figure 2: Global Protein Water Industry Volume Breakdown (liter , %) by Region 2025 & 2033
- Figure 3: North America Protein Water Industry Revenue (Million), by Type 2025 & 2033
- Figure 4: North America Protein Water Industry Volume (liter ), by Type 2025 & 2033
- Figure 5: North America Protein Water Industry Revenue Share (%), by Type 2025 & 2033
- Figure 6: North America Protein Water Industry Volume Share (%), by Type 2025 & 2033
- Figure 7: North America Protein Water Industry Revenue (Million), by Distribution Channel 2025 & 2033
- Figure 8: North America Protein Water Industry Volume (liter ), by Distribution Channel 2025 & 2033
- Figure 9: North America Protein Water Industry Revenue Share (%), by Distribution Channel 2025 & 2033
- Figure 10: North America Protein Water Industry Volume Share (%), by Distribution Channel 2025 & 2033
- Figure 11: North America Protein Water Industry Revenue (Million), by Country 2025 & 2033
- Figure 12: North America Protein Water Industry Volume (liter ), by Country 2025 & 2033
- Figure 13: North America Protein Water Industry Revenue Share (%), by Country 2025 & 2033
- Figure 14: North America Protein Water Industry Volume Share (%), by Country 2025 & 2033
- Figure 15: Europe Protein Water Industry Revenue (Million), by Type 2025 & 2033
- Figure 16: Europe Protein Water Industry Volume (liter ), by Type 2025 & 2033
- Figure 17: Europe Protein Water Industry Revenue Share (%), by Type 2025 & 2033
- Figure 18: Europe Protein Water Industry Volume Share (%), by Type 2025 & 2033
- Figure 19: Europe Protein Water Industry Revenue (Million), by Distribution Channel 2025 & 2033
- Figure 20: Europe Protein Water Industry Volume (liter ), by Distribution Channel 2025 & 2033
- Figure 21: Europe Protein Water Industry Revenue Share (%), by Distribution Channel 2025 & 2033
- Figure 22: Europe Protein Water Industry Volume Share (%), by Distribution Channel 2025 & 2033
- Figure 23: Europe Protein Water Industry Revenue (Million), by Country 2025 & 2033
- Figure 24: Europe Protein Water Industry Volume (liter ), by Country 2025 & 2033
- Figure 25: Europe Protein Water Industry Revenue Share (%), by Country 2025 & 2033
- Figure 26: Europe Protein Water Industry Volume Share (%), by Country 2025 & 2033
- Figure 27: Asia Pacific Protein Water Industry Revenue (Million), by Type 2025 & 2033
- Figure 28: Asia Pacific Protein Water Industry Volume (liter ), by Type 2025 & 2033
- Figure 29: Asia Pacific Protein Water Industry Revenue Share (%), by Type 2025 & 2033
- Figure 30: Asia Pacific Protein Water Industry Volume Share (%), by Type 2025 & 2033
- Figure 31: Asia Pacific Protein Water Industry Revenue (Million), by Distribution Channel 2025 & 2033
- Figure 32: Asia Pacific Protein Water Industry Volume (liter ), by Distribution Channel 2025 & 2033
- Figure 33: Asia Pacific Protein Water Industry Revenue Share (%), by Distribution Channel 2025 & 2033
- Figure 34: Asia Pacific Protein Water Industry Volume Share (%), by Distribution Channel 2025 & 2033
- Figure 35: Asia Pacific Protein Water Industry Revenue (Million), by Country 2025 & 2033
- Figure 36: Asia Pacific Protein Water Industry Volume (liter ), by Country 2025 & 2033
- Figure 37: Asia Pacific Protein Water Industry Revenue Share (%), by Country 2025 & 2033
- Figure 38: Asia Pacific Protein Water Industry Volume Share (%), by Country 2025 & 2033
- Figure 39: South America Protein Water Industry Revenue (Million), by Type 2025 & 2033
- Figure 40: South America Protein Water Industry Volume (liter ), by Type 2025 & 2033
- Figure 41: South America Protein Water Industry Revenue Share (%), by Type 2025 & 2033
- Figure 42: South America Protein Water Industry Volume Share (%), by Type 2025 & 2033
- Figure 43: South America Protein Water Industry Revenue (Million), by Distribution Channel 2025 & 2033
- Figure 44: South America Protein Water Industry Volume (liter ), by Distribution Channel 2025 & 2033
- Figure 45: South America Protein Water Industry Revenue Share (%), by Distribution Channel 2025 & 2033
- Figure 46: South America Protein Water Industry Volume Share (%), by Distribution Channel 2025 & 2033
- Figure 47: South America Protein Water Industry Revenue (Million), by Country 2025 & 2033
- Figure 48: South America Protein Water Industry Volume (liter ), by Country 2025 & 2033
- Figure 49: South America Protein Water Industry Revenue Share (%), by Country 2025 & 2033
- Figure 50: South America Protein Water Industry Volume Share (%), by Country 2025 & 2033
- Figure 51: Middle East and Africa Protein Water Industry Revenue (Million), by Type 2025 & 2033
- Figure 52: Middle East and Africa Protein Water Industry Volume (liter ), by Type 2025 & 2033
- Figure 53: Middle East and Africa Protein Water Industry Revenue Share (%), by Type 2025 & 2033
- Figure 54: Middle East and Africa Protein Water Industry Volume Share (%), by Type 2025 & 2033
- Figure 55: Middle East and Africa Protein Water Industry Revenue (Million), by Distribution Channel 2025 & 2033
- Figure 56: Middle East and Africa Protein Water Industry Volume (liter ), by Distribution Channel 2025 & 2033
- Figure 57: Middle East and Africa Protein Water Industry Revenue Share (%), by Distribution Channel 2025 & 2033
- Figure 58: Middle East and Africa Protein Water Industry Volume Share (%), by Distribution Channel 2025 & 2033
- Figure 59: Middle East and Africa Protein Water Industry Revenue (Million), by Country 2025 & 2033
- Figure 60: Middle East and Africa Protein Water Industry Volume (liter ), by Country 2025 & 2033
- Figure 61: Middle East and Africa Protein Water Industry Revenue Share (%), by Country 2025 & 2033
- Figure 62: Middle East and Africa Protein Water Industry Volume Share (%), by Country 2025 & 2033
List of Tables
- Table 1: Global Protein Water Industry Revenue Million Forecast, by Type 2020 & 2033
- Table 2: Global Protein Water Industry Volume liter Forecast, by Type 2020 & 2033
- Table 3: Global Protein Water Industry Revenue Million Forecast, by Distribution Channel 2020 & 2033
- Table 4: Global Protein Water Industry Volume liter Forecast, by Distribution Channel 2020 & 2033
- Table 5: Global Protein Water Industry Revenue Million Forecast, by Region 2020 & 2033
- Table 6: Global Protein Water Industry Volume liter Forecast, by Region 2020 & 2033
- Table 7: Global Protein Water Industry Revenue Million Forecast, by Type 2020 & 2033
- Table 8: Global Protein Water Industry Volume liter Forecast, by Type 2020 & 2033
- Table 9: Global Protein Water Industry Revenue Million Forecast, by Distribution Channel 2020 & 2033
- Table 10: Global Protein Water Industry Volume liter Forecast, by Distribution Channel 2020 & 2033
- Table 11: Global Protein Water Industry Revenue Million Forecast, by Country 2020 & 2033
- Table 12: Global Protein Water Industry Volume liter Forecast, by Country 2020 & 2033
- Table 13: United States Protein Water Industry Revenue (Million) Forecast, by Application 2020 & 2033
- Table 14: United States Protein Water Industry Volume (liter ) Forecast, by Application 2020 & 2033
- Table 15: Canada Protein Water Industry Revenue (Million) Forecast, by Application 2020 & 2033
- Table 16: Canada Protein Water Industry Volume (liter ) Forecast, by Application 2020 & 2033
- Table 17: Mexico Protein Water Industry Revenue (Million) Forecast, by Application 2020 & 2033
- Table 18: Mexico Protein Water Industry Volume (liter ) Forecast, by Application 2020 & 2033
- Table 19: Rest of North America Protein Water Industry Revenue (Million) Forecast, by Application 2020 & 2033
- Table 20: Rest of North America Protein Water Industry Volume (liter ) Forecast, by Application 2020 & 2033
- Table 21: Global Protein Water Industry Revenue Million Forecast, by Type 2020 & 2033
- Table 22: Global Protein Water Industry Volume liter Forecast, by Type 2020 & 2033
- Table 23: Global Protein Water Industry Revenue Million Forecast, by Distribution Channel 2020 & 2033
- Table 24: Global Protein Water Industry Volume liter Forecast, by Distribution Channel 2020 & 2033
- Table 25: Global Protein Water Industry Revenue Million Forecast, by Country 2020 & 2033
- Table 26: Global Protein Water Industry Volume liter Forecast, by Country 2020 & 2033
- Table 27: Spain Protein Water Industry Revenue (Million) Forecast, by Application 2020 & 2033
- Table 28: Spain Protein Water Industry Volume (liter ) Forecast, by Application 2020 & 2033
- Table 29: United Kingdom Protein Water Industry Revenue (Million) Forecast, by Application 2020 & 2033
- Table 30: United Kingdom Protein Water Industry Volume (liter ) Forecast, by Application 2020 & 2033
- Table 31: Germany Protein Water Industry Revenue (Million) Forecast, by Application 2020 & 2033
- Table 32: Germany Protein Water Industry Volume (liter ) Forecast, by Application 2020 & 2033
- Table 33: France Protein Water Industry Revenue (Million) Forecast, by Application 2020 & 2033
- Table 34: France Protein Water Industry Volume (liter ) Forecast, by Application 2020 & 2033
- Table 35: Italy Protein Water Industry Revenue (Million) Forecast, by Application 2020 & 2033
- Table 36: Italy Protein Water Industry Volume (liter ) Forecast, by Application 2020 & 2033
- Table 37: Russia Protein Water Industry Revenue (Million) Forecast, by Application 2020 & 2033
- Table 38: Russia Protein Water Industry Volume (liter ) Forecast, by Application 2020 & 2033
- Table 39: Rest of Europe Protein Water Industry Revenue (Million) Forecast, by Application 2020 & 2033
- Table 40: Rest of Europe Protein Water Industry Volume (liter ) Forecast, by Application 2020 & 2033
- Table 41: Global Protein Water Industry Revenue Million Forecast, by Type 2020 & 2033
- Table 42: Global Protein Water Industry Volume liter Forecast, by Type 2020 & 2033
- Table 43: Global Protein Water Industry Revenue Million Forecast, by Distribution Channel 2020 & 2033
- Table 44: Global Protein Water Industry Volume liter Forecast, by Distribution Channel 2020 & 2033
- Table 45: Global Protein Water Industry Revenue Million Forecast, by Country 2020 & 2033
- Table 46: Global Protein Water Industry Volume liter Forecast, by Country 2020 & 2033
- Table 47: China Protein Water Industry Revenue (Million) Forecast, by Application 2020 & 2033
- Table 48: China Protein Water Industry Volume (liter ) Forecast, by Application 2020 & 2033
- Table 49: Japan Protein Water Industry Revenue (Million) Forecast, by Application 2020 & 2033
- Table 50: Japan Protein Water Industry Volume (liter ) Forecast, by Application 2020 & 2033
- Table 51: India Protein Water Industry Revenue (Million) Forecast, by Application 2020 & 2033
- Table 52: India Protein Water Industry Volume (liter ) Forecast, by Application 2020 & 2033
- Table 53: Australia Protein Water Industry Revenue (Million) Forecast, by Application 2020 & 2033
- Table 54: Australia Protein Water Industry Volume (liter ) Forecast, by Application 2020 & 2033
- Table 55: Rest of Asia Pacific Protein Water Industry Revenue (Million) Forecast, by Application 2020 & 2033
- Table 56: Rest of Asia Pacific Protein Water Industry Volume (liter ) Forecast, by Application 2020 & 2033
- Table 57: Global Protein Water Industry Revenue Million Forecast, by Type 2020 & 2033
- Table 58: Global Protein Water Industry Volume liter Forecast, by Type 2020 & 2033
- Table 59: Global Protein Water Industry Revenue Million Forecast, by Distribution Channel 2020 & 2033
- Table 60: Global Protein Water Industry Volume liter Forecast, by Distribution Channel 2020 & 2033
- Table 61: Global Protein Water Industry Revenue Million Forecast, by Country 2020 & 2033
- Table 62: Global Protein Water Industry Volume liter Forecast, by Country 2020 & 2033
- Table 63: Brazil Protein Water Industry Revenue (Million) Forecast, by Application 2020 & 2033
- Table 64: Brazil Protein Water Industry Volume (liter ) Forecast, by Application 2020 & 2033
- Table 65: Argentina Protein Water Industry Revenue (Million) Forecast, by Application 2020 & 2033
- Table 66: Argentina Protein Water Industry Volume (liter ) Forecast, by Application 2020 & 2033
- Table 67: Rest of South America Protein Water Industry Revenue (Million) Forecast, by Application 2020 & 2033
- Table 68: Rest of South America Protein Water Industry Volume (liter ) Forecast, by Application 2020 & 2033
- Table 69: Global Protein Water Industry Revenue Million Forecast, by Type 2020 & 2033
- Table 70: Global Protein Water Industry Volume liter Forecast, by Type 2020 & 2033
- Table 71: Global Protein Water Industry Revenue Million Forecast, by Distribution Channel 2020 & 2033
- Table 72: Global Protein Water Industry Volume liter Forecast, by Distribution Channel 2020 & 2033
- Table 73: Global Protein Water Industry Revenue Million Forecast, by Country 2020 & 2033
- Table 74: Global Protein Water Industry Volume liter Forecast, by Country 2020 & 2033
- Table 75: South Africa Protein Water Industry Revenue (Million) Forecast, by Application 2020 & 2033
- Table 76: South Africa Protein Water Industry Volume (liter ) Forecast, by Application 2020 & 2033
- Table 77: Saudi Arabia Protein Water Industry Revenue (Million) Forecast, by Application 2020 & 2033
- Table 78: Saudi Arabia Protein Water Industry Volume (liter ) Forecast, by Application 2020 & 2033
- Table 79: Rest of Middle East and Africa Protein Water Industry Revenue (Million) Forecast, by Application 2020 & 2033
- Table 80: Rest of Middle East and Africa Protein Water Industry Volume (liter ) Forecast, by Application 2020 & 2033
Frequently Asked Questions
1. What is the projected Compound Annual Growth Rate (CAGR) of the Protein Water Industry?
The projected CAGR is approximately 5.50%.
2. Which companies are prominent players in the Protein Water Industry?
Key companies in the market include Arla Foods amba, Richmond Enterprises Holdings Limited (Bodiez Protein Water), Vyomax Nutrition Limited, Molecule Beverages Ltd, Miami Bay Beverage LLC (Trimino)*List Not Exhaustive, Aquatein, Fizzique LLC, Protein2o Inc, Agropur Inc (BiPro USA), Glanbia PLC (Optimum Nutrition Inc ).
3. What are the main segments of the Protein Water Industry?
The market segments include Type, Distribution Channel.
4. Can you provide details about the market size?
The market size is estimated to be USD 1187.1 Million as of 2022.
5. What are some drivers contributing to market growth?
Increasing awareness towards fitness among consumers; Demand for convenient fortified foods.
6. What are the notable trends driving market growth?
Increased Participation in the Sports Activities.
7. Are there any restraints impacting market growth?
Increasing vegan culture in the market.
8. Can you provide examples of recent developments in the market?
In July 2022, Mumbai-based Aquatein (Athlex Beverages Private Limited), India's first protein water brand launched three new products. Through its strategic offline partnerships, the brand is all set to roll out 1200 direct points of sales and also launch the brand internationally through strategic local partnerships in the Middle East and North Africa (MENA) region.
9. What pricing options are available for accessing the report?
Pricing options include single-user, multi-user, and enterprise licenses priced at USD 4750, USD 5250, and USD 8750 respectively.
10. Is the market size provided in terms of value or volume?
The market size is provided in terms of value, measured in Million and volume, measured in liter .
11. Are there any specific market keywords associated with the report?
Yes, the market keyword associated with the report is "Protein Water Industry," which aids in identifying and referencing the specific market segment covered.
12. How do I determine which pricing option suits my needs best?
The pricing options vary based on user requirements and access needs. Individual users may opt for single-user licenses, while businesses requiring broader access may choose multi-user or enterprise licenses for cost-effective access to the report.
13. Are there any additional resources or data provided in the Protein Water Industry report?
While the report offers comprehensive insights, it's advisable to review the specific contents or supplementary materials provided to ascertain if additional resources or data are available.
14. How can I stay updated on further developments or reports in the Protein Water Industry?
To stay informed about further developments, trends, and reports in the Protein Water Industry, consider subscribing to industry newsletters, following relevant companies and organizations, or regularly checking reputable industry news sources and publications.
Methodology
Step 1 - Identification of Relevant Samples Size from Population Database


Step 2 - Approaches for Defining Global Market Size (Value, Volume* & Price*)

Note*: In applicable scenarios
Step 3 - Data Sources
Primary Research
- Web Analytics
- Survey Reports
- Research Institute
- Latest Research Reports
- Opinion Leaders
Secondary Research
- Annual Reports
- White Paper
- Latest Press Release
- Industry Association
- Paid Database
- Investor Presentations

Step 4 - Data Triangulation
Involves using different sources of information in order to increase the validity of a study
These sources are likely to be stakeholders in a program - participants, other researchers, program staff, other community members, and so on.
Then we put all data in single framework & apply various statistical tools to find out the dynamic on the market.
During the analysis stage, feedback from the stakeholder groups would be compared to determine areas of agreement as well as areas of divergence