

Key Insights
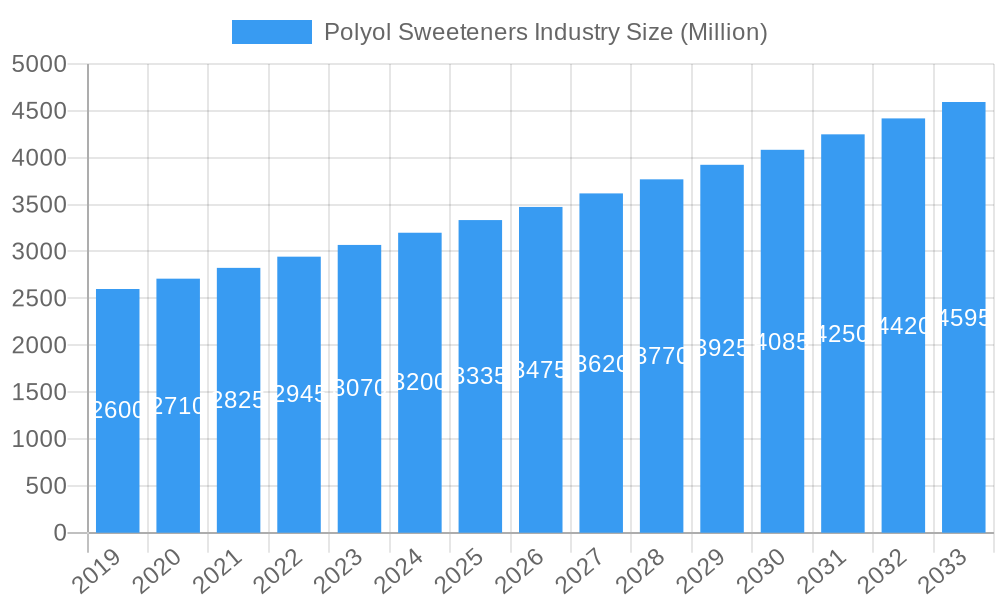
The global Polyol Sweeteners market is poised for robust expansion, projected to reach a significant valuation of USD 3500 million by 2025, with a healthy Compound Annual Growth Rate (CAGR) of 4.50% anticipated to continue through the forecast period of 2025-2033. This growth is primarily fueled by an escalating consumer demand for sugar-free and low-calorie alternatives across various industries. The food and beverage sector stands as the dominant application, driven by the increasing prevalence of health-conscious consumers seeking to manage weight, blood sugar levels, and dental health. Furthermore, the pharmaceutical industry's adoption of polyols as excipients and active ingredients in formulations, alongside their use in personal care products for moisturizing and texture enhancement, contributes significantly to market expansion. Key polyols such as Erythritol, Sorbitol, Maltitol, and Isomalt are witnessing widespread adoption due to their versatile properties, including reduced caloric content, non-cariogenic nature, and functional benefits. The market's upward trajectory is supported by technological advancements in production processes, leading to improved purity and cost-effectiveness, making these sweeteners more accessible to manufacturers.
Polyol Sweeteners Industry Market Size (In Billion)
However, the market is not without its challenges. Fluctuations in raw material prices, particularly for starches and sugars used in polyol production, can impact profit margins for manufacturers. Stringent regulatory approvals for new applications and evolving consumer perceptions regarding the long-term effects of some polyols can also pose hurdles. Nevertheless, the overarching trend towards healthier lifestyle choices and the continuous innovation in developing novel polyol-based solutions are expected to outweigh these restraints. Asia Pacific, driven by the burgeoning economies of China and India and a rapidly growing middle class with increasing disposable income, is emerging as a key growth region. North America and Europe, with their established health and wellness trends, continue to be significant markets. The competitive landscape features prominent global players like Cargill Inc., Ingredion Incorporated, and Roquette Frères, all actively engaged in research and development, strategic collaborations, and market expansion initiatives to capitalize on the growing demand for polyol sweeteners.
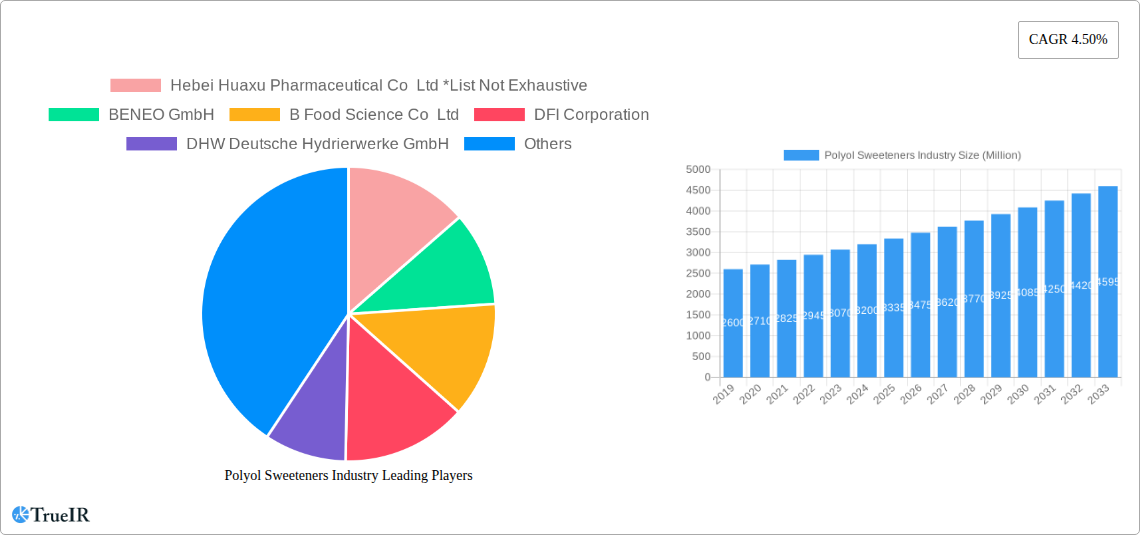
Polyol Sweeteners Industry Company Market Share
Unlock the Future of Sweeteners: The Definitive Polyol Sweeteners Industry Report
Gain unparalleled insights into the global Polyol Sweeteners market with this comprehensive, SEO-optimized report. Designed for industry leaders, market analysts, and strategic planners, this report delves deep into market dynamics, trends, opportunities, and competitive strategies shaping the future of sugar alternatives. Leveraging high-volume keywords like "polyol sweeteners," "sugar substitutes," "erythritol market," "sorbitol applications," "maltitol food," "pharmaceutical excipients," and "personal care ingredients," this report will significantly enhance your search visibility and engagement.
Study Period: 2019–2033 | Base Year: 2025 | Estimated Year: 2025 | Forecast Period: 2025–2033 | Historical Period: 2019–2024
Polyol Sweeteners Industry Market Structure & Competitive Landscape
The polyol sweeteners industry is characterized by a moderately concentrated market structure, with a blend of large multinational corporations and specialized regional players. Innovation drivers are primarily focused on developing novel polyols with enhanced taste profiles, improved digestive tolerance, and expanded functional properties for diverse applications. Regulatory frameworks, particularly concerning food safety and labeling of sugar-free products, significantly influence market entry and product development strategies. The threat of product substitutes, including high-intensity sweeteners and natural sweeteners, remains a key consideration, prompting continuous research into cost-effectiveness and consumer acceptance of polyols. End-user segmentation reveals a strong reliance on the food and beverage sector, followed by pharmaceuticals and personal care. Mergers and acquisitions (M&A) are observed as companies seek to expand their product portfolios, geographical reach, and technological capabilities. For instance, strategic partnerships and acquisitions aim to consolidate market share and leverage economies of scale. A notable M&A trend involves consolidation of raw material sourcing and production capacities to ensure supply chain stability and competitive pricing. The industry is witnessing increasing investment in R&D to discover new applications and optimize production processes, aiming for greater sustainability and reduced environmental impact.
Polyol Sweeteners Industry Market Trends & Opportunities
The global polyol sweeteners market is on an upward trajectory, projected to experience robust growth driven by escalating consumer demand for healthier food and beverage options. With a projected Compound Annual Growth Rate (CAGR) of approximately XX% from 2025 to 2033, the market size is anticipated to reach over XX Million by 2033, a significant leap from its estimated value of XX Million in 2025. This expansion is fueled by the growing global health consciousness, characterized by an increasing prevalence of lifestyle diseases like diabetes and obesity, compelling consumers to seek low-calorie and sugar-free alternatives. Technological advancements play a pivotal role, with ongoing research and development focusing on enhancing the taste, texture, and digestive compatibility of polyols, thereby bridging the gap between natural sugars and their healthier substitutes. Innovations in fermentation and enzymatic conversion processes are leading to more sustainable and cost-effective production methods, making polyols more accessible. Consumer preferences are rapidly shifting towards ingredients perceived as "natural" and "clean label," presenting an opportunity for polyols derived from renewable resources and produced through environmentally friendly processes. The competitive landscape is evolving, with established players investing heavily in expanding their production capacities and geographical presence to cater to the burgeoning demand in emerging economies. Strategic collaborations and partnerships are becoming more prevalent as companies aim to leverage each other's expertise in R&D, distribution, and market penetration. The pharmaceutical industry's increasing utilization of polyols as excipients for drug formulation, particularly in chewable tablets and liquid suspensions, further bolsters market growth. Similarly, the personal care sector is incorporating polyols for their humectant and moisturizing properties in skincare and oral care products, opening new avenues for market expansion. The growing popularity of keto and low-carbohydrate diets also significantly contributes to the demand for sugar alcohols, as they are often used as bulk sweeteners with minimal impact on blood sugar levels. Furthermore, the development of polyol blends with synergistic properties offers opportunities to create customized sweetness solutions for a wider range of food and beverage applications, including confectionery, dairy products, and baked goods. The report will also explore opportunities arising from stricter governmental regulations on sugar content in food products, encouraging manufacturers to reformulate their offerings with reduced sugar and consequently increased polyol usage.
Dominant Markets & Segments in Polyol Sweeteners Industry
The Food and Beverages segment continues to dominate the polyol sweeteners industry, accounting for over XX% of the global market share in 2025. This supremacy is driven by the widespread adoption of polyols as sugar substitutes in a vast array of products, including sugar-free confectionery, diet beverages, baked goods, dairy products, and processed foods. The increasing consumer awareness regarding the health implications of excessive sugar consumption, coupled with the growing prevalence of diabetes and obesity, has significantly boosted the demand for low-calorie and non-cariogenic sweeteners like polyols.
- Erythritol: This type of polyol is witnessing substantial growth due to its zero-calorie profile, excellent digestive tolerance, and clean taste. Its application in sugar-free candies, chewing gum, and beverages is particularly prominent.
- Sorbitol: A versatile polyol, sorbitol finds extensive use as a humectant, texturizer, and sweetener in food products, pharmaceuticals, and personal care items. Its high production volume and cost-effectiveness contribute to its market leadership.
- Maltitol: Offering a taste profile similar to sucrose with about half the calories, maltitol is a popular choice for sugar-free chocolates, baked goods, and ice cream. Its good heat stability makes it suitable for a variety of food processing applications.
- Isomalt: Known for its low hygroscopicity and excellent thermal stability, isomalt is favored in confectionery for creating hard candies, lollipops, and decorative elements that maintain their shape and texture.
Geographically, North America and Europe currently represent the largest markets for polyol sweeteners, driven by established health consciousness, stringent regulations on sugar content, and a well-developed food and beverage industry. However, the Asia-Pacific region is emerging as a high-growth market due to rapid urbanization, rising disposable incomes, increasing health awareness, and a growing preference for healthier food options. Government initiatives promoting healthier lifestyles and investments in food processing infrastructure further contribute to the region's dominance potential. Key growth drivers in the Asia-Pacific region include:
- Infrastructure Development: Improved cold chain logistics and food processing facilities facilitate wider distribution and adoption of polyol-sweetened products.
- Government Policies: Stricter regulations on sugar content and promotion of health and wellness initiatives are encouraging manufacturers to reformulate products.
- Consumer Preferences: A rising middle class with increasing disposable income is opting for healthier food choices, driving demand for sugar alternatives.
The Pharmaceuticals segment, while smaller than food and beverages, is a significant growth area, with polyols widely used as excipients for their bulking, binding, and humectant properties in tablets, capsules, and liquid formulations. The Personal Care segment is also expanding, with polyols incorporated into toothpaste, mouthwash, and skincare products for their moisturizing and texture-enhancing benefits.
Polyol Sweeteners Industry Product Analysis
The polyol sweeteners industry is characterized by continuous product innovation aimed at enhancing functionality, taste, and cost-effectiveness. Erythritol, with its zero-calorie and clean taste profile, is a prime example of a successful product innovation that has captured significant market share in the sugar-free segment. Sorbitol continues to evolve with improved purity and processing techniques, enhancing its utility as both a sweetener and a functional ingredient in pharmaceutical and food applications. Maltitol's development focuses on optimizing its crystallization properties for confectionery and baked goods, while isomalt's low hygroscopicity makes it ideal for decorative confectionery. The competitive advantage of these polyols lies in their ability to mimic the bulk and mouthfeel of sugar without contributing to caloric intake or dental caries, thus meeting growing consumer demands for healthier alternatives.
Key Drivers, Barriers & Challenges in Polyol Sweeteners Industry
Key Drivers:
- Growing Health Consciousness: Escalating awareness of obesity, diabetes, and dental caries is driving demand for low-calorie, sugar-free alternatives.
- Favorable Regulatory Landscape: Government initiatives promoting reduced sugar intake and clear labeling policies encourage polyol adoption.
- Technological Advancements: Innovations in production processes are improving cost-effectiveness and expanding application versatility.
- Expanding Applications: Polyols are finding new uses in pharmaceuticals (excipients) and personal care (humectants), diversifying revenue streams.
Barriers & Challenges:
- Cost Competitiveness: While improving, production costs for some polyols can still be higher compared to conventional sugars.
- Digestive Tolerance: Certain polyols can cause gastrointestinal discomfort in some individuals, posing a consumer perception challenge.
- Supply Chain Volatility: Fluctuations in raw material prices and availability can impact production costs and lead times.
- Competition from Alternatives: High-intensity sweeteners and natural sweeteners present ongoing competition, necessitating continuous innovation and differentiation.
- Consumer Perception & Labeling: Educating consumers about the benefits and safety of polyols, and navigating complex labeling regulations, can be challenging.
Growth Drivers in the Polyol Sweeteners Industry Market
The polyol sweeteners industry is propelled by a confluence of powerful drivers. Technological innovations in bio-fermentation and enzymatic conversion are leading to more efficient and sustainable production methods, reducing manufacturing costs and environmental impact. Economic factors such as rising disposable incomes in emerging economies are increasing consumer spending power, allowing for greater adoption of premium, healthier food options. Furthermore, policy-driven changes globally, including taxes on sugar-sweetened beverages and mandates for reduced sugar content in processed foods, are creating a compelling market shift towards polyols. For instance, the increasing focus on preventative healthcare and wellness initiatives further amplifies the demand for sugar alternatives.
Challenges Impacting Polyol Sweeteners Industry Growth
Despite its promising trajectory, the polyol sweeteners industry faces several significant challenges. Regulatory complexities related to food additive approvals and labeling standards across different regions can hinder market expansion. Supply chain disruptions, exacerbated by geopolitical events and climate-related factors affecting raw material availability and pricing, pose a considerable risk to production stability and cost control. Intense competitive pressures from other sugar substitutes, including natural sweeteners and artificial sweeteners, necessitate continuous product differentiation and aggressive marketing strategies. Moreover, consumer education and perception regarding the safety and benefits of polyols, especially concerning potential gastrointestinal effects, require ongoing efforts to build trust and acceptance.
Key Players Shaping the Polyol Sweeteners Industry Market
- Hebei Huaxu Pharmaceutical Co Ltd
- BENEO GmbH
- B Food Science Co Ltd
- DFI Corporation
- DHW Deutsche Hydrierwerke GmbH
- Dupont Nutrition & Health (Danisco)
- Archer Daniels Midland Company
- Roquette Frères
- Cargill Inc
- Ingredion Incorporated
Significant Polyol Sweeteners Industry Industry Milestones
- March 2023: Archer Daniels Midland Company announced the launch of the Knwble Grwn brand to provide consumers with wholesome, plant-based food ingredients that are sustainably sourced.
- March 2022: Roquette invested EURO 25 million (USD 27.6 million) in liquid and powder sugar polyol to bolster its position in the polyol market at the site in Lestrem in North East France.
Future Outlook for Polyol Sweeteners Industry Market
The future outlook for the polyol sweeteners industry is exceptionally bright, fueled by sustained global demand for healthier food and beverage alternatives. Strategic opportunities lie in developing polyols with improved digestive tolerance, enhanced taste profiles, and expanded functional properties for niche applications. The growing trend towards plant-based diets and clean label ingredients presents a significant avenue for growth, particularly for polyols derived from renewable sources. Furthermore, continued investment in research and development, coupled with strategic partnerships and acquisitions, will be crucial for market players to maintain a competitive edge and capitalize on the immense market potential in both developed and emerging economies. The industry is poised for significant expansion as health consciousness continues to rise globally.
Polyol Sweeteners Industry Segmentation
-
1. Type
- 1.1. Erythritol
- 1.2. Sorbitol
- 1.3. Maltitol
- 1.4. Isomalt
- 1.5. Other Types
-
2. Application
- 2.1. Food and Beverages
- 2.2. Pharmaceuticals
- 2.3. Personal Care
Polyol Sweeteners Industry Segmentation By Geography
-
1. North America
- 1.1. United States
- 1.2. Canada
- 1.3. Mexico
- 1.4. Rest of North America
-
2. Europe
- 2.1. United Kingdom
- 2.2. Germany
- 2.3. France
- 2.4. Russia
- 2.5. Italy
- 2.6. Spain
- 2.7. Rest of Europe
-
3. Asia Pacific
- 3.1. India
- 3.2. China
- 3.3. Japan
- 3.4. Australia
- 3.5. Rest of Asia Pacific
-
4. South America
- 4.1. Brazil
- 4.2. Argentina
- 4.3. Rest of South America
- 5. Middle East
-
6. South Africa
- 6.1. Saudi Arabia
- 6.2. Rest of MEA
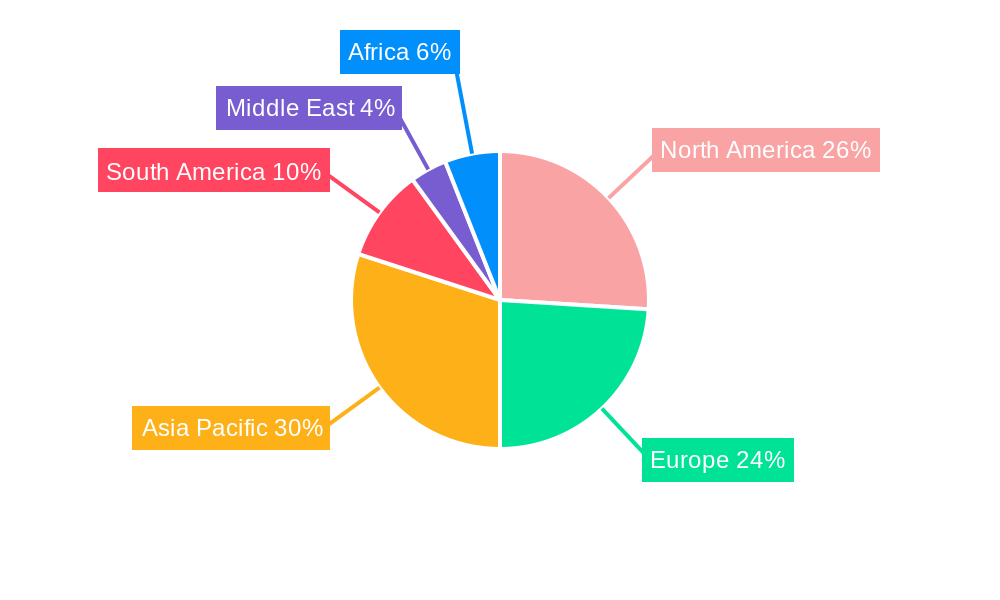
Polyol Sweeteners Industry Regional Market Share
Geographic Coverage of Polyol Sweeteners Industry
Polyol Sweeteners Industry REPORT HIGHLIGHTS
| Aspects | Details |
|---|---|
| Study Period | 2020-2034 |
| Base Year | 2025 |
| Estimated Year | 2026 |
| Forecast Period | 2026-2034 |
| Historical Period | 2020-2025 |
| Growth Rate | CAGR of 4.50% from 2020-2034 |
| Segmentation |
|
Table of Contents
- 1. Introduction
- 1.1. Research Scope
- 1.2. Market Segmentation
- 1.3. Research Methodology
- 1.4. Definitions and Assumptions
- 2. Executive Summary
- 2.1. Introduction
- 3. Market Dynamics
- 3.1. Introduction
- 3.2. Market Drivers
- 3.2.1. Increasing Demand for Organic Plant Proteins; Increasing Application of Pea Protein in Food and Beverages
- 3.3. Market Restrains
- 3.3.1. Presence of Alternative protein sources
- 3.4. Market Trends
- 3.4.1. Rising Preference Towards Low-Calorie Sweetener
- 4. Market Factor Analysis
- 4.1. Porters Five Forces
- 4.2. Supply/Value Chain
- 4.3. PESTEL analysis
- 4.4. Market Entropy
- 4.5. Patent/Trademark Analysis
- 5. Global Polyol Sweeteners Industry Analysis, Insights and Forecast, 2020-2032
- 5.1. Market Analysis, Insights and Forecast - by Type
- 5.1.1. Erythritol
- 5.1.2. Sorbitol
- 5.1.3. Maltitol
- 5.1.4. Isomalt
- 5.1.5. Other Types
- 5.2. Market Analysis, Insights and Forecast - by Application
- 5.2.1. Food and Beverages
- 5.2.2. Pharmaceuticals
- 5.2.3. Personal Care
- 5.3. Market Analysis, Insights and Forecast - by Region
- 5.3.1. North America
- 5.3.2. Europe
- 5.3.3. Asia Pacific
- 5.3.4. South America
- 5.3.5. Middle East
- 5.3.6. South Africa
- 5.1. Market Analysis, Insights and Forecast - by Type
- 6. North America Polyol Sweeteners Industry Analysis, Insights and Forecast, 2020-2032
- 6.1. Market Analysis, Insights and Forecast - by Type
- 6.1.1. Erythritol
- 6.1.2. Sorbitol
- 6.1.3. Maltitol
- 6.1.4. Isomalt
- 6.1.5. Other Types
- 6.2. Market Analysis, Insights and Forecast - by Application
- 6.2.1. Food and Beverages
- 6.2.2. Pharmaceuticals
- 6.2.3. Personal Care
- 6.1. Market Analysis, Insights and Forecast - by Type
- 7. Europe Polyol Sweeteners Industry Analysis, Insights and Forecast, 2020-2032
- 7.1. Market Analysis, Insights and Forecast - by Type
- 7.1.1. Erythritol
- 7.1.2. Sorbitol
- 7.1.3. Maltitol
- 7.1.4. Isomalt
- 7.1.5. Other Types
- 7.2. Market Analysis, Insights and Forecast - by Application
- 7.2.1. Food and Beverages
- 7.2.2. Pharmaceuticals
- 7.2.3. Personal Care
- 7.1. Market Analysis, Insights and Forecast - by Type
- 8. Asia Pacific Polyol Sweeteners Industry Analysis, Insights and Forecast, 2020-2032
- 8.1. Market Analysis, Insights and Forecast - by Type
- 8.1.1. Erythritol
- 8.1.2. Sorbitol
- 8.1.3. Maltitol
- 8.1.4. Isomalt
- 8.1.5. Other Types
- 8.2. Market Analysis, Insights and Forecast - by Application
- 8.2.1. Food and Beverages
- 8.2.2. Pharmaceuticals
- 8.2.3. Personal Care
- 8.1. Market Analysis, Insights and Forecast - by Type
- 9. South America Polyol Sweeteners Industry Analysis, Insights and Forecast, 2020-2032
- 9.1. Market Analysis, Insights and Forecast - by Type
- 9.1.1. Erythritol
- 9.1.2. Sorbitol
- 9.1.3. Maltitol
- 9.1.4. Isomalt
- 9.1.5. Other Types
- 9.2. Market Analysis, Insights and Forecast - by Application
- 9.2.1. Food and Beverages
- 9.2.2. Pharmaceuticals
- 9.2.3. Personal Care
- 9.1. Market Analysis, Insights and Forecast - by Type
- 10. Middle East Polyol Sweeteners Industry Analysis, Insights and Forecast, 2020-2032
- 10.1. Market Analysis, Insights and Forecast - by Type
- 10.1.1. Erythritol
- 10.1.2. Sorbitol
- 10.1.3. Maltitol
- 10.1.4. Isomalt
- 10.1.5. Other Types
- 10.2. Market Analysis, Insights and Forecast - by Application
- 10.2.1. Food and Beverages
- 10.2.2. Pharmaceuticals
- 10.2.3. Personal Care
- 10.1. Market Analysis, Insights and Forecast - by Type
- 11. South Africa Polyol Sweeteners Industry Analysis, Insights and Forecast, 2020-2032
- 11.1. Market Analysis, Insights and Forecast - by Type
- 11.1.1. Erythritol
- 11.1.2. Sorbitol
- 11.1.3. Maltitol
- 11.1.4. Isomalt
- 11.1.5. Other Types
- 11.2. Market Analysis, Insights and Forecast - by Application
- 11.2.1. Food and Beverages
- 11.2.2. Pharmaceuticals
- 11.2.3. Personal Care
- 11.1. Market Analysis, Insights and Forecast - by Type
- 12. Competitive Analysis
- 12.1. Global Market Share Analysis 2025
- 12.2. Company Profiles
- 12.2.1 Hebei Huaxu Pharmaceutical Co Ltd *List Not Exhaustive
- 12.2.1.1. Overview
- 12.2.1.2. Products
- 12.2.1.3. SWOT Analysis
- 12.2.1.4. Recent Developments
- 12.2.1.5. Financials (Based on Availability)
- 12.2.2 BENEO GmbH
- 12.2.2.1. Overview
- 12.2.2.2. Products
- 12.2.2.3. SWOT Analysis
- 12.2.2.4. Recent Developments
- 12.2.2.5. Financials (Based on Availability)
- 12.2.3 B Food Science Co Ltd
- 12.2.3.1. Overview
- 12.2.3.2. Products
- 12.2.3.3. SWOT Analysis
- 12.2.3.4. Recent Developments
- 12.2.3.5. Financials (Based on Availability)
- 12.2.4 DFI Corporation
- 12.2.4.1. Overview
- 12.2.4.2. Products
- 12.2.4.3. SWOT Analysis
- 12.2.4.4. Recent Developments
- 12.2.4.5. Financials (Based on Availability)
- 12.2.5 DHW Deutsche Hydrierwerke GmbH
- 12.2.5.1. Overview
- 12.2.5.2. Products
- 12.2.5.3. SWOT Analysis
- 12.2.5.4. Recent Developments
- 12.2.5.5. Financials (Based on Availability)
- 12.2.6 Dupont Nutrition & Health (Danisco)
- 12.2.6.1. Overview
- 12.2.6.2. Products
- 12.2.6.3. SWOT Analysis
- 12.2.6.4. Recent Developments
- 12.2.6.5. Financials (Based on Availability)
- 12.2.7 Archer Daniels Midland Company
- 12.2.7.1. Overview
- 12.2.7.2. Products
- 12.2.7.3. SWOT Analysis
- 12.2.7.4. Recent Developments
- 12.2.7.5. Financials (Based on Availability)
- 12.2.8 Roquette Frères
- 12.2.8.1. Overview
- 12.2.8.2. Products
- 12.2.8.3. SWOT Analysis
- 12.2.8.4. Recent Developments
- 12.2.8.5. Financials (Based on Availability)
- 12.2.9 Cargill Inc
- 12.2.9.1. Overview
- 12.2.9.2. Products
- 12.2.9.3. SWOT Analysis
- 12.2.9.4. Recent Developments
- 12.2.9.5. Financials (Based on Availability)
- 12.2.10 Ingredion Incorporated
- 12.2.10.1. Overview
- 12.2.10.2. Products
- 12.2.10.3. SWOT Analysis
- 12.2.10.4. Recent Developments
- 12.2.10.5. Financials (Based on Availability)
- 12.2.1 Hebei Huaxu Pharmaceutical Co Ltd *List Not Exhaustive
List of Figures
- Figure 1: Global Polyol Sweeteners Industry Revenue Breakdown (Million, %) by Region 2025 & 2033
- Figure 2: Global Polyol Sweeteners Industry Volume Breakdown (K Tons, %) by Region 2025 & 2033
- Figure 3: North America Polyol Sweeteners Industry Revenue (Million), by Type 2025 & 2033
- Figure 4: North America Polyol Sweeteners Industry Volume (K Tons), by Type 2025 & 2033
- Figure 5: North America Polyol Sweeteners Industry Revenue Share (%), by Type 2025 & 2033
- Figure 6: North America Polyol Sweeteners Industry Volume Share (%), by Type 2025 & 2033
- Figure 7: North America Polyol Sweeteners Industry Revenue (Million), by Application 2025 & 2033
- Figure 8: North America Polyol Sweeteners Industry Volume (K Tons), by Application 2025 & 2033
- Figure 9: North America Polyol Sweeteners Industry Revenue Share (%), by Application 2025 & 2033
- Figure 10: North America Polyol Sweeteners Industry Volume Share (%), by Application 2025 & 2033
- Figure 11: North America Polyol Sweeteners Industry Revenue (Million), by Country 2025 & 2033
- Figure 12: North America Polyol Sweeteners Industry Volume (K Tons), by Country 2025 & 2033
- Figure 13: North America Polyol Sweeteners Industry Revenue Share (%), by Country 2025 & 2033
- Figure 14: North America Polyol Sweeteners Industry Volume Share (%), by Country 2025 & 2033
- Figure 15: Europe Polyol Sweeteners Industry Revenue (Million), by Type 2025 & 2033
- Figure 16: Europe Polyol Sweeteners Industry Volume (K Tons), by Type 2025 & 2033
- Figure 17: Europe Polyol Sweeteners Industry Revenue Share (%), by Type 2025 & 2033
- Figure 18: Europe Polyol Sweeteners Industry Volume Share (%), by Type 2025 & 2033
- Figure 19: Europe Polyol Sweeteners Industry Revenue (Million), by Application 2025 & 2033
- Figure 20: Europe Polyol Sweeteners Industry Volume (K Tons), by Application 2025 & 2033
- Figure 21: Europe Polyol Sweeteners Industry Revenue Share (%), by Application 2025 & 2033
- Figure 22: Europe Polyol Sweeteners Industry Volume Share (%), by Application 2025 & 2033
- Figure 23: Europe Polyol Sweeteners Industry Revenue (Million), by Country 2025 & 2033
- Figure 24: Europe Polyol Sweeteners Industry Volume (K Tons), by Country 2025 & 2033
- Figure 25: Europe Polyol Sweeteners Industry Revenue Share (%), by Country 2025 & 2033
- Figure 26: Europe Polyol Sweeteners Industry Volume Share (%), by Country 2025 & 2033
- Figure 27: Asia Pacific Polyol Sweeteners Industry Revenue (Million), by Type 2025 & 2033
- Figure 28: Asia Pacific Polyol Sweeteners Industry Volume (K Tons), by Type 2025 & 2033
- Figure 29: Asia Pacific Polyol Sweeteners Industry Revenue Share (%), by Type 2025 & 2033
- Figure 30: Asia Pacific Polyol Sweeteners Industry Volume Share (%), by Type 2025 & 2033
- Figure 31: Asia Pacific Polyol Sweeteners Industry Revenue (Million), by Application 2025 & 2033
- Figure 32: Asia Pacific Polyol Sweeteners Industry Volume (K Tons), by Application 2025 & 2033
- Figure 33: Asia Pacific Polyol Sweeteners Industry Revenue Share (%), by Application 2025 & 2033
- Figure 34: Asia Pacific Polyol Sweeteners Industry Volume Share (%), by Application 2025 & 2033
- Figure 35: Asia Pacific Polyol Sweeteners Industry Revenue (Million), by Country 2025 & 2033
- Figure 36: Asia Pacific Polyol Sweeteners Industry Volume (K Tons), by Country 2025 & 2033
- Figure 37: Asia Pacific Polyol Sweeteners Industry Revenue Share (%), by Country 2025 & 2033
- Figure 38: Asia Pacific Polyol Sweeteners Industry Volume Share (%), by Country 2025 & 2033
- Figure 39: South America Polyol Sweeteners Industry Revenue (Million), by Type 2025 & 2033
- Figure 40: South America Polyol Sweeteners Industry Volume (K Tons), by Type 2025 & 2033
- Figure 41: South America Polyol Sweeteners Industry Revenue Share (%), by Type 2025 & 2033
- Figure 42: South America Polyol Sweeteners Industry Volume Share (%), by Type 2025 & 2033
- Figure 43: South America Polyol Sweeteners Industry Revenue (Million), by Application 2025 & 2033
- Figure 44: South America Polyol Sweeteners Industry Volume (K Tons), by Application 2025 & 2033
- Figure 45: South America Polyol Sweeteners Industry Revenue Share (%), by Application 2025 & 2033
- Figure 46: South America Polyol Sweeteners Industry Volume Share (%), by Application 2025 & 2033
- Figure 47: South America Polyol Sweeteners Industry Revenue (Million), by Country 2025 & 2033
- Figure 48: South America Polyol Sweeteners Industry Volume (K Tons), by Country 2025 & 2033
- Figure 49: South America Polyol Sweeteners Industry Revenue Share (%), by Country 2025 & 2033
- Figure 50: South America Polyol Sweeteners Industry Volume Share (%), by Country 2025 & 2033
- Figure 51: Middle East Polyol Sweeteners Industry Revenue (Million), by Type 2025 & 2033
- Figure 52: Middle East Polyol Sweeteners Industry Volume (K Tons), by Type 2025 & 2033
- Figure 53: Middle East Polyol Sweeteners Industry Revenue Share (%), by Type 2025 & 2033
- Figure 54: Middle East Polyol Sweeteners Industry Volume Share (%), by Type 2025 & 2033
- Figure 55: Middle East Polyol Sweeteners Industry Revenue (Million), by Application 2025 & 2033
- Figure 56: Middle East Polyol Sweeteners Industry Volume (K Tons), by Application 2025 & 2033
- Figure 57: Middle East Polyol Sweeteners Industry Revenue Share (%), by Application 2025 & 2033
- Figure 58: Middle East Polyol Sweeteners Industry Volume Share (%), by Application 2025 & 2033
- Figure 59: Middle East Polyol Sweeteners Industry Revenue (Million), by Country 2025 & 2033
- Figure 60: Middle East Polyol Sweeteners Industry Volume (K Tons), by Country 2025 & 2033
- Figure 61: Middle East Polyol Sweeteners Industry Revenue Share (%), by Country 2025 & 2033
- Figure 62: Middle East Polyol Sweeteners Industry Volume Share (%), by Country 2025 & 2033
- Figure 63: South Africa Polyol Sweeteners Industry Revenue (Million), by Type 2025 & 2033
- Figure 64: South Africa Polyol Sweeteners Industry Volume (K Tons), by Type 2025 & 2033
- Figure 65: South Africa Polyol Sweeteners Industry Revenue Share (%), by Type 2025 & 2033
- Figure 66: South Africa Polyol Sweeteners Industry Volume Share (%), by Type 2025 & 2033
- Figure 67: South Africa Polyol Sweeteners Industry Revenue (Million), by Application 2025 & 2033
- Figure 68: South Africa Polyol Sweeteners Industry Volume (K Tons), by Application 2025 & 2033
- Figure 69: South Africa Polyol Sweeteners Industry Revenue Share (%), by Application 2025 & 2033
- Figure 70: South Africa Polyol Sweeteners Industry Volume Share (%), by Application 2025 & 2033
- Figure 71: South Africa Polyol Sweeteners Industry Revenue (Million), by Country 2025 & 2033
- Figure 72: South Africa Polyol Sweeteners Industry Volume (K Tons), by Country 2025 & 2033
- Figure 73: South Africa Polyol Sweeteners Industry Revenue Share (%), by Country 2025 & 2033
- Figure 74: South Africa Polyol Sweeteners Industry Volume Share (%), by Country 2025 & 2033
List of Tables
- Table 1: Global Polyol Sweeteners Industry Revenue Million Forecast, by Type 2020 & 2033
- Table 2: Global Polyol Sweeteners Industry Volume K Tons Forecast, by Type 2020 & 2033
- Table 3: Global Polyol Sweeteners Industry Revenue Million Forecast, by Application 2020 & 2033
- Table 4: Global Polyol Sweeteners Industry Volume K Tons Forecast, by Application 2020 & 2033
- Table 5: Global Polyol Sweeteners Industry Revenue Million Forecast, by Region 2020 & 2033
- Table 6: Global Polyol Sweeteners Industry Volume K Tons Forecast, by Region 2020 & 2033
- Table 7: Global Polyol Sweeteners Industry Revenue Million Forecast, by Type 2020 & 2033
- Table 8: Global Polyol Sweeteners Industry Volume K Tons Forecast, by Type 2020 & 2033
- Table 9: Global Polyol Sweeteners Industry Revenue Million Forecast, by Application 2020 & 2033
- Table 10: Global Polyol Sweeteners Industry Volume K Tons Forecast, by Application 2020 & 2033
- Table 11: Global Polyol Sweeteners Industry Revenue Million Forecast, by Country 2020 & 2033
- Table 12: Global Polyol Sweeteners Industry Volume K Tons Forecast, by Country 2020 & 2033
- Table 13: United States Polyol Sweeteners Industry Revenue (Million) Forecast, by Application 2020 & 2033
- Table 14: United States Polyol Sweeteners Industry Volume (K Tons) Forecast, by Application 2020 & 2033
- Table 15: Canada Polyol Sweeteners Industry Revenue (Million) Forecast, by Application 2020 & 2033
- Table 16: Canada Polyol Sweeteners Industry Volume (K Tons) Forecast, by Application 2020 & 2033
- Table 17: Mexico Polyol Sweeteners Industry Revenue (Million) Forecast, by Application 2020 & 2033
- Table 18: Mexico Polyol Sweeteners Industry Volume (K Tons) Forecast, by Application 2020 & 2033
- Table 19: Rest of North America Polyol Sweeteners Industry Revenue (Million) Forecast, by Application 2020 & 2033
- Table 20: Rest of North America Polyol Sweeteners Industry Volume (K Tons) Forecast, by Application 2020 & 2033
- Table 21: Global Polyol Sweeteners Industry Revenue Million Forecast, by Type 2020 & 2033
- Table 22: Global Polyol Sweeteners Industry Volume K Tons Forecast, by Type 2020 & 2033
- Table 23: Global Polyol Sweeteners Industry Revenue Million Forecast, by Application 2020 & 2033
- Table 24: Global Polyol Sweeteners Industry Volume K Tons Forecast, by Application 2020 & 2033
- Table 25: Global Polyol Sweeteners Industry Revenue Million Forecast, by Country 2020 & 2033
- Table 26: Global Polyol Sweeteners Industry Volume K Tons Forecast, by Country 2020 & 2033
- Table 27: United Kingdom Polyol Sweeteners Industry Revenue (Million) Forecast, by Application 2020 & 2033
- Table 28: United Kingdom Polyol Sweeteners Industry Volume (K Tons) Forecast, by Application 2020 & 2033
- Table 29: Germany Polyol Sweeteners Industry Revenue (Million) Forecast, by Application 2020 & 2033
- Table 30: Germany Polyol Sweeteners Industry Volume (K Tons) Forecast, by Application 2020 & 2033
- Table 31: France Polyol Sweeteners Industry Revenue (Million) Forecast, by Application 2020 & 2033
- Table 32: France Polyol Sweeteners Industry Volume (K Tons) Forecast, by Application 2020 & 2033
- Table 33: Russia Polyol Sweeteners Industry Revenue (Million) Forecast, by Application 2020 & 2033
- Table 34: Russia Polyol Sweeteners Industry Volume (K Tons) Forecast, by Application 2020 & 2033
- Table 35: Italy Polyol Sweeteners Industry Revenue (Million) Forecast, by Application 2020 & 2033
- Table 36: Italy Polyol Sweeteners Industry Volume (K Tons) Forecast, by Application 2020 & 2033
- Table 37: Spain Polyol Sweeteners Industry Revenue (Million) Forecast, by Application 2020 & 2033
- Table 38: Spain Polyol Sweeteners Industry Volume (K Tons) Forecast, by Application 2020 & 2033
- Table 39: Rest of Europe Polyol Sweeteners Industry Revenue (Million) Forecast, by Application 2020 & 2033
- Table 40: Rest of Europe Polyol Sweeteners Industry Volume (K Tons) Forecast, by Application 2020 & 2033
- Table 41: Global Polyol Sweeteners Industry Revenue Million Forecast, by Type 2020 & 2033
- Table 42: Global Polyol Sweeteners Industry Volume K Tons Forecast, by Type 2020 & 2033
- Table 43: Global Polyol Sweeteners Industry Revenue Million Forecast, by Application 2020 & 2033
- Table 44: Global Polyol Sweeteners Industry Volume K Tons Forecast, by Application 2020 & 2033
- Table 45: Global Polyol Sweeteners Industry Revenue Million Forecast, by Country 2020 & 2033
- Table 46: Global Polyol Sweeteners Industry Volume K Tons Forecast, by Country 2020 & 2033
- Table 47: India Polyol Sweeteners Industry Revenue (Million) Forecast, by Application 2020 & 2033
- Table 48: India Polyol Sweeteners Industry Volume (K Tons) Forecast, by Application 2020 & 2033
- Table 49: China Polyol Sweeteners Industry Revenue (Million) Forecast, by Application 2020 & 2033
- Table 50: China Polyol Sweeteners Industry Volume (K Tons) Forecast, by Application 2020 & 2033
- Table 51: Japan Polyol Sweeteners Industry Revenue (Million) Forecast, by Application 2020 & 2033
- Table 52: Japan Polyol Sweeteners Industry Volume (K Tons) Forecast, by Application 2020 & 2033
- Table 53: Australia Polyol Sweeteners Industry Revenue (Million) Forecast, by Application 2020 & 2033
- Table 54: Australia Polyol Sweeteners Industry Volume (K Tons) Forecast, by Application 2020 & 2033
- Table 55: Rest of Asia Pacific Polyol Sweeteners Industry Revenue (Million) Forecast, by Application 2020 & 2033
- Table 56: Rest of Asia Pacific Polyol Sweeteners Industry Volume (K Tons) Forecast, by Application 2020 & 2033
- Table 57: Global Polyol Sweeteners Industry Revenue Million Forecast, by Type 2020 & 2033
- Table 58: Global Polyol Sweeteners Industry Volume K Tons Forecast, by Type 2020 & 2033
- Table 59: Global Polyol Sweeteners Industry Revenue Million Forecast, by Application 2020 & 2033
- Table 60: Global Polyol Sweeteners Industry Volume K Tons Forecast, by Application 2020 & 2033
- Table 61: Global Polyol Sweeteners Industry Revenue Million Forecast, by Country 2020 & 2033
- Table 62: Global Polyol Sweeteners Industry Volume K Tons Forecast, by Country 2020 & 2033
- Table 63: Brazil Polyol Sweeteners Industry Revenue (Million) Forecast, by Application 2020 & 2033
- Table 64: Brazil Polyol Sweeteners Industry Volume (K Tons) Forecast, by Application 2020 & 2033
- Table 65: Argentina Polyol Sweeteners Industry Revenue (Million) Forecast, by Application 2020 & 2033
- Table 66: Argentina Polyol Sweeteners Industry Volume (K Tons) Forecast, by Application 2020 & 2033
- Table 67: Rest of South America Polyol Sweeteners Industry Revenue (Million) Forecast, by Application 2020 & 2033
- Table 68: Rest of South America Polyol Sweeteners Industry Volume (K Tons) Forecast, by Application 2020 & 2033
- Table 69: Global Polyol Sweeteners Industry Revenue Million Forecast, by Type 2020 & 2033
- Table 70: Global Polyol Sweeteners Industry Volume K Tons Forecast, by Type 2020 & 2033
- Table 71: Global Polyol Sweeteners Industry Revenue Million Forecast, by Application 2020 & 2033
- Table 72: Global Polyol Sweeteners Industry Volume K Tons Forecast, by Application 2020 & 2033
- Table 73: Global Polyol Sweeteners Industry Revenue Million Forecast, by Country 2020 & 2033
- Table 74: Global Polyol Sweeteners Industry Volume K Tons Forecast, by Country 2020 & 2033
- Table 75: Global Polyol Sweeteners Industry Revenue Million Forecast, by Type 2020 & 2033
- Table 76: Global Polyol Sweeteners Industry Volume K Tons Forecast, by Type 2020 & 2033
- Table 77: Global Polyol Sweeteners Industry Revenue Million Forecast, by Application 2020 & 2033
- Table 78: Global Polyol Sweeteners Industry Volume K Tons Forecast, by Application 2020 & 2033
- Table 79: Global Polyol Sweeteners Industry Revenue Million Forecast, by Country 2020 & 2033
- Table 80: Global Polyol Sweeteners Industry Volume K Tons Forecast, by Country 2020 & 2033
- Table 81: Saudi Arabia Polyol Sweeteners Industry Revenue (Million) Forecast, by Application 2020 & 2033
- Table 82: Saudi Arabia Polyol Sweeteners Industry Volume (K Tons) Forecast, by Application 2020 & 2033
- Table 83: Rest of MEA Polyol Sweeteners Industry Revenue (Million) Forecast, by Application 2020 & 2033
- Table 84: Rest of MEA Polyol Sweeteners Industry Volume (K Tons) Forecast, by Application 2020 & 2033
Frequently Asked Questions
1. What is the projected Compound Annual Growth Rate (CAGR) of the Polyol Sweeteners Industry?
The projected CAGR is approximately 4.50%.
2. Which companies are prominent players in the Polyol Sweeteners Industry?
Key companies in the market include Hebei Huaxu Pharmaceutical Co Ltd *List Not Exhaustive, BENEO GmbH, B Food Science Co Ltd, DFI Corporation, DHW Deutsche Hydrierwerke GmbH, Dupont Nutrition & Health (Danisco), Archer Daniels Midland Company, Roquette Frères, Cargill Inc, Ingredion Incorporated.
3. What are the main segments of the Polyol Sweeteners Industry?
The market segments include Type, Application.
4. Can you provide details about the market size?
The market size is estimated to be USD 3500 Million as of 2022.
5. What are some drivers contributing to market growth?
Increasing Demand for Organic Plant Proteins; Increasing Application of Pea Protein in Food and Beverages.
6. What are the notable trends driving market growth?
Rising Preference Towards Low-Calorie Sweetener.
7. Are there any restraints impacting market growth?
Presence of Alternative protein sources.
8. Can you provide examples of recent developments in the market?
March 2023: Archer Daniels Midland Company announced the launch of the Knwble Grwn brand to provide consumers with wholesome, plant-based food ingredients that are sustainably sourced.
9. What pricing options are available for accessing the report?
Pricing options include single-user, multi-user, and enterprise licenses priced at USD 4750, USD 5250, and USD 8750 respectively.
10. Is the market size provided in terms of value or volume?
The market size is provided in terms of value, measured in Million and volume, measured in K Tons.
11. Are there any specific market keywords associated with the report?
Yes, the market keyword associated with the report is "Polyol Sweeteners Industry," which aids in identifying and referencing the specific market segment covered.
12. How do I determine which pricing option suits my needs best?
The pricing options vary based on user requirements and access needs. Individual users may opt for single-user licenses, while businesses requiring broader access may choose multi-user or enterprise licenses for cost-effective access to the report.
13. Are there any additional resources or data provided in the Polyol Sweeteners Industry report?
While the report offers comprehensive insights, it's advisable to review the specific contents or supplementary materials provided to ascertain if additional resources or data are available.
14. How can I stay updated on further developments or reports in the Polyol Sweeteners Industry?
To stay informed about further developments, trends, and reports in the Polyol Sweeteners Industry, consider subscribing to industry newsletters, following relevant companies and organizations, or regularly checking reputable industry news sources and publications.
Methodology
Step 1 - Identification of Relevant Samples Size from Population Database


Step 2 - Approaches for Defining Global Market Size (Value, Volume* & Price*)

Note*: In applicable scenarios
Step 3 - Data Sources
Primary Research
- Web Analytics
- Survey Reports
- Research Institute
- Latest Research Reports
- Opinion Leaders
Secondary Research
- Annual Reports
- White Paper
- Latest Press Release
- Industry Association
- Paid Database
- Investor Presentations

Step 4 - Data Triangulation
Involves using different sources of information in order to increase the validity of a study
These sources are likely to be stakeholders in a program - participants, other researchers, program staff, other community members, and so on.
Then we put all data in single framework & apply various statistical tools to find out the dynamic on the market.
During the analysis stage, feedback from the stakeholder groups would be compared to determine areas of agreement as well as areas of divergence