

Key Insights
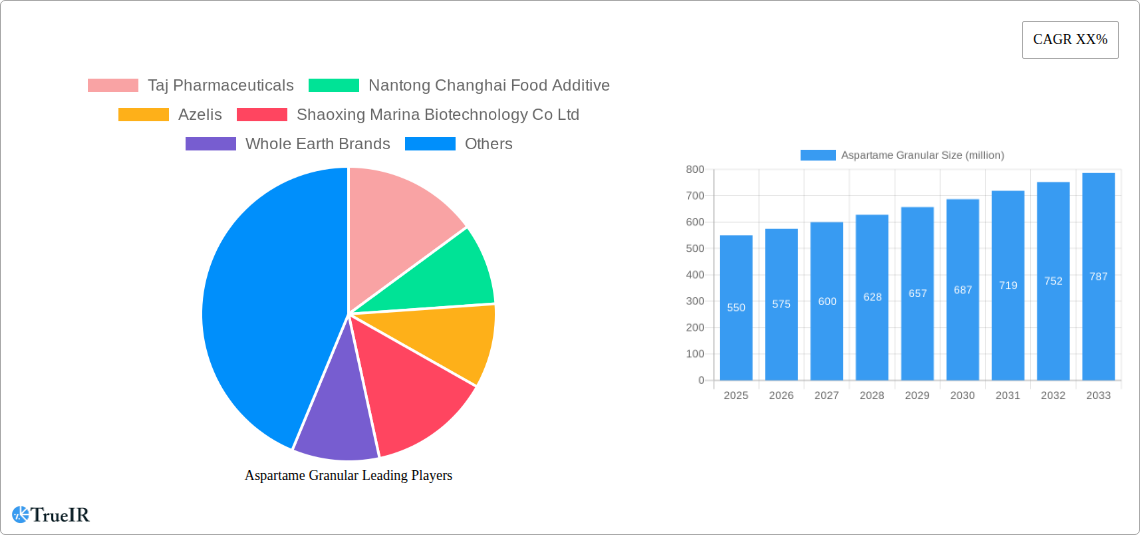
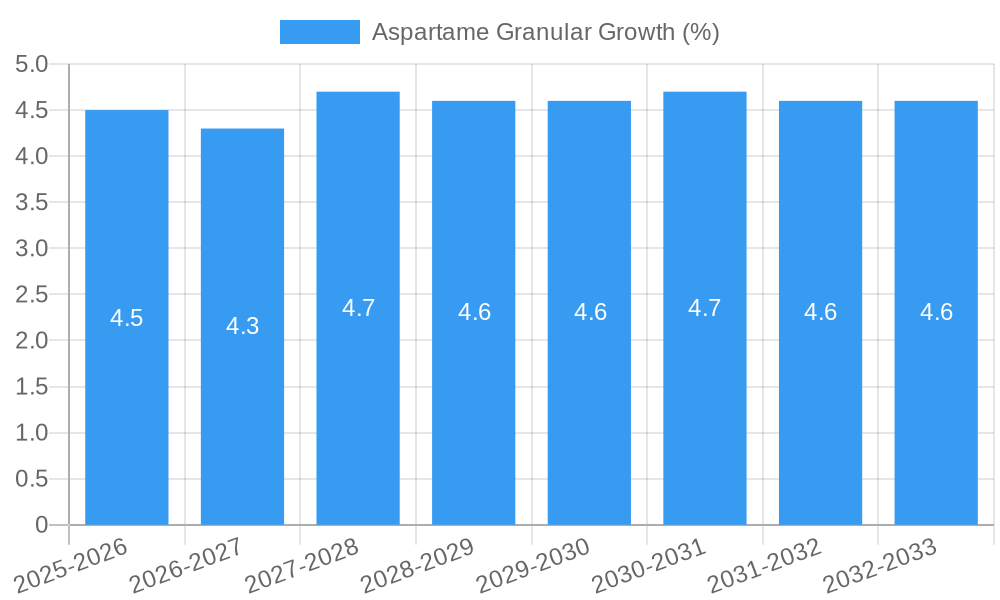
The global Aspartame Granular market is poised for significant expansion, projected to reach approximately $550 million by 2025 with a robust Compound Annual Growth Rate (CAGR) of around 4.5% expected to continue through 2033. This growth is primarily fueled by the escalating demand for low-calorie sweeteners across the food and beverages sector, driven by increasing health consciousness and the global prevalence of obesity and diabetes. Aspartame's cost-effectiveness and potent sweetness make it an attractive ingredient for manufacturers seeking to reduce sugar content without compromising taste. The pharmaceutical industry also contributes to this demand, utilizing aspartame as an excipient in various formulations. Within the market segmentation, the "Fine Granular" form is anticipated to dominate due to its superior solubility and handling properties in diverse applications.
Key market drivers include favorable regulatory landscapes in many regions supporting the use of artificial sweeteners, coupled with the ongoing innovation in food product development that incorporates aspartame for enhanced palatability and reduced caloric value. However, the market faces restraints such as the growing consumer preference for natural sweeteners and ongoing debates surrounding the potential health implications of artificial sweeteners, which could temper growth in certain segments. Emerging economies, particularly in Asia Pacific and South America, represent significant growth opportunities due to rising disposable incomes and changing dietary habits. Companies like Ajinomoto, Ingredion, and Nantong Changhai Food Additive are at the forefront, actively investing in production capacity and R&D to capitalize on these market dynamics. Strategic collaborations and product diversification will be crucial for sustained success in this competitive landscape.
This in-depth report provides a definitive analysis of the global Aspartame Granular market, covering historical performance, current trends, and future projections through 2033. Leveraging a robust research methodology, this study offers unparalleled insights for industry stakeholders seeking to navigate the dynamic landscape of artificial sweeteners.
Aspartame Granular Market Structure & Competitive Landscape
The Aspartame Granular market exhibits a moderately concentrated structure, with a significant portion of the market share held by a few key global players. Innovation drivers are primarily centered around enhancing production efficiency, improving product purity, and developing novel granular formulations for diverse applications. Regulatory impacts, including stringent food safety standards and labeling requirements across major economies, play a crucial role in shaping market entry and product development strategies. Product substitutes, such as sucralose, saccharin, and stevia, present a continuous competitive challenge, necessitating continuous improvement in aspartame's cost-effectiveness and perceived health benefits. End-user segmentation reveals a dominant reliance on the Food and Beverages industry, followed by the Pharmaceuticals sector. Mergers and acquisitions (M&A) activity has been a significant trend, with an estimated volume of 7 M&A deals in the historical period (2019-2024), aimed at consolidating market presence, expanding product portfolios, and securing supply chains. Concentration ratios are estimated to be around 55% for the top five players.
Aspartame Granular Market Trends & Opportunities
The Aspartame Granular market is poised for significant expansion, driven by evolving consumer preferences and the persistent demand for low-calorie alternatives in the global food and beverage industry. The market size is projected to reach over $2,000 million by the base year 2025, with an anticipated Compound Annual Growth Rate (CAGR) of approximately 5.5% during the forecast period of 2025–2033. Technological shifts are focusing on optimizing the granulation process to achieve precise particle size distribution, leading to improved solubility and blendability in various food matrices. This has also spurred advancements in purification techniques, ensuring a higher quality and safer product. Consumer preferences are increasingly leaning towards sugar reduction for health and wellness reasons, directly benefiting the demand for artificial sweeteners like aspartame. However, growing consumer awareness regarding the potential health impacts of artificial sweeteners, though often debated and subject to ongoing scientific research, presents a counter-trend that manufacturers must address through transparent communication and continued product safety assurances. Competitive dynamics are characterized by intense price competition among established manufacturers and the emergence of new regional players, particularly from Asia. Opportunities lie in developing specialized granular forms for niche applications, such as pharmaceuticals requiring high purity and specific dissolution rates, and expanding market reach into emerging economies where the demand for reduced-sugar products is rapidly growing. The market penetration rate for aspartame granular in its primary applications is estimated to be around 70% in developed economies, with considerable room for growth in developing regions.
Dominant Markets & Segments in Aspartame Granular
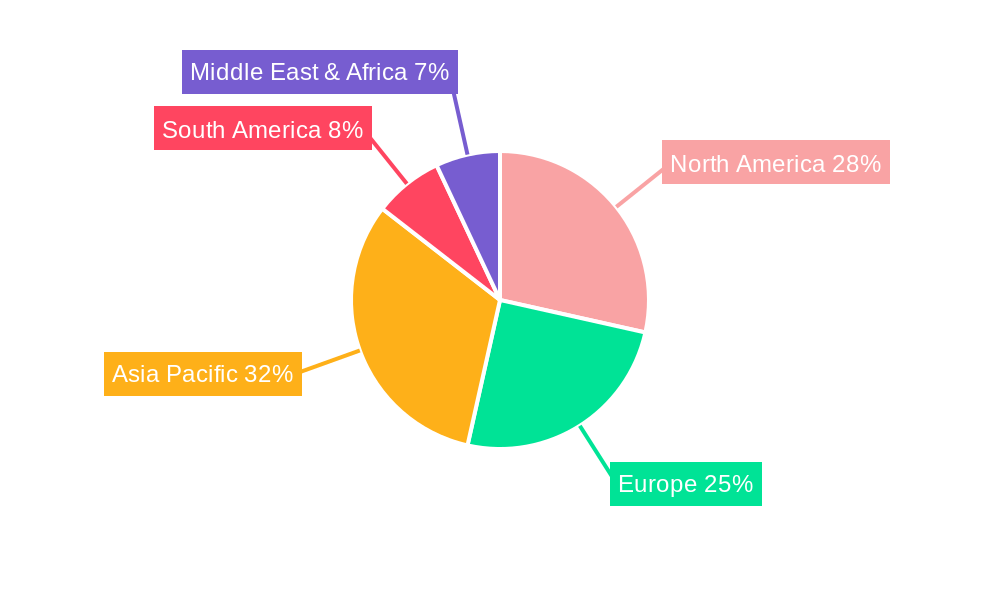
The dominant region for Aspartame Granular is North America, owing to its well-established food and beverage industry and a high consumer awareness of health and wellness trends, leading to a significant demand for sugar-free products. Within this region, the United States represents the largest single market, driven by extensive adoption across diet sodas, confectionery, and dairy products.
- Application: Food and Beverages: This segment is the primary growth engine, contributing over 85% of the market's revenue.
- Key Growth Drivers:
- Beverage Industry: The continuous innovation in diet and zero-sugar beverages, including carbonated soft drinks, flavored waters, and ready-to-drink teas, fuels substantial demand.
- Confectionery and Dairy: Growth in sugar-free chocolates, gums, yogurts, and ice creams directly translates to increased aspartame consumption.
- Bakery and Spreads: The use of aspartame in low-calorie baked goods and spreads also contributes to market expansion.
- Key Growth Drivers:
- Types: Fine Granular: The fine granular form is the most widely adopted due to its excellent solubility and ease of handling in various food processing applications.
- Market Dominance Factors:
- Versatility: Its ability to blend seamlessly into powdered mixes, beverages, and baked goods makes it a preferred choice for formulators.
- Cost-Effectiveness: Compared to some alternatives, fine granular aspartame offers a competitive price point for large-scale food production.
- Established Infrastructure: Existing manufacturing and distribution networks are optimized for the production and supply of fine granular aspartame.
- Market Dominance Factors:
- Pharmaceuticals: While a smaller segment, the pharmaceutical application holds significant potential due to the stringent purity requirements and the use of aspartame as an excipient in oral solid dosage forms like tablets and chewables.
- Growth Catalysts:
- Drug Formulation: Aspartame enhances the palatability of bitter-tasting medicines, improving patient compliance.
- Regulatory Approvals: Pharmaceutical-grade aspartame adheres to rigorous quality and safety standards, ensuring its suitability for medicinal use.
- Growth Catalysts:
Aspartame Granular Product Analysis
Aspartame granular offers distinct advantages in product formulation and application. Its highly refined granular structure ensures excellent solubility in both water and oil-based systems, facilitating seamless incorporation into a wide array of food, beverage, and pharmaceutical products. This uniformity also contributes to consistent sweetening profiles and improved mouthfeel. Competitive advantages stem from its intense sweetness, providing significant cost savings compared to sugar, and its well-established safety profile, supported by extensive scientific research and regulatory approvals worldwide. Technological advancements continue to focus on particle engineering to optimize flowability and reduce dust formation, enhancing ease of handling in industrial settings and ensuring a superior end-product experience for consumers seeking reduced-sugar options.
Key Drivers, Barriers & Challenges in Aspartame Granular
Key Drivers: The Aspartame Granular market is propelled by the escalating global health consciousness and the burgeoning demand for low-calorie and sugar-free food and beverage options. Technological advancements in production efficiency and purification methods are enhancing product quality and reducing manufacturing costs, making aspartame a more attractive sweetener. Supportive government initiatives promoting healthier dietary habits and increased R&D investments by key players to explore new applications and formulations are also significant drivers. The growing prevalence of lifestyle diseases like obesity and diabetes worldwide further amplifies the need for sugar substitutes.
Barriers & Challenges: One of the primary challenges is the persistent negative perception and ongoing debate surrounding the health effects of artificial sweeteners, which can impact consumer preference and drive demand towards natural alternatives. Stringent regulatory landscapes in different regions, requiring extensive compliance and testing, can pose significant hurdles for market entry and expansion. Fluctuations in the prices of raw materials, coupled with intense price competition from both established and emerging manufacturers, exert pressure on profit margins. Supply chain disruptions, particularly those stemming from geopolitical events or unforeseen production issues, can impact the consistent availability of aspartame granular.
Growth Drivers in the Aspartame Granular Market
The Aspartame Granular market's growth is primarily fueled by the global shift towards healthier lifestyles and the resulting surge in demand for sugar-reduced products. Technological innovations in aspartame synthesis and granulation processes are leading to improved product quality, enhanced functionality, and more cost-effective production. Favorable regulatory environments in many countries, which support the use of approved artificial sweeteners in food and beverages, further bolster market expansion. The increasing disposable income in emerging economies also contributes, as consumers become more health-conscious and willing to invest in premium, low-sugar alternatives.
Challenges Impacting Aspartame Granular Growth
The Aspartame Granular market faces significant challenges, including growing consumer apprehension regarding artificial sweeteners and ongoing public discourse on their long-term health implications, leading to a rise in demand for natural sweeteners. Navigating complex and evolving regulatory frameworks across different international markets requires substantial investment and careful compliance. Intense price competition among global manufacturers and the potential for volatile raw material costs can strain profitability. Furthermore, supply chain vulnerabilities, exacerbated by global events, can disrupt production and distribution, impacting market stability.
Key Players Shaping the Aspartame Granular Market
- Taj Pharmaceuticals
- Nantong Changhai Food Additive
- Azelis
- Shaoxing Marina Biotechnology Co Ltd
- Whole Earth Brands
- HSWT
- Changmao Biochemical Engineering Company
- Ingredion
- Foodchem
- Yogi Dye Chem Industries
- Ajinomoto
- Prakash Chemicals Agencies
- Anant Pharmaceuticals
- Hermes Sweeteners
- Vitasweet Co.
Significant Aspartame Granular Industry Milestones
- 2019: Increased R&D focus on ultra-fine granular aspartame for enhanced solubility in specialized pharmaceutical formulations.
- 2020: Major manufacturers report over a 10% increase in demand for aspartame granular driven by the pandemic-induced surge in at-home consumption of diet beverages.
- 2021: Introduction of new, more sustainable production processes by Nantong Changhai Food Additive, aiming to reduce environmental impact.
- 2022: Azelis announces strategic partnerships to expand its distribution network for aspartame granular in emerging Asian markets.
- 2023: Shaoxing Marina Biotechnology Co Ltd invests heavily in capacity expansion to meet growing global demand for high-purity aspartame granular.
- 2024: Foodchem reports a significant rise in inquiries for pharmaceutical-grade aspartame granular due to increased drug development activities.
Future Outlook for Aspartame Granular Market
The future outlook for the Aspartame Granular market remains robust, driven by the persistent global demand for sugar reduction and calorie control. Strategic opportunities lie in technological advancements for creating novel granular forms with enhanced functionalities, such as improved heat stability and synergistic sweetening effects with other high-intensity sweeteners. Expansion into untapped emerging markets, particularly in Asia and Africa, presents substantial growth potential. Furthermore, continued investment in scientific research to address consumer concerns and reinforce aspartame's safety profile will be critical for long-term market sustainability. The market is projected to witness steady growth, exceeding $2,500 million by the end of the forecast period.
Aspartame Granular Segmentation
-
1. Application
- 1.1. Food and Beverages
- 1.2. Pharmaceuticals
-
2. Types
- 2.1. Fine Granular
- 2.2. Pellets
Aspartame Granular Segmentation By Geography
-
1. North America
- 1.1. United States
- 1.2. Canada
- 1.3. Mexico
-
2. South America
- 2.1. Brazil
- 2.2. Argentina
- 2.3. Rest of South America
-
3. Europe
- 3.1. United Kingdom
- 3.2. Germany
- 3.3. France
- 3.4. Italy
- 3.5. Spain
- 3.6. Russia
- 3.7. Benelux
- 3.8. Nordics
- 3.9. Rest of Europe
-
4. Middle East & Africa
- 4.1. Turkey
- 4.2. Israel
- 4.3. GCC
- 4.4. North Africa
- 4.5. South Africa
- 4.6. Rest of Middle East & Africa
-
5. Asia Pacific
- 5.1. China
- 5.2. India
- 5.3. Japan
- 5.4. South Korea
- 5.5. ASEAN
- 5.6. Oceania
- 5.7. Rest of Asia Pacific
Aspartame Granular REPORT HIGHLIGHTS
| Aspects | Details |
|---|---|
| Study Period | 2019-2033 |
| Base Year | 2024 |
| Estimated Year | 2025 |
| Forecast Period | 2025-2033 |
| Historical Period | 2019-2024 |
| Growth Rate | CAGR of XX% from 2019-2033 |
| Segmentation |
|
Table of Contents
- 1. Introduction
- 1.1. Research Scope
- 1.2. Market Segmentation
- 1.3. Research Methodology
- 1.4. Definitions and Assumptions
- 2. Executive Summary
- 2.1. Introduction
- 3. Market Dynamics
- 3.1. Introduction
- 3.2. Market Drivers
- 3.3. Market Restrains
- 3.4. Market Trends
- 4. Market Factor Analysis
- 4.1. Porters Five Forces
- 4.2. Supply/Value Chain
- 4.3. PESTEL analysis
- 4.4. Market Entropy
- 4.5. Patent/Trademark Analysis
- 5. Global Aspartame Granular Analysis, Insights and Forecast, 2019-2031
- 5.1. Market Analysis, Insights and Forecast - by Application
- 5.1.1. Food and Beverages
- 5.1.2. Pharmaceuticals
- 5.2. Market Analysis, Insights and Forecast - by Types
- 5.2.1. Fine Granular
- 5.2.2. Pellets
- 5.3. Market Analysis, Insights and Forecast - by Region
- 5.3.1. North America
- 5.3.2. South America
- 5.3.3. Europe
- 5.3.4. Middle East & Africa
- 5.3.5. Asia Pacific
- 5.1. Market Analysis, Insights and Forecast - by Application
- 6. North America Aspartame Granular Analysis, Insights and Forecast, 2019-2031
- 6.1. Market Analysis, Insights and Forecast - by Application
- 6.1.1. Food and Beverages
- 6.1.2. Pharmaceuticals
- 6.2. Market Analysis, Insights and Forecast - by Types
- 6.2.1. Fine Granular
- 6.2.2. Pellets
- 6.1. Market Analysis, Insights and Forecast - by Application
- 7. South America Aspartame Granular Analysis, Insights and Forecast, 2019-2031
- 7.1. Market Analysis, Insights and Forecast - by Application
- 7.1.1. Food and Beverages
- 7.1.2. Pharmaceuticals
- 7.2. Market Analysis, Insights and Forecast - by Types
- 7.2.1. Fine Granular
- 7.2.2. Pellets
- 7.1. Market Analysis, Insights and Forecast - by Application
- 8. Europe Aspartame Granular Analysis, Insights and Forecast, 2019-2031
- 8.1. Market Analysis, Insights and Forecast - by Application
- 8.1.1. Food and Beverages
- 8.1.2. Pharmaceuticals
- 8.2. Market Analysis, Insights and Forecast - by Types
- 8.2.1. Fine Granular
- 8.2.2. Pellets
- 8.1. Market Analysis, Insights and Forecast - by Application
- 9. Middle East & Africa Aspartame Granular Analysis, Insights and Forecast, 2019-2031
- 9.1. Market Analysis, Insights and Forecast - by Application
- 9.1.1. Food and Beverages
- 9.1.2. Pharmaceuticals
- 9.2. Market Analysis, Insights and Forecast - by Types
- 9.2.1. Fine Granular
- 9.2.2. Pellets
- 9.1. Market Analysis, Insights and Forecast - by Application
- 10. Asia Pacific Aspartame Granular Analysis, Insights and Forecast, 2019-2031
- 10.1. Market Analysis, Insights and Forecast - by Application
- 10.1.1. Food and Beverages
- 10.1.2. Pharmaceuticals
- 10.2. Market Analysis, Insights and Forecast - by Types
- 10.2.1. Fine Granular
- 10.2.2. Pellets
- 10.1. Market Analysis, Insights and Forecast - by Application
- 11. Competitive Analysis
- 11.1. Global Market Share Analysis 2024
- 11.2. Company Profiles
- 11.2.1 Taj Pharmaceuticals
- 11.2.1.1. Overview
- 11.2.1.2. Products
- 11.2.1.3. SWOT Analysis
- 11.2.1.4. Recent Developments
- 11.2.1.5. Financials (Based on Availability)
- 11.2.2 Nantong Changhai Food Additive
- 11.2.2.1. Overview
- 11.2.2.2. Products
- 11.2.2.3. SWOT Analysis
- 11.2.2.4. Recent Developments
- 11.2.2.5. Financials (Based on Availability)
- 11.2.3 Azelis
- 11.2.3.1. Overview
- 11.2.3.2. Products
- 11.2.3.3. SWOT Analysis
- 11.2.3.4. Recent Developments
- 11.2.3.5. Financials (Based on Availability)
- 11.2.4 Shaoxing Marina Biotechnology Co Ltd
- 11.2.4.1. Overview
- 11.2.4.2. Products
- 11.2.4.3. SWOT Analysis
- 11.2.4.4. Recent Developments
- 11.2.4.5. Financials (Based on Availability)
- 11.2.5 Whole Earth Brands
- 11.2.5.1. Overview
- 11.2.5.2. Products
- 11.2.5.3. SWOT Analysis
- 11.2.5.4. Recent Developments
- 11.2.5.5. Financials (Based on Availability)
- 11.2.6 HSWT
- 11.2.6.1. Overview
- 11.2.6.2. Products
- 11.2.6.3. SWOT Analysis
- 11.2.6.4. Recent Developments
- 11.2.6.5. Financials (Based on Availability)
- 11.2.7 Changmao Biochemical Engineering Company
- 11.2.7.1. Overview
- 11.2.7.2. Products
- 11.2.7.3. SWOT Analysis
- 11.2.7.4. Recent Developments
- 11.2.7.5. Financials (Based on Availability)
- 11.2.8 Ingredion
- 11.2.8.1. Overview
- 11.2.8.2. Products
- 11.2.8.3. SWOT Analysis
- 11.2.8.4. Recent Developments
- 11.2.8.5. Financials (Based on Availability)
- 11.2.9 Foodchem
- 11.2.9.1. Overview
- 11.2.9.2. Products
- 11.2.9.3. SWOT Analysis
- 11.2.9.4. Recent Developments
- 11.2.9.5. Financials (Based on Availability)
- 11.2.10 Yogi Dye Chem Industries
- 11.2.10.1. Overview
- 11.2.10.2. Products
- 11.2.10.3. SWOT Analysis
- 11.2.10.4. Recent Developments
- 11.2.10.5. Financials (Based on Availability)
- 11.2.11 Ajinomoto
- 11.2.11.1. Overview
- 11.2.11.2. Products
- 11.2.11.3. SWOT Analysis
- 11.2.11.4. Recent Developments
- 11.2.11.5. Financials (Based on Availability)
- 11.2.12 Prakash Chemicals Agencies
- 11.2.12.1. Overview
- 11.2.12.2. Products
- 11.2.12.3. SWOT Analysis
- 11.2.12.4. Recent Developments
- 11.2.12.5. Financials (Based on Availability)
- 11.2.13 Anant Pharmaceuticals
- 11.2.13.1. Overview
- 11.2.13.2. Products
- 11.2.13.3. SWOT Analysis
- 11.2.13.4. Recent Developments
- 11.2.13.5. Financials (Based on Availability)
- 11.2.14 Hermes Sweeteners
- 11.2.14.1. Overview
- 11.2.14.2. Products
- 11.2.14.3. SWOT Analysis
- 11.2.14.4. Recent Developments
- 11.2.14.5. Financials (Based on Availability)
- 11.2.15 Vitasweet Co.
- 11.2.15.1. Overview
- 11.2.15.2. Products
- 11.2.15.3. SWOT Analysis
- 11.2.15.4. Recent Developments
- 11.2.15.5. Financials (Based on Availability)
- 11.2.1 Taj Pharmaceuticals
List of Figures
- Figure 1: Global Aspartame Granular Revenue Breakdown (million, %) by Region 2024 & 2032
- Figure 2: Global Aspartame Granular Volume Breakdown (K, %) by Region 2024 & 2032
- Figure 3: North America Aspartame Granular Revenue (million), by Application 2024 & 2032
- Figure 4: North America Aspartame Granular Volume (K), by Application 2024 & 2032
- Figure 5: North America Aspartame Granular Revenue Share (%), by Application 2024 & 2032
- Figure 6: North America Aspartame Granular Volume Share (%), by Application 2024 & 2032
- Figure 7: North America Aspartame Granular Revenue (million), by Types 2024 & 2032
- Figure 8: North America Aspartame Granular Volume (K), by Types 2024 & 2032
- Figure 9: North America Aspartame Granular Revenue Share (%), by Types 2024 & 2032
- Figure 10: North America Aspartame Granular Volume Share (%), by Types 2024 & 2032
- Figure 11: North America Aspartame Granular Revenue (million), by Country 2024 & 2032
- Figure 12: North America Aspartame Granular Volume (K), by Country 2024 & 2032
- Figure 13: North America Aspartame Granular Revenue Share (%), by Country 2024 & 2032
- Figure 14: North America Aspartame Granular Volume Share (%), by Country 2024 & 2032
- Figure 15: South America Aspartame Granular Revenue (million), by Application 2024 & 2032
- Figure 16: South America Aspartame Granular Volume (K), by Application 2024 & 2032
- Figure 17: South America Aspartame Granular Revenue Share (%), by Application 2024 & 2032
- Figure 18: South America Aspartame Granular Volume Share (%), by Application 2024 & 2032
- Figure 19: South America Aspartame Granular Revenue (million), by Types 2024 & 2032
- Figure 20: South America Aspartame Granular Volume (K), by Types 2024 & 2032
- Figure 21: South America Aspartame Granular Revenue Share (%), by Types 2024 & 2032
- Figure 22: South America Aspartame Granular Volume Share (%), by Types 2024 & 2032
- Figure 23: South America Aspartame Granular Revenue (million), by Country 2024 & 2032
- Figure 24: South America Aspartame Granular Volume (K), by Country 2024 & 2032
- Figure 25: South America Aspartame Granular Revenue Share (%), by Country 2024 & 2032
- Figure 26: South America Aspartame Granular Volume Share (%), by Country 2024 & 2032
- Figure 27: Europe Aspartame Granular Revenue (million), by Application 2024 & 2032
- Figure 28: Europe Aspartame Granular Volume (K), by Application 2024 & 2032
- Figure 29: Europe Aspartame Granular Revenue Share (%), by Application 2024 & 2032
- Figure 30: Europe Aspartame Granular Volume Share (%), by Application 2024 & 2032
- Figure 31: Europe Aspartame Granular Revenue (million), by Types 2024 & 2032
- Figure 32: Europe Aspartame Granular Volume (K), by Types 2024 & 2032
- Figure 33: Europe Aspartame Granular Revenue Share (%), by Types 2024 & 2032
- Figure 34: Europe Aspartame Granular Volume Share (%), by Types 2024 & 2032
- Figure 35: Europe Aspartame Granular Revenue (million), by Country 2024 & 2032
- Figure 36: Europe Aspartame Granular Volume (K), by Country 2024 & 2032
- Figure 37: Europe Aspartame Granular Revenue Share (%), by Country 2024 & 2032
- Figure 38: Europe Aspartame Granular Volume Share (%), by Country 2024 & 2032
- Figure 39: Middle East & Africa Aspartame Granular Revenue (million), by Application 2024 & 2032
- Figure 40: Middle East & Africa Aspartame Granular Volume (K), by Application 2024 & 2032
- Figure 41: Middle East & Africa Aspartame Granular Revenue Share (%), by Application 2024 & 2032
- Figure 42: Middle East & Africa Aspartame Granular Volume Share (%), by Application 2024 & 2032
- Figure 43: Middle East & Africa Aspartame Granular Revenue (million), by Types 2024 & 2032
- Figure 44: Middle East & Africa Aspartame Granular Volume (K), by Types 2024 & 2032
- Figure 45: Middle East & Africa Aspartame Granular Revenue Share (%), by Types 2024 & 2032
- Figure 46: Middle East & Africa Aspartame Granular Volume Share (%), by Types 2024 & 2032
- Figure 47: Middle East & Africa Aspartame Granular Revenue (million), by Country 2024 & 2032
- Figure 48: Middle East & Africa Aspartame Granular Volume (K), by Country 2024 & 2032
- Figure 49: Middle East & Africa Aspartame Granular Revenue Share (%), by Country 2024 & 2032
- Figure 50: Middle East & Africa Aspartame Granular Volume Share (%), by Country 2024 & 2032
- Figure 51: Asia Pacific Aspartame Granular Revenue (million), by Application 2024 & 2032
- Figure 52: Asia Pacific Aspartame Granular Volume (K), by Application 2024 & 2032
- Figure 53: Asia Pacific Aspartame Granular Revenue Share (%), by Application 2024 & 2032
- Figure 54: Asia Pacific Aspartame Granular Volume Share (%), by Application 2024 & 2032
- Figure 55: Asia Pacific Aspartame Granular Revenue (million), by Types 2024 & 2032
- Figure 56: Asia Pacific Aspartame Granular Volume (K), by Types 2024 & 2032
- Figure 57: Asia Pacific Aspartame Granular Revenue Share (%), by Types 2024 & 2032
- Figure 58: Asia Pacific Aspartame Granular Volume Share (%), by Types 2024 & 2032
- Figure 59: Asia Pacific Aspartame Granular Revenue (million), by Country 2024 & 2032
- Figure 60: Asia Pacific Aspartame Granular Volume (K), by Country 2024 & 2032
- Figure 61: Asia Pacific Aspartame Granular Revenue Share (%), by Country 2024 & 2032
- Figure 62: Asia Pacific Aspartame Granular Volume Share (%), by Country 2024 & 2032
List of Tables
- Table 1: Global Aspartame Granular Revenue million Forecast, by Region 2019 & 2032
- Table 2: Global Aspartame Granular Volume K Forecast, by Region 2019 & 2032
- Table 3: Global Aspartame Granular Revenue million Forecast, by Application 2019 & 2032
- Table 4: Global Aspartame Granular Volume K Forecast, by Application 2019 & 2032
- Table 5: Global Aspartame Granular Revenue million Forecast, by Types 2019 & 2032
- Table 6: Global Aspartame Granular Volume K Forecast, by Types 2019 & 2032
- Table 7: Global Aspartame Granular Revenue million Forecast, by Region 2019 & 2032
- Table 8: Global Aspartame Granular Volume K Forecast, by Region 2019 & 2032
- Table 9: Global Aspartame Granular Revenue million Forecast, by Application 2019 & 2032
- Table 10: Global Aspartame Granular Volume K Forecast, by Application 2019 & 2032
- Table 11: Global Aspartame Granular Revenue million Forecast, by Types 2019 & 2032
- Table 12: Global Aspartame Granular Volume K Forecast, by Types 2019 & 2032
- Table 13: Global Aspartame Granular Revenue million Forecast, by Country 2019 & 2032
- Table 14: Global Aspartame Granular Volume K Forecast, by Country 2019 & 2032
- Table 15: United States Aspartame Granular Revenue (million) Forecast, by Application 2019 & 2032
- Table 16: United States Aspartame Granular Volume (K) Forecast, by Application 2019 & 2032
- Table 17: Canada Aspartame Granular Revenue (million) Forecast, by Application 2019 & 2032
- Table 18: Canada Aspartame Granular Volume (K) Forecast, by Application 2019 & 2032
- Table 19: Mexico Aspartame Granular Revenue (million) Forecast, by Application 2019 & 2032
- Table 20: Mexico Aspartame Granular Volume (K) Forecast, by Application 2019 & 2032
- Table 21: Global Aspartame Granular Revenue million Forecast, by Application 2019 & 2032
- Table 22: Global Aspartame Granular Volume K Forecast, by Application 2019 & 2032
- Table 23: Global Aspartame Granular Revenue million Forecast, by Types 2019 & 2032
- Table 24: Global Aspartame Granular Volume K Forecast, by Types 2019 & 2032
- Table 25: Global Aspartame Granular Revenue million Forecast, by Country 2019 & 2032
- Table 26: Global Aspartame Granular Volume K Forecast, by Country 2019 & 2032
- Table 27: Brazil Aspartame Granular Revenue (million) Forecast, by Application 2019 & 2032
- Table 28: Brazil Aspartame Granular Volume (K) Forecast, by Application 2019 & 2032
- Table 29: Argentina Aspartame Granular Revenue (million) Forecast, by Application 2019 & 2032
- Table 30: Argentina Aspartame Granular Volume (K) Forecast, by Application 2019 & 2032
- Table 31: Rest of South America Aspartame Granular Revenue (million) Forecast, by Application 2019 & 2032
- Table 32: Rest of South America Aspartame Granular Volume (K) Forecast, by Application 2019 & 2032
- Table 33: Global Aspartame Granular Revenue million Forecast, by Application 2019 & 2032
- Table 34: Global Aspartame Granular Volume K Forecast, by Application 2019 & 2032
- Table 35: Global Aspartame Granular Revenue million Forecast, by Types 2019 & 2032
- Table 36: Global Aspartame Granular Volume K Forecast, by Types 2019 & 2032
- Table 37: Global Aspartame Granular Revenue million Forecast, by Country 2019 & 2032
- Table 38: Global Aspartame Granular Volume K Forecast, by Country 2019 & 2032
- Table 39: United Kingdom Aspartame Granular Revenue (million) Forecast, by Application 2019 & 2032
- Table 40: United Kingdom Aspartame Granular Volume (K) Forecast, by Application 2019 & 2032
- Table 41: Germany Aspartame Granular Revenue (million) Forecast, by Application 2019 & 2032
- Table 42: Germany Aspartame Granular Volume (K) Forecast, by Application 2019 & 2032
- Table 43: France Aspartame Granular Revenue (million) Forecast, by Application 2019 & 2032
- Table 44: France Aspartame Granular Volume (K) Forecast, by Application 2019 & 2032
- Table 45: Italy Aspartame Granular Revenue (million) Forecast, by Application 2019 & 2032
- Table 46: Italy Aspartame Granular Volume (K) Forecast, by Application 2019 & 2032
- Table 47: Spain Aspartame Granular Revenue (million) Forecast, by Application 2019 & 2032
- Table 48: Spain Aspartame Granular Volume (K) Forecast, by Application 2019 & 2032
- Table 49: Russia Aspartame Granular Revenue (million) Forecast, by Application 2019 & 2032
- Table 50: Russia Aspartame Granular Volume (K) Forecast, by Application 2019 & 2032
- Table 51: Benelux Aspartame Granular Revenue (million) Forecast, by Application 2019 & 2032
- Table 52: Benelux Aspartame Granular Volume (K) Forecast, by Application 2019 & 2032
- Table 53: Nordics Aspartame Granular Revenue (million) Forecast, by Application 2019 & 2032
- Table 54: Nordics Aspartame Granular Volume (K) Forecast, by Application 2019 & 2032
- Table 55: Rest of Europe Aspartame Granular Revenue (million) Forecast, by Application 2019 & 2032
- Table 56: Rest of Europe Aspartame Granular Volume (K) Forecast, by Application 2019 & 2032
- Table 57: Global Aspartame Granular Revenue million Forecast, by Application 2019 & 2032
- Table 58: Global Aspartame Granular Volume K Forecast, by Application 2019 & 2032
- Table 59: Global Aspartame Granular Revenue million Forecast, by Types 2019 & 2032
- Table 60: Global Aspartame Granular Volume K Forecast, by Types 2019 & 2032
- Table 61: Global Aspartame Granular Revenue million Forecast, by Country 2019 & 2032
- Table 62: Global Aspartame Granular Volume K Forecast, by Country 2019 & 2032
- Table 63: Turkey Aspartame Granular Revenue (million) Forecast, by Application 2019 & 2032
- Table 64: Turkey Aspartame Granular Volume (K) Forecast, by Application 2019 & 2032
- Table 65: Israel Aspartame Granular Revenue (million) Forecast, by Application 2019 & 2032
- Table 66: Israel Aspartame Granular Volume (K) Forecast, by Application 2019 & 2032
- Table 67: GCC Aspartame Granular Revenue (million) Forecast, by Application 2019 & 2032
- Table 68: GCC Aspartame Granular Volume (K) Forecast, by Application 2019 & 2032
- Table 69: North Africa Aspartame Granular Revenue (million) Forecast, by Application 2019 & 2032
- Table 70: North Africa Aspartame Granular Volume (K) Forecast, by Application 2019 & 2032
- Table 71: South Africa Aspartame Granular Revenue (million) Forecast, by Application 2019 & 2032
- Table 72: South Africa Aspartame Granular Volume (K) Forecast, by Application 2019 & 2032
- Table 73: Rest of Middle East & Africa Aspartame Granular Revenue (million) Forecast, by Application 2019 & 2032
- Table 74: Rest of Middle East & Africa Aspartame Granular Volume (K) Forecast, by Application 2019 & 2032
- Table 75: Global Aspartame Granular Revenue million Forecast, by Application 2019 & 2032
- Table 76: Global Aspartame Granular Volume K Forecast, by Application 2019 & 2032
- Table 77: Global Aspartame Granular Revenue million Forecast, by Types 2019 & 2032
- Table 78: Global Aspartame Granular Volume K Forecast, by Types 2019 & 2032
- Table 79: Global Aspartame Granular Revenue million Forecast, by Country 2019 & 2032
- Table 80: Global Aspartame Granular Volume K Forecast, by Country 2019 & 2032
- Table 81: China Aspartame Granular Revenue (million) Forecast, by Application 2019 & 2032
- Table 82: China Aspartame Granular Volume (K) Forecast, by Application 2019 & 2032
- Table 83: India Aspartame Granular Revenue (million) Forecast, by Application 2019 & 2032
- Table 84: India Aspartame Granular Volume (K) Forecast, by Application 2019 & 2032
- Table 85: Japan Aspartame Granular Revenue (million) Forecast, by Application 2019 & 2032
- Table 86: Japan Aspartame Granular Volume (K) Forecast, by Application 2019 & 2032
- Table 87: South Korea Aspartame Granular Revenue (million) Forecast, by Application 2019 & 2032
- Table 88: South Korea Aspartame Granular Volume (K) Forecast, by Application 2019 & 2032
- Table 89: ASEAN Aspartame Granular Revenue (million) Forecast, by Application 2019 & 2032
- Table 90: ASEAN Aspartame Granular Volume (K) Forecast, by Application 2019 & 2032
- Table 91: Oceania Aspartame Granular Revenue (million) Forecast, by Application 2019 & 2032
- Table 92: Oceania Aspartame Granular Volume (K) Forecast, by Application 2019 & 2032
- Table 93: Rest of Asia Pacific Aspartame Granular Revenue (million) Forecast, by Application 2019 & 2032
- Table 94: Rest of Asia Pacific Aspartame Granular Volume (K) Forecast, by Application 2019 & 2032
Frequently Asked Questions
1. What is the projected Compound Annual Growth Rate (CAGR) of the Aspartame Granular?
The projected CAGR is approximately XX%.
2. Which companies are prominent players in the Aspartame Granular?
Key companies in the market include Taj Pharmaceuticals, Nantong Changhai Food Additive, Azelis, Shaoxing Marina Biotechnology Co Ltd, Whole Earth Brands, HSWT, Changmao Biochemical Engineering Company, Ingredion, Foodchem, Yogi Dye Chem Industries, Ajinomoto, Prakash Chemicals Agencies, Anant Pharmaceuticals, Hermes Sweeteners, Vitasweet Co..
3. What are the main segments of the Aspartame Granular?
The market segments include Application, Types.
4. Can you provide details about the market size?
The market size is estimated to be USD XXX million as of 2022.
5. What are some drivers contributing to market growth?
N/A
6. What are the notable trends driving market growth?
N/A
7. Are there any restraints impacting market growth?
N/A
8. Can you provide examples of recent developments in the market?
N/A
9. What pricing options are available for accessing the report?
Pricing options include single-user, multi-user, and enterprise licenses priced at USD 3950.00, USD 5925.00, and USD 7900.00 respectively.
10. Is the market size provided in terms of value or volume?
The market size is provided in terms of value, measured in million and volume, measured in K.
11. Are there any specific market keywords associated with the report?
Yes, the market keyword associated with the report is "Aspartame Granular," which aids in identifying and referencing the specific market segment covered.
12. How do I determine which pricing option suits my needs best?
The pricing options vary based on user requirements and access needs. Individual users may opt for single-user licenses, while businesses requiring broader access may choose multi-user or enterprise licenses for cost-effective access to the report.
13. Are there any additional resources or data provided in the Aspartame Granular report?
While the report offers comprehensive insights, it's advisable to review the specific contents or supplementary materials provided to ascertain if additional resources or data are available.
14. How can I stay updated on further developments or reports in the Aspartame Granular?
To stay informed about further developments, trends, and reports in the Aspartame Granular, consider subscribing to industry newsletters, following relevant companies and organizations, or regularly checking reputable industry news sources and publications.
Methodology
Step 1 - Identification of Relevant Samples Size from Population Database


Step 2 - Approaches for Defining Global Market Size (Value, Volume* & Price*)

Note*: In applicable scenarios
Step 3 - Data Sources
Primary Research
- Web Analytics
- Survey Reports
- Research Institute
- Latest Research Reports
- Opinion Leaders
Secondary Research
- Annual Reports
- White Paper
- Latest Press Release
- Industry Association
- Paid Database
- Investor Presentations

Step 4 - Data Triangulation
Involves using different sources of information in order to increase the validity of a study
These sources are likely to be stakeholders in a program - participants, other researchers, program staff, other community members, and so on.
Then we put all data in single framework & apply various statistical tools to find out the dynamic on the market.
During the analysis stage, feedback from the stakeholder groups would be compared to determine areas of agreement as well as areas of divergence
