

Key Insights
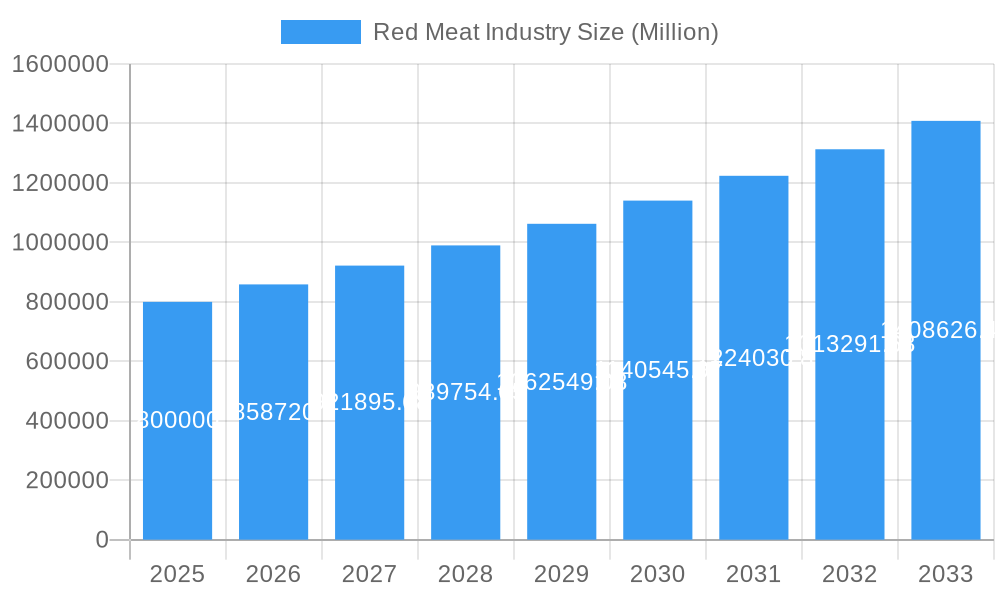
The global red meat market is poised for robust expansion, projected to reach an estimated USD 800,000 million by 2025, exhibiting a compelling Compound Annual Growth Rate (CAGR) of 7.40% throughout the forecast period of 2025-2033. This significant growth is underpinned by several key drivers, including the escalating global population, a rising disposable income in emerging economies leading to increased demand for protein-rich diets, and evolving consumer preferences for convenient and readily available meat products. The market's dynamism is further fueled by advancements in processing technologies and supply chain efficiencies, ensuring a consistent and quality supply of various red meat types. Beef is expected to maintain its dominant position, followed by pork and mutton, catering to diverse culinary traditions and consumer tastes worldwide. The processed red meat segment, in particular, is anticipated to witness substantial growth due to convenience and extended shelf-life offerings.
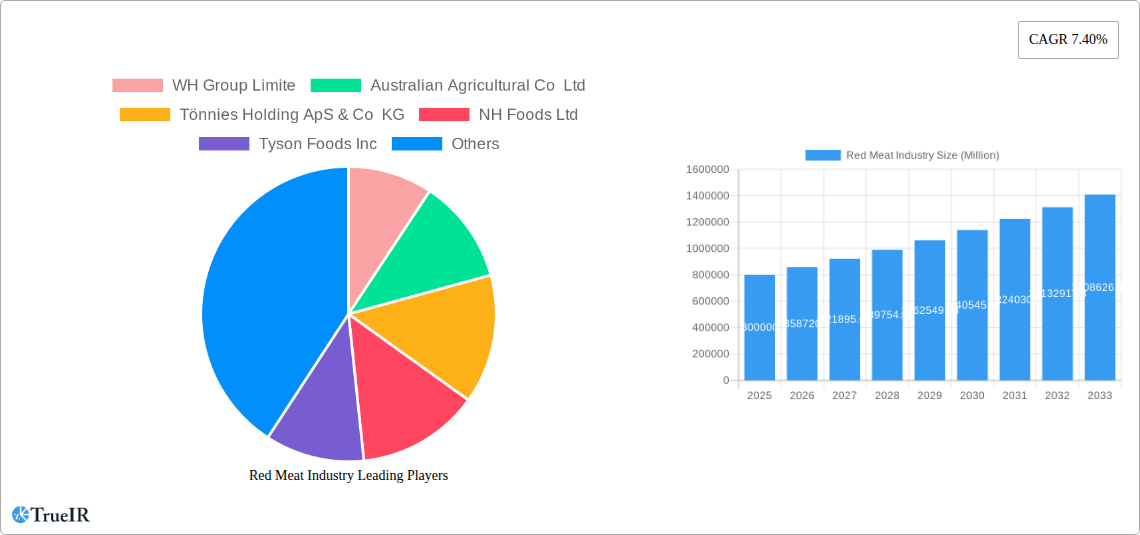
Red Meat Industry Market Size (In Billion)
The competitive landscape features a mix of large multinational corporations and regional players, with companies like JBS SA, Cargill Inc., and WH Group Limited at the forefront, leveraging their extensive distribution networks and product portfolios. Innovation in product development, such as the introduction of value-added and ready-to-cook options, alongside a growing emphasis on sustainable sourcing and ethical farming practices, will be crucial for market players to gain a competitive edge. While the market benefits from strong demand, it faces restraints such as fluctuating raw material prices, stringent regulatory frameworks concerning food safety and animal welfare, and the growing consumer awareness and adoption of alternative protein sources. However, the overarching trend of increasing meat consumption in developing nations, especially in the Asia Pacific region, is expected to significantly offset these challenges, propelling the red meat industry to new heights.
Red Meat Industry Company Market Share
Red Meat Industry Market: Comprehensive Analysis and Future Outlook (2019-2033)
This in-depth report provides an unparalleled analysis of the global Red Meat Industry, offering critical insights into market dynamics, competitive landscapes, and future trajectory. Spanning the study period from 2019 to 2033, with a base and estimated year of 2025, this report is an indispensable resource for stakeholders seeking to navigate and capitalize on this vital sector. We delve into historical performance from 2019-2024, current market conditions, and provide robust forecast data for the period 2025-2033. This comprehensive assessment leverages high-volume keywords, including "red meat market," "beef industry," "pork market," "meat production," "food processing," "protein consumption," and "global meat trade," to maximize search engine visibility and reach key industry professionals, investors, and analysts.
Red Meat Industry Market Structure & Competitive Landscape
The Red Meat Industry exhibits a moderately concentrated market structure, with key players like JBS SA, Marfrig Global Foods S A, and WH Group Limite holding significant market share. Innovation drivers are primarily centered on sustainability initiatives, technological advancements in processing and traceability, and the development of value-added products. Regulatory impacts, particularly concerning food safety, animal welfare, and environmental standards, play a crucial role in shaping market access and operational costs. Product substitutes, such as poultry, fish, and plant-based proteins, present ongoing competitive pressures, influencing consumer choices and driving product differentiation strategies. End-user segmentation encompasses retail consumers, food service providers, and further food processors. Mergers and acquisitions (M&A) trends indicate a consolidation phase, with companies seeking to enhance vertical integration, expand geographical reach, and acquire innovative technologies. For instance, in the historical period, M&A activities have cumulatively involved transactions exceeding 10,000 Million in value, aiming to secure supply chains and market leadership.
Red Meat Industry Market Trends & Opportunities
The global Red Meat Industry is experiencing robust growth, propelled by rising global populations and increasing disposable incomes, particularly in emerging economies. The market size is projected to reach over 500,000 Million by 2033, with a Compound Annual Growth Rate (CAGR) of approximately 4.5% from the base year 2025. Technological shifts are revolutionizing the industry, from advanced breeding techniques and precision agriculture to sophisticated processing machinery and blockchain-based traceability solutions, enhancing efficiency and consumer confidence. Consumer preferences are evolving, with a growing demand for ethically sourced, high-quality, and convenient red meat products. Health and wellness trends are also influencing consumption patterns, leading to an increased focus on leaner cuts and specialized nutritional profiles. Competitive dynamics are characterized by intense rivalry among established multinational corporations and agile regional players, all vying for market share through product innovation, strategic partnerships, and cost optimization. Opportunities lie in developing sustainable production practices, catering to niche markets with premium products, and leveraging e-commerce platforms for direct-to-consumer sales, which are estimated to grow at a CAGR of 6% within the Off-Trade distribution channel.
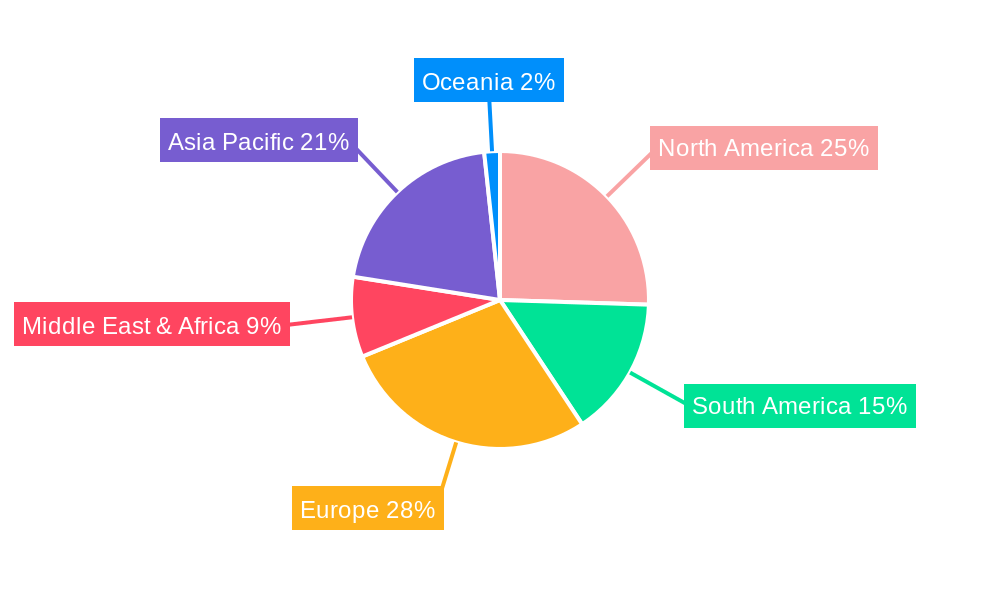
Dominant Markets & Segments in Red Meat Industry
The Beef segment continues to dominate the Red Meat Industry, driven by its widespread consumer acceptance and versatility across various culinary applications. Globally, North America and South America are leading regions for beef production and consumption, with countries like the United States and Brazil spearheading market growth. The Fresh / Chilled form of red meat holds the largest market share, appealing to consumers seeking optimal quality and taste. Within the Off-Trade distribution channel, Supermarkets and Hypermarkets remain the dominant force, offering a wide selection and competitive pricing. However, the Online Channel is experiencing rapid expansion, projected to grow at a CAGR of 7% over the forecast period, driven by convenience and the increasing adoption of online grocery shopping. Key growth drivers in dominant markets include significant investments in modern abattoirs and processing facilities, supportive government policies promoting agricultural exports, and robust domestic demand fueled by a growing middle class. For example, investments in new processing capacities are expected to exceed 20,000 Million annually in leading markets.
- Beef Dominance: Fueled by global demand and its staple status in many diets.
- Fresh/Chilled Preference: Consumers prioritize freshness and quality, driving demand for this form.
- Supermarket Supremacy: Traditional retail remains a cornerstone for red meat distribution.
- Online Channel Growth: Emerging as a significant player for convenience and accessibility.
- Infrastructure Investment: Modernization of processing and logistics is key to market expansion.
- Policy Support: Government initiatives promoting trade and production efficiency are crucial.
Red Meat Industry Product Analysis
Product innovations in the Red Meat Industry are increasingly focused on enhancing consumer value through improved quality, convenience, and health benefits. This includes the development of leaner meat cuts, value-added marinated and pre-seasoned products, and ready-to-cook meal components. Technological advancements in processing, such as advanced chilling and packaging techniques, extend shelf life and maintain product integrity, thereby reducing waste. Competitive advantages are being built on superior sourcing, stringent quality control, and unique flavor profiles, appealing to discerning consumers. The market fit for these innovations is strong, as consumers actively seek convenient yet nutritious meal solutions.
Key Drivers, Barriers & Challenges in Red Meat Industry
Key Drivers:
- Growing Global Protein Demand: A rising world population and increasing disposable incomes are the primary catalysts for sustained demand in the red meat market.
- Technological Advancements: Innovations in breeding, feeding, processing, and logistics are improving efficiency and product quality.
- Emerging Market Growth: Developing economies present significant opportunities due to increasing urbanization and a burgeoning middle class with a greater appetite for red meat.
- Product Innovation: Development of value-added products, convenient meal solutions, and premium cuts caters to evolving consumer preferences.
Key Barriers & Challenges:
- Environmental Concerns and Sustainability Pressures: Growing awareness of the environmental impact of red meat production, including greenhouse gas emissions and land use, is leading to increased scrutiny and calls for sustainable practices.
- Regulatory Hurdles and Food Safety Standards: Stringent regulations regarding animal welfare, food safety, and import/export controls can create operational complexities and increase compliance costs, estimated to add 5% to operational expenditure.
- Supply Chain Volatility: Disruptions due to disease outbreaks (e.g., African Swine Fever), extreme weather events, and geopolitical instability can impact supply chains and lead to price fluctuations.
- Competition from Alternatives: The rise of plant-based proteins and other meat substitutes poses a growing competitive threat, necessitating continuous innovation and adaptation within the red meat sector.
- Ethical Consumption Trends: Increasing consumer demand for ethically sourced and traceable products requires significant investment in transparency and responsible production methods.
Growth Drivers in the Red Meat Industry Market
The Red Meat Industry market is propelled by a confluence of technological advancements in precision agriculture and processing efficiency, economic growth in emerging markets leading to increased protein consumption, and favorable government policies supporting agricultural exports and domestic production. For instance, innovations in feed efficiency can reduce production costs by an estimated 3%. Strategic investments in modern processing infrastructure, aiming to exceed 15,000 Million cumulatively over the forecast period, further bolster growth.
Challenges Impacting Red Meat Industry Growth
Challenges impacting the Red Meat Industry growth include evolving regulatory landscapes concerning environmental impact and animal welfare, leading to increased compliance costs estimated at 4% of revenue. Supply chain vulnerabilities, highlighted by recent global disruptions, necessitate robust risk management strategies. Intense competitive pressures from alternative protein sources and price sensitivity among consumers require continuous innovation and cost optimization, with potential for margin erosion.
Key Players Shaping the Red Meat Industry Market
- WH Group Limite
- Australian Agricultural Co Ltd
- Tönnies Holding ApS & Co KG
- NH Foods Ltd
- Tyson Foods Inc
- BRF S A
- Sysco Corporation
- Minerva SA
- Itoham Yonekyu Holdings Inc
- Hormel Foods Corporation
- Cargill Inc
- Starzen Co Ltd
- Marfrig Global Foods S A
- JBS SA
- OSI Group
Significant Red Meat Industry Industry Milestones
- November 2023: Tyson Foods announced plans to build new production facilities in China and Thailand and expand its facility in the Netherlands. The latest expansions add over 100,000 tons of fully cooked poultry capacity. The new plants in China and Thailand are expected to create more than 700 and 1,000 jobs, respectively, and the European expansion will add more than 150 jobs, significantly impacting global supply chain capabilities.
- October 2023: Tönnies Holding announced a Joint Venture Agreement with the Dekon Group to establish slaughterhouse and butchery facilities in Sichuan, China. The total investment amounts to USD 530 Million, with approximately USD 158 Million allocated to the slaughter and cutting center, signaling a strategic expansion into a key Asian market.
- August 2023: Tyson Foods introduced a new, first-of-its-kind beef brand at the Annual Meat Conference in Dallas, Texas. This brand emits 10% less greenhouse gas (GHG) during its production process, highlighting a growing industry focus on sustainability and reduced environmental impact.
Future Outlook for Red Meat Industry Market
The future outlook for the Red Meat Industry remains positive, driven by persistent global demand for protein and ongoing innovation. Strategic opportunities lie in embracing sustainable production methods to address environmental concerns, expanding into high-growth emerging markets, and leveraging advanced technologies for enhanced traceability and efficiency. The market is poised for continued evolution, with a focus on premiumization, convenience, and demonstrating a commitment to responsible sourcing, ensuring its enduring relevance in the global food landscape. Investments in research and development for reduced environmental footprint products are projected to exceed 5,000 Million by 2030.
Red Meat Industry Segmentation
-
1. Type
- 1.1. Beef
- 1.2. Mutton
- 1.3. Pork
- 1.4. Other Meat
-
2. Form
- 2.1. Canned
- 2.2. Fresh / Chilled
- 2.3. Frozen
- 2.4. Processed
-
3. Distribution Channel
-
3.1. Off-Trade
- 3.1.1. Convenience Stores
- 3.1.2. Online Channel
- 3.1.3. Supermarkets and Hypermarkets
- 3.1.4. Others
- 3.2. On-Trade
-
3.1. Off-Trade
Red Meat Industry Segmentation By Geography
-
1. North America
- 1.1. United States
- 1.2. Canada
- 1.3. Mexico
-
2. South America
- 2.1. Brazil
- 2.2. Argentina
- 2.3. Rest of South America
-
3. Europe
- 3.1. United Kingdom
- 3.2. Germany
- 3.3. France
- 3.4. Italy
- 3.5. Spain
- 3.6. Russia
- 3.7. Benelux
- 3.8. Nordics
- 3.9. Rest of Europe
-
4. Middle East & Africa
- 4.1. Turkey
- 4.2. Israel
- 4.3. GCC
- 4.4. North Africa
- 4.5. South Africa
- 4.6. Rest of Middle East & Africa
-
5. Asia Pacific
- 5.1. China
- 5.2. India
- 5.3. Japan
- 5.4. South Korea
- 5.5. ASEAN
- 5.6. Oceania
- 5.7. Rest of Asia Pacific
Red Meat Industry Regional Market Share
Geographic Coverage of Red Meat Industry
Red Meat Industry REPORT HIGHLIGHTS
| Aspects | Details |
|---|---|
| Study Period | 2020-2034 |
| Base Year | 2025 |
| Estimated Year | 2026 |
| Forecast Period | 2026-2034 |
| Historical Period | 2020-2025 |
| Growth Rate | CAGR of 7.40% from 2020-2034 |
| Segmentation |
|
Table of Contents
- 1. Introduction
- 1.1. Research Scope
- 1.2. Market Segmentation
- 1.3. Research Objective
- 1.4. Definitions and Assumptions
- 2. Executive Summary
- 2.1. Market Snapshot
- 3. Market Dynamics
- 3.1. Market Drivers
- 3.2. Market Restrains
- 3.3. Market Trends
- 3.4. Market Opportunities
- 4. Market Factor Analysis
- 4.1. Porters Five Forces
- 4.1.1. Bargaining Power of Suppliers
- 4.1.2. Bargaining Power of Buyers
- 4.1.3. Threat of New Entrants
- 4.1.4. Threat of Substitutes
- 4.1.5. Competitive Rivalry
- 4.2. PESTEL analysis
- 4.3. BCG Analysis
- 4.3.1. Stars (High Growth, High Market Share)
- 4.3.2. Cash Cows (Low Growth, High Market Share)
- 4.3.3. Question Mark (High Growth, Low Market Share)
- 4.3.4. Dogs (Low Growth, Low Market Share)
- 4.4. Ansoff Matrix Analysis
- 4.5. Supply Chain Analysis
- 4.6. Regulatory Landscape
- 4.7. Current Market Potential and Opportunity Assessment (TAM–SAM–SOM Framework)
- 4.8. TIR Analyst Note
- 4.1. Porters Five Forces
- 5. Market Analysis, Insights and Forecast 2021-2033
- 5.1. Market Analysis, Insights and Forecast - by Type
- 5.1.1. Beef
- 5.1.2. Mutton
- 5.1.3. Pork
- 5.1.4. Other Meat
- 5.2. Market Analysis, Insights and Forecast - by Form
- 5.2.1. Canned
- 5.2.2. Fresh / Chilled
- 5.2.3. Frozen
- 5.2.4. Processed
- 5.3. Market Analysis, Insights and Forecast - by Distribution Channel
- 5.3.1. Off-Trade
- 5.3.1.1. Convenience Stores
- 5.3.1.2. Online Channel
- 5.3.1.3. Supermarkets and Hypermarkets
- 5.3.1.4. Others
- 5.3.2. On-Trade
- 5.3.1. Off-Trade
- 5.4. Market Analysis, Insights and Forecast - by Region
- 5.4.1. North America
- 5.4.2. South America
- 5.4.3. Europe
- 5.4.4. Middle East & Africa
- 5.4.5. Asia Pacific
- 5.1. Market Analysis, Insights and Forecast - by Type
- 6. Global Red Meat Industry Analysis, Insights and Forecast, 2021-2033
- 6.1. Market Analysis, Insights and Forecast - by Type
- 6.1.1. Beef
- 6.1.2. Mutton
- 6.1.3. Pork
- 6.1.4. Other Meat
- 6.2. Market Analysis, Insights and Forecast - by Form
- 6.2.1. Canned
- 6.2.2. Fresh / Chilled
- 6.2.3. Frozen
- 6.2.4. Processed
- 6.3. Market Analysis, Insights and Forecast - by Distribution Channel
- 6.3.1. Off-Trade
- 6.3.1.1. Convenience Stores
- 6.3.1.2. Online Channel
- 6.3.1.3. Supermarkets and Hypermarkets
- 6.3.1.4. Others
- 6.3.2. On-Trade
- 6.3.1. Off-Trade
- 6.1. Market Analysis, Insights and Forecast - by Type
- 7. North America Red Meat Industry Analysis, Insights and Forecast, 2020-2032
- 7.1. Market Analysis, Insights and Forecast - by Type
- 7.1.1. Beef
- 7.1.2. Mutton
- 7.1.3. Pork
- 7.1.4. Other Meat
- 7.2. Market Analysis, Insights and Forecast - by Form
- 7.2.1. Canned
- 7.2.2. Fresh / Chilled
- 7.2.3. Frozen
- 7.2.4. Processed
- 7.3. Market Analysis, Insights and Forecast - by Distribution Channel
- 7.3.1. Off-Trade
- 7.3.1.1. Convenience Stores
- 7.3.1.2. Online Channel
- 7.3.1.3. Supermarkets and Hypermarkets
- 7.3.1.4. Others
- 7.3.2. On-Trade
- 7.3.1. Off-Trade
- 7.1. Market Analysis, Insights and Forecast - by Type
- 8. South America Red Meat Industry Analysis, Insights and Forecast, 2020-2032
- 8.1. Market Analysis, Insights and Forecast - by Type
- 8.1.1. Beef
- 8.1.2. Mutton
- 8.1.3. Pork
- 8.1.4. Other Meat
- 8.2. Market Analysis, Insights and Forecast - by Form
- 8.2.1. Canned
- 8.2.2. Fresh / Chilled
- 8.2.3. Frozen
- 8.2.4. Processed
- 8.3. Market Analysis, Insights and Forecast - by Distribution Channel
- 8.3.1. Off-Trade
- 8.3.1.1. Convenience Stores
- 8.3.1.2. Online Channel
- 8.3.1.3. Supermarkets and Hypermarkets
- 8.3.1.4. Others
- 8.3.2. On-Trade
- 8.3.1. Off-Trade
- 8.1. Market Analysis, Insights and Forecast - by Type
- 9. Europe Red Meat Industry Analysis, Insights and Forecast, 2020-2032
- 9.1. Market Analysis, Insights and Forecast - by Type
- 9.1.1. Beef
- 9.1.2. Mutton
- 9.1.3. Pork
- 9.1.4. Other Meat
- 9.2. Market Analysis, Insights and Forecast - by Form
- 9.2.1. Canned
- 9.2.2. Fresh / Chilled
- 9.2.3. Frozen
- 9.2.4. Processed
- 9.3. Market Analysis, Insights and Forecast - by Distribution Channel
- 9.3.1. Off-Trade
- 9.3.1.1. Convenience Stores
- 9.3.1.2. Online Channel
- 9.3.1.3. Supermarkets and Hypermarkets
- 9.3.1.4. Others
- 9.3.2. On-Trade
- 9.3.1. Off-Trade
- 9.1. Market Analysis, Insights and Forecast - by Type
- 10. Middle East & Africa Red Meat Industry Analysis, Insights and Forecast, 2020-2032
- 10.1. Market Analysis, Insights and Forecast - by Type
- 10.1.1. Beef
- 10.1.2. Mutton
- 10.1.3. Pork
- 10.1.4. Other Meat
- 10.2. Market Analysis, Insights and Forecast - by Form
- 10.2.1. Canned
- 10.2.2. Fresh / Chilled
- 10.2.3. Frozen
- 10.2.4. Processed
- 10.3. Market Analysis, Insights and Forecast - by Distribution Channel
- 10.3.1. Off-Trade
- 10.3.1.1. Convenience Stores
- 10.3.1.2. Online Channel
- 10.3.1.3. Supermarkets and Hypermarkets
- 10.3.1.4. Others
- 10.3.2. On-Trade
- 10.3.1. Off-Trade
- 10.1. Market Analysis, Insights and Forecast - by Type
- 11. Asia Pacific Red Meat Industry Analysis, Insights and Forecast, 2020-2032
- 11.1. Market Analysis, Insights and Forecast - by Type
- 11.1.1. Beef
- 11.1.2. Mutton
- 11.1.3. Pork
- 11.1.4. Other Meat
- 11.2. Market Analysis, Insights and Forecast - by Form
- 11.2.1. Canned
- 11.2.2. Fresh / Chilled
- 11.2.3. Frozen
- 11.2.4. Processed
- 11.3. Market Analysis, Insights and Forecast - by Distribution Channel
- 11.3.1. Off-Trade
- 11.3.1.1. Convenience Stores
- 11.3.1.2. Online Channel
- 11.3.1.3. Supermarkets and Hypermarkets
- 11.3.1.4. Others
- 11.3.2. On-Trade
- 11.3.1. Off-Trade
- 11.1. Market Analysis, Insights and Forecast - by Type
- 12. Competitive Analysis
- 12.1. Company Profiles
- 12.1.1 WH Group Limite
- 12.1.1.1. Company Overview
- 12.1.1.2. Products
- 12.1.1.3. Company Financials
- 12.1.1.4. SWOT Analysis
- 12.1.2 Australian Agricultural Co Ltd
- 12.1.2.1. Company Overview
- 12.1.2.2. Products
- 12.1.2.3. Company Financials
- 12.1.2.4. SWOT Analysis
- 12.1.3 Tönnies Holding ApS & Co KG
- 12.1.3.1. Company Overview
- 12.1.3.2. Products
- 12.1.3.3. Company Financials
- 12.1.3.4. SWOT Analysis
- 12.1.4 NH Foods Ltd
- 12.1.4.1. Company Overview
- 12.1.4.2. Products
- 12.1.4.3. Company Financials
- 12.1.4.4. SWOT Analysis
- 12.1.5 Tyson Foods Inc
- 12.1.5.1. Company Overview
- 12.1.5.2. Products
- 12.1.5.3. Company Financials
- 12.1.5.4. SWOT Analysis
- 12.1.6 BRF S A
- 12.1.6.1. Company Overview
- 12.1.6.2. Products
- 12.1.6.3. Company Financials
- 12.1.6.4. SWOT Analysis
- 12.1.7 Sysco Corporation
- 12.1.7.1. Company Overview
- 12.1.7.2. Products
- 12.1.7.3. Company Financials
- 12.1.7.4. SWOT Analysis
- 12.1.8 Minerva SA
- 12.1.8.1. Company Overview
- 12.1.8.2. Products
- 12.1.8.3. Company Financials
- 12.1.8.4. SWOT Analysis
- 12.1.9 Itoham Yonekyu Holdings Inc
- 12.1.9.1. Company Overview
- 12.1.9.2. Products
- 12.1.9.3. Company Financials
- 12.1.9.4. SWOT Analysis
- 12.1.10 Hormel Foods Corporation
- 12.1.10.1. Company Overview
- 12.1.10.2. Products
- 12.1.10.3. Company Financials
- 12.1.10.4. SWOT Analysis
- 12.1.11 Cargill Inc
- 12.1.11.1. Company Overview
- 12.1.11.2. Products
- 12.1.11.3. Company Financials
- 12.1.11.4. SWOT Analysis
- 12.1.12 Starzen Co Ltd
- 12.1.12.1. Company Overview
- 12.1.12.2. Products
- 12.1.12.3. Company Financials
- 12.1.12.4. SWOT Analysis
- 12.1.13 Marfrig Global Foods S A
- 12.1.13.1. Company Overview
- 12.1.13.2. Products
- 12.1.13.3. Company Financials
- 12.1.13.4. SWOT Analysis
- 12.1.14 JBS SA
- 12.1.14.1. Company Overview
- 12.1.14.2. Products
- 12.1.14.3. Company Financials
- 12.1.14.4. SWOT Analysis
- 12.1.15 OSI Group
- 12.1.15.1. Company Overview
- 12.1.15.2. Products
- 12.1.15.3. Company Financials
- 12.1.15.4. SWOT Analysis
- 12.1.1 WH Group Limite
- 12.2. Market Entropy
- 12.2.1 Company's Key Areas Served
- 12.2.2 Recent Developments
- 12.3. Company Market Share Analysis 2025
- 12.3.1 Top 5 Companies Market Share Analysis
- 12.3.2 Top 3 Companies Market Share Analysis
- 12.4. List of Potential Customers
- 13. Research Methodology
List of Figures
- Figure 1: Global Red Meat Industry Revenue Breakdown (Million, %) by Region 2025 & 2033
- Figure 2: Global Red Meat Industry Volume Breakdown (K Tons, %) by Region 2025 & 2033
- Figure 3: North America Red Meat Industry Revenue (Million), by Type 2025 & 2033
- Figure 4: North America Red Meat Industry Volume (K Tons), by Type 2025 & 2033
- Figure 5: North America Red Meat Industry Revenue Share (%), by Type 2025 & 2033
- Figure 6: North America Red Meat Industry Volume Share (%), by Type 2025 & 2033
- Figure 7: North America Red Meat Industry Revenue (Million), by Form 2025 & 2033
- Figure 8: North America Red Meat Industry Volume (K Tons), by Form 2025 & 2033
- Figure 9: North America Red Meat Industry Revenue Share (%), by Form 2025 & 2033
- Figure 10: North America Red Meat Industry Volume Share (%), by Form 2025 & 2033
- Figure 11: North America Red Meat Industry Revenue (Million), by Distribution Channel 2025 & 2033
- Figure 12: North America Red Meat Industry Volume (K Tons), by Distribution Channel 2025 & 2033
- Figure 13: North America Red Meat Industry Revenue Share (%), by Distribution Channel 2025 & 2033
- Figure 14: North America Red Meat Industry Volume Share (%), by Distribution Channel 2025 & 2033
- Figure 15: North America Red Meat Industry Revenue (Million), by Country 2025 & 2033
- Figure 16: North America Red Meat Industry Volume (K Tons), by Country 2025 & 2033
- Figure 17: North America Red Meat Industry Revenue Share (%), by Country 2025 & 2033
- Figure 18: North America Red Meat Industry Volume Share (%), by Country 2025 & 2033
- Figure 19: South America Red Meat Industry Revenue (Million), by Type 2025 & 2033
- Figure 20: South America Red Meat Industry Volume (K Tons), by Type 2025 & 2033
- Figure 21: South America Red Meat Industry Revenue Share (%), by Type 2025 & 2033
- Figure 22: South America Red Meat Industry Volume Share (%), by Type 2025 & 2033
- Figure 23: South America Red Meat Industry Revenue (Million), by Form 2025 & 2033
- Figure 24: South America Red Meat Industry Volume (K Tons), by Form 2025 & 2033
- Figure 25: South America Red Meat Industry Revenue Share (%), by Form 2025 & 2033
- Figure 26: South America Red Meat Industry Volume Share (%), by Form 2025 & 2033
- Figure 27: South America Red Meat Industry Revenue (Million), by Distribution Channel 2025 & 2033
- Figure 28: South America Red Meat Industry Volume (K Tons), by Distribution Channel 2025 & 2033
- Figure 29: South America Red Meat Industry Revenue Share (%), by Distribution Channel 2025 & 2033
- Figure 30: South America Red Meat Industry Volume Share (%), by Distribution Channel 2025 & 2033
- Figure 31: South America Red Meat Industry Revenue (Million), by Country 2025 & 2033
- Figure 32: South America Red Meat Industry Volume (K Tons), by Country 2025 & 2033
- Figure 33: South America Red Meat Industry Revenue Share (%), by Country 2025 & 2033
- Figure 34: South America Red Meat Industry Volume Share (%), by Country 2025 & 2033
- Figure 35: Europe Red Meat Industry Revenue (Million), by Type 2025 & 2033
- Figure 36: Europe Red Meat Industry Volume (K Tons), by Type 2025 & 2033
- Figure 37: Europe Red Meat Industry Revenue Share (%), by Type 2025 & 2033
- Figure 38: Europe Red Meat Industry Volume Share (%), by Type 2025 & 2033
- Figure 39: Europe Red Meat Industry Revenue (Million), by Form 2025 & 2033
- Figure 40: Europe Red Meat Industry Volume (K Tons), by Form 2025 & 2033
- Figure 41: Europe Red Meat Industry Revenue Share (%), by Form 2025 & 2033
- Figure 42: Europe Red Meat Industry Volume Share (%), by Form 2025 & 2033
- Figure 43: Europe Red Meat Industry Revenue (Million), by Distribution Channel 2025 & 2033
- Figure 44: Europe Red Meat Industry Volume (K Tons), by Distribution Channel 2025 & 2033
- Figure 45: Europe Red Meat Industry Revenue Share (%), by Distribution Channel 2025 & 2033
- Figure 46: Europe Red Meat Industry Volume Share (%), by Distribution Channel 2025 & 2033
- Figure 47: Europe Red Meat Industry Revenue (Million), by Country 2025 & 2033
- Figure 48: Europe Red Meat Industry Volume (K Tons), by Country 2025 & 2033
- Figure 49: Europe Red Meat Industry Revenue Share (%), by Country 2025 & 2033
- Figure 50: Europe Red Meat Industry Volume Share (%), by Country 2025 & 2033
- Figure 51: Middle East & Africa Red Meat Industry Revenue (Million), by Type 2025 & 2033
- Figure 52: Middle East & Africa Red Meat Industry Volume (K Tons), by Type 2025 & 2033
- Figure 53: Middle East & Africa Red Meat Industry Revenue Share (%), by Type 2025 & 2033
- Figure 54: Middle East & Africa Red Meat Industry Volume Share (%), by Type 2025 & 2033
- Figure 55: Middle East & Africa Red Meat Industry Revenue (Million), by Form 2025 & 2033
- Figure 56: Middle East & Africa Red Meat Industry Volume (K Tons), by Form 2025 & 2033
- Figure 57: Middle East & Africa Red Meat Industry Revenue Share (%), by Form 2025 & 2033
- Figure 58: Middle East & Africa Red Meat Industry Volume Share (%), by Form 2025 & 2033
- Figure 59: Middle East & Africa Red Meat Industry Revenue (Million), by Distribution Channel 2025 & 2033
- Figure 60: Middle East & Africa Red Meat Industry Volume (K Tons), by Distribution Channel 2025 & 2033
- Figure 61: Middle East & Africa Red Meat Industry Revenue Share (%), by Distribution Channel 2025 & 2033
- Figure 62: Middle East & Africa Red Meat Industry Volume Share (%), by Distribution Channel 2025 & 2033
- Figure 63: Middle East & Africa Red Meat Industry Revenue (Million), by Country 2025 & 2033
- Figure 64: Middle East & Africa Red Meat Industry Volume (K Tons), by Country 2025 & 2033
- Figure 65: Middle East & Africa Red Meat Industry Revenue Share (%), by Country 2025 & 2033
- Figure 66: Middle East & Africa Red Meat Industry Volume Share (%), by Country 2025 & 2033
- Figure 67: Asia Pacific Red Meat Industry Revenue (Million), by Type 2025 & 2033
- Figure 68: Asia Pacific Red Meat Industry Volume (K Tons), by Type 2025 & 2033
- Figure 69: Asia Pacific Red Meat Industry Revenue Share (%), by Type 2025 & 2033
- Figure 70: Asia Pacific Red Meat Industry Volume Share (%), by Type 2025 & 2033
- Figure 71: Asia Pacific Red Meat Industry Revenue (Million), by Form 2025 & 2033
- Figure 72: Asia Pacific Red Meat Industry Volume (K Tons), by Form 2025 & 2033
- Figure 73: Asia Pacific Red Meat Industry Revenue Share (%), by Form 2025 & 2033
- Figure 74: Asia Pacific Red Meat Industry Volume Share (%), by Form 2025 & 2033
- Figure 75: Asia Pacific Red Meat Industry Revenue (Million), by Distribution Channel 2025 & 2033
- Figure 76: Asia Pacific Red Meat Industry Volume (K Tons), by Distribution Channel 2025 & 2033
- Figure 77: Asia Pacific Red Meat Industry Revenue Share (%), by Distribution Channel 2025 & 2033
- Figure 78: Asia Pacific Red Meat Industry Volume Share (%), by Distribution Channel 2025 & 2033
- Figure 79: Asia Pacific Red Meat Industry Revenue (Million), by Country 2025 & 2033
- Figure 80: Asia Pacific Red Meat Industry Volume (K Tons), by Country 2025 & 2033
- Figure 81: Asia Pacific Red Meat Industry Revenue Share (%), by Country 2025 & 2033
- Figure 82: Asia Pacific Red Meat Industry Volume Share (%), by Country 2025 & 2033
List of Tables
- Table 1: Global Red Meat Industry Revenue Million Forecast, by Type 2020 & 2033
- Table 2: Global Red Meat Industry Volume K Tons Forecast, by Type 2020 & 2033
- Table 3: Global Red Meat Industry Revenue Million Forecast, by Form 2020 & 2033
- Table 4: Global Red Meat Industry Volume K Tons Forecast, by Form 2020 & 2033
- Table 5: Global Red Meat Industry Revenue Million Forecast, by Distribution Channel 2020 & 2033
- Table 6: Global Red Meat Industry Volume K Tons Forecast, by Distribution Channel 2020 & 2033
- Table 7: Global Red Meat Industry Revenue Million Forecast, by Region 2020 & 2033
- Table 8: Global Red Meat Industry Volume K Tons Forecast, by Region 2020 & 2033
- Table 9: Global Red Meat Industry Revenue Million Forecast, by Type 2020 & 2033
- Table 10: Global Red Meat Industry Volume K Tons Forecast, by Type 2020 & 2033
- Table 11: Global Red Meat Industry Revenue Million Forecast, by Form 2020 & 2033
- Table 12: Global Red Meat Industry Volume K Tons Forecast, by Form 2020 & 2033
- Table 13: Global Red Meat Industry Revenue Million Forecast, by Distribution Channel 2020 & 2033
- Table 14: Global Red Meat Industry Volume K Tons Forecast, by Distribution Channel 2020 & 2033
- Table 15: Global Red Meat Industry Revenue Million Forecast, by Country 2020 & 2033
- Table 16: Global Red Meat Industry Volume K Tons Forecast, by Country 2020 & 2033
- Table 17: United States Red Meat Industry Revenue (Million) Forecast, by Application 2020 & 2033
- Table 18: United States Red Meat Industry Volume (K Tons) Forecast, by Application 2020 & 2033
- Table 19: Canada Red Meat Industry Revenue (Million) Forecast, by Application 2020 & 2033
- Table 20: Canada Red Meat Industry Volume (K Tons) Forecast, by Application 2020 & 2033
- Table 21: Mexico Red Meat Industry Revenue (Million) Forecast, by Application 2020 & 2033
- Table 22: Mexico Red Meat Industry Volume (K Tons) Forecast, by Application 2020 & 2033
- Table 23: Global Red Meat Industry Revenue Million Forecast, by Type 2020 & 2033
- Table 24: Global Red Meat Industry Volume K Tons Forecast, by Type 2020 & 2033
- Table 25: Global Red Meat Industry Revenue Million Forecast, by Form 2020 & 2033
- Table 26: Global Red Meat Industry Volume K Tons Forecast, by Form 2020 & 2033
- Table 27: Global Red Meat Industry Revenue Million Forecast, by Distribution Channel 2020 & 2033
- Table 28: Global Red Meat Industry Volume K Tons Forecast, by Distribution Channel 2020 & 2033
- Table 29: Global Red Meat Industry Revenue Million Forecast, by Country 2020 & 2033
- Table 30: Global Red Meat Industry Volume K Tons Forecast, by Country 2020 & 2033
- Table 31: Brazil Red Meat Industry Revenue (Million) Forecast, by Application 2020 & 2033
- Table 32: Brazil Red Meat Industry Volume (K Tons) Forecast, by Application 2020 & 2033
- Table 33: Argentina Red Meat Industry Revenue (Million) Forecast, by Application 2020 & 2033
- Table 34: Argentina Red Meat Industry Volume (K Tons) Forecast, by Application 2020 & 2033
- Table 35: Rest of South America Red Meat Industry Revenue (Million) Forecast, by Application 2020 & 2033
- Table 36: Rest of South America Red Meat Industry Volume (K Tons) Forecast, by Application 2020 & 2033
- Table 37: Global Red Meat Industry Revenue Million Forecast, by Type 2020 & 2033
- Table 38: Global Red Meat Industry Volume K Tons Forecast, by Type 2020 & 2033
- Table 39: Global Red Meat Industry Revenue Million Forecast, by Form 2020 & 2033
- Table 40: Global Red Meat Industry Volume K Tons Forecast, by Form 2020 & 2033
- Table 41: Global Red Meat Industry Revenue Million Forecast, by Distribution Channel 2020 & 2033
- Table 42: Global Red Meat Industry Volume K Tons Forecast, by Distribution Channel 2020 & 2033
- Table 43: Global Red Meat Industry Revenue Million Forecast, by Country 2020 & 2033
- Table 44: Global Red Meat Industry Volume K Tons Forecast, by Country 2020 & 2033
- Table 45: United Kingdom Red Meat Industry Revenue (Million) Forecast, by Application 2020 & 2033
- Table 46: United Kingdom Red Meat Industry Volume (K Tons) Forecast, by Application 2020 & 2033
- Table 47: Germany Red Meat Industry Revenue (Million) Forecast, by Application 2020 & 2033
- Table 48: Germany Red Meat Industry Volume (K Tons) Forecast, by Application 2020 & 2033
- Table 49: France Red Meat Industry Revenue (Million) Forecast, by Application 2020 & 2033
- Table 50: France Red Meat Industry Volume (K Tons) Forecast, by Application 2020 & 2033
- Table 51: Italy Red Meat Industry Revenue (Million) Forecast, by Application 2020 & 2033
- Table 52: Italy Red Meat Industry Volume (K Tons) Forecast, by Application 2020 & 2033
- Table 53: Spain Red Meat Industry Revenue (Million) Forecast, by Application 2020 & 2033
- Table 54: Spain Red Meat Industry Volume (K Tons) Forecast, by Application 2020 & 2033
- Table 55: Russia Red Meat Industry Revenue (Million) Forecast, by Application 2020 & 2033
- Table 56: Russia Red Meat Industry Volume (K Tons) Forecast, by Application 2020 & 2033
- Table 57: Benelux Red Meat Industry Revenue (Million) Forecast, by Application 2020 & 2033
- Table 58: Benelux Red Meat Industry Volume (K Tons) Forecast, by Application 2020 & 2033
- Table 59: Nordics Red Meat Industry Revenue (Million) Forecast, by Application 2020 & 2033
- Table 60: Nordics Red Meat Industry Volume (K Tons) Forecast, by Application 2020 & 2033
- Table 61: Rest of Europe Red Meat Industry Revenue (Million) Forecast, by Application 2020 & 2033
- Table 62: Rest of Europe Red Meat Industry Volume (K Tons) Forecast, by Application 2020 & 2033
- Table 63: Global Red Meat Industry Revenue Million Forecast, by Type 2020 & 2033
- Table 64: Global Red Meat Industry Volume K Tons Forecast, by Type 2020 & 2033
- Table 65: Global Red Meat Industry Revenue Million Forecast, by Form 2020 & 2033
- Table 66: Global Red Meat Industry Volume K Tons Forecast, by Form 2020 & 2033
- Table 67: Global Red Meat Industry Revenue Million Forecast, by Distribution Channel 2020 & 2033
- Table 68: Global Red Meat Industry Volume K Tons Forecast, by Distribution Channel 2020 & 2033
- Table 69: Global Red Meat Industry Revenue Million Forecast, by Country 2020 & 2033
- Table 70: Global Red Meat Industry Volume K Tons Forecast, by Country 2020 & 2033
- Table 71: Turkey Red Meat Industry Revenue (Million) Forecast, by Application 2020 & 2033
- Table 72: Turkey Red Meat Industry Volume (K Tons) Forecast, by Application 2020 & 2033
- Table 73: Israel Red Meat Industry Revenue (Million) Forecast, by Application 2020 & 2033
- Table 74: Israel Red Meat Industry Volume (K Tons) Forecast, by Application 2020 & 2033
- Table 75: GCC Red Meat Industry Revenue (Million) Forecast, by Application 2020 & 2033
- Table 76: GCC Red Meat Industry Volume (K Tons) Forecast, by Application 2020 & 2033
- Table 77: North Africa Red Meat Industry Revenue (Million) Forecast, by Application 2020 & 2033
- Table 78: North Africa Red Meat Industry Volume (K Tons) Forecast, by Application 2020 & 2033
- Table 79: South Africa Red Meat Industry Revenue (Million) Forecast, by Application 2020 & 2033
- Table 80: South Africa Red Meat Industry Volume (K Tons) Forecast, by Application 2020 & 2033
- Table 81: Rest of Middle East & Africa Red Meat Industry Revenue (Million) Forecast, by Application 2020 & 2033
- Table 82: Rest of Middle East & Africa Red Meat Industry Volume (K Tons) Forecast, by Application 2020 & 2033
- Table 83: Global Red Meat Industry Revenue Million Forecast, by Type 2020 & 2033
- Table 84: Global Red Meat Industry Volume K Tons Forecast, by Type 2020 & 2033
- Table 85: Global Red Meat Industry Revenue Million Forecast, by Form 2020 & 2033
- Table 86: Global Red Meat Industry Volume K Tons Forecast, by Form 2020 & 2033
- Table 87: Global Red Meat Industry Revenue Million Forecast, by Distribution Channel 2020 & 2033
- Table 88: Global Red Meat Industry Volume K Tons Forecast, by Distribution Channel 2020 & 2033
- Table 89: Global Red Meat Industry Revenue Million Forecast, by Country 2020 & 2033
- Table 90: Global Red Meat Industry Volume K Tons Forecast, by Country 2020 & 2033
- Table 91: China Red Meat Industry Revenue (Million) Forecast, by Application 2020 & 2033
- Table 92: China Red Meat Industry Volume (K Tons) Forecast, by Application 2020 & 2033
- Table 93: India Red Meat Industry Revenue (Million) Forecast, by Application 2020 & 2033
- Table 94: India Red Meat Industry Volume (K Tons) Forecast, by Application 2020 & 2033
- Table 95: Japan Red Meat Industry Revenue (Million) Forecast, by Application 2020 & 2033
- Table 96: Japan Red Meat Industry Volume (K Tons) Forecast, by Application 2020 & 2033
- Table 97: South Korea Red Meat Industry Revenue (Million) Forecast, by Application 2020 & 2033
- Table 98: South Korea Red Meat Industry Volume (K Tons) Forecast, by Application 2020 & 2033
- Table 99: ASEAN Red Meat Industry Revenue (Million) Forecast, by Application 2020 & 2033
- Table 100: ASEAN Red Meat Industry Volume (K Tons) Forecast, by Application 2020 & 2033
- Table 101: Oceania Red Meat Industry Revenue (Million) Forecast, by Application 2020 & 2033
- Table 102: Oceania Red Meat Industry Volume (K Tons) Forecast, by Application 2020 & 2033
- Table 103: Rest of Asia Pacific Red Meat Industry Revenue (Million) Forecast, by Application 2020 & 2033
- Table 104: Rest of Asia Pacific Red Meat Industry Volume (K Tons) Forecast, by Application 2020 & 2033
Frequently Asked Questions
1. What is the projected Compound Annual Growth Rate (CAGR) of the Red Meat Industry?
The projected CAGR is approximately 7.40%.
2. Which companies are prominent players in the Red Meat Industry?
Key companies in the market include WH Group Limite, Australian Agricultural Co Ltd, Tönnies Holding ApS & Co KG, NH Foods Ltd, Tyson Foods Inc, BRF S A, Sysco Corporation, Minerva SA, Itoham Yonekyu Holdings Inc, Hormel Foods Corporation, Cargill Inc, Starzen Co Ltd, Marfrig Global Foods S A, JBS SA, OSI Group.
3. What are the main segments of the Red Meat Industry?
The market segments include Type, Form, Distribution Channel.
4. Can you provide details about the market size?
The market size is estimated to be USD 800,000 Million as of 2022.
5. What are some drivers contributing to market growth?
Increased Consumption of Baked Goods; Demand for Indigenous Fermented Foods.
6. What are the notable trends driving market growth?
OTHER KEY INDUSTRY TRENDS COVERED IN THE REPORT.
7. Are there any restraints impacting market growth?
Potential Side-effects of Yeast.
8. Can you provide examples of recent developments in the market?
November 2023: Tyson Foods announced plans to build new production facilities in China and Thailand and expand its facility in the Netherlands. The latest expansions, adds over 100,000 tones of fully cooked poultry capacity. The new plant in China and Thailand is expected to create more than 700, 1000 jobs respectively and the European expansion will add more than 150 jobs
9. What pricing options are available for accessing the report?
Pricing options include single-user, multi-user, and enterprise licenses priced at USD 3800, USD 4500, and USD 5800 respectively.
10. Is the market size provided in terms of value or volume?
The market size is provided in terms of value, measured in Million and volume, measured in K Tons.
11. Are there any specific market keywords associated with the report?
Yes, the market keyword associated with the report is "Red Meat Industry," which aids in identifying and referencing the specific market segment covered.
12. How do I determine which pricing option suits my needs best?
The pricing options vary based on user requirements and access needs. Individual users may opt for single-user licenses, while businesses requiring broader access may choose multi-user or enterprise licenses for cost-effective access to the report.
13. Are there any additional resources or data provided in the Red Meat Industry report?
While the report offers comprehensive insights, it's advisable to review the specific contents or supplementary materials provided to ascertain if additional resources or data are available.
14. How can I stay updated on further developments or reports in the Red Meat Industry?
To stay informed about further developments, trends, and reports in the Red Meat Industry, consider subscribing to industry newsletters, following relevant companies and organizations, or regularly checking reputable industry news sources and publications.
Methodology
Step 1 - Identification of Relevant Samples Size from Population Database


Step 2 - Approaches for Defining Global Market Size (Value, Volume* & Price*)

Note*: In applicable scenarios
Step 3 - Data Sources
Primary Research
- Web Analytics
- Survey Reports
- Research Institute
- Latest Research Reports
- Opinion Leaders
Secondary Research
- Annual Reports
- White Paper
- Latest Press Release
- Industry Association
- Paid Database
- Investor Presentations

Step 4 - Data Triangulation
Involves using different sources of information in order to increase the validity of a study
These sources are likely to be stakeholders in a program - participants, other researchers, program staff, other community members, and so on.
Then we put all data in single framework & apply various statistical tools to find out the dynamic on the market.
During the analysis stage, feedback from the stakeholder groups would be compared to determine areas of agreement as well as areas of divergence