

Key Insights
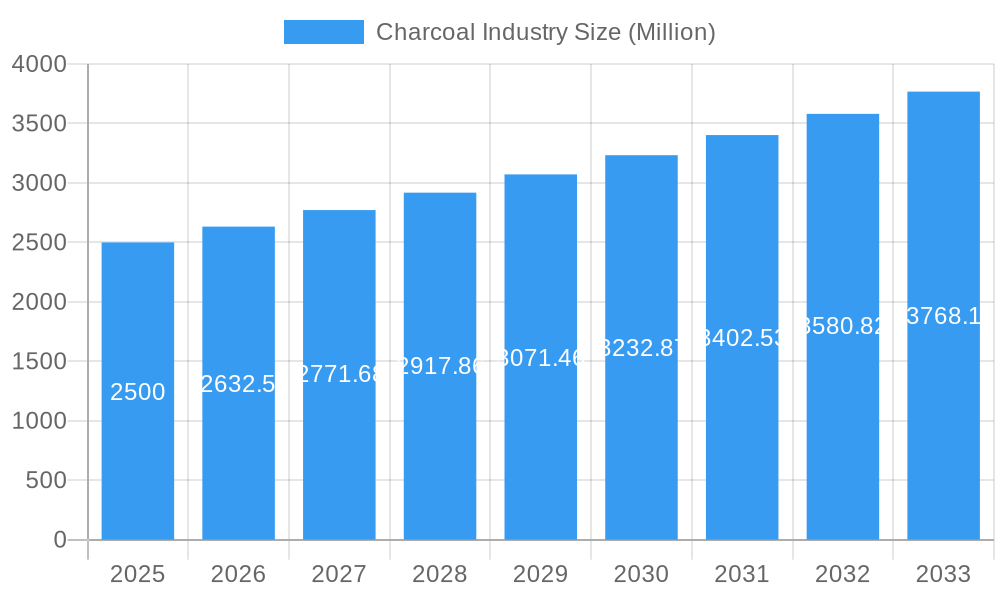
The global activated charcoal market is projected to reach $73.15 million by 2025, with an estimated compound annual growth rate (CAGR) of 4.12% between 2025 and 2033. This growth is driven by heightened consumer awareness of activated charcoal's health benefits, including its detoxification properties and applications in wellness products. The increasing incidence of digestive issues and the demand for natural remedies further fuel market expansion. Additionally, the growing popularity of activated charcoal in beauty and personal care products, such as facial masks and toothpaste, is broadening its market reach. The market is segmented by form (capsules, tablets, powders) and distribution channels (pharmacies, supermarkets, online retailers). While online retail demonstrates rapid growth, pharmacies remain the dominant distribution channel. Growth is anticipated across all regions, with North America and Europe currently leading due to elevated consumer awareness and disposable income. However, the Asia-Pacific region is poised for substantial growth, driven by increasing health consciousness and demand for functional foods and dietary supplements. Challenges include potential side effect concerns and the necessity for stringent quality control and regulation to ensure consumer trust.

Charcoal Industry Market Size (In Million)
The competitive landscape is characterized by a mix of established and emerging brands. Key players such as Holland & Barrett, Bulletproof 360, and Forza Industries are capitalizing on brand recognition and established distribution networks. Concurrently, smaller companies focusing on organic and sustainably sourced activated charcoal are gaining traction by catering to the growing consumer preference for natural and ethically produced goods. Sustaining consumer trust through rigorous quality control, transparent sourcing, and ongoing research into health benefits and applications is crucial for the market's future. Addressing safety and efficacy concerns while promoting responsible usage guidelines, alongside innovation in product formats and applications, particularly within the beauty and personal care sectors, will be vital for continued market expansion.
Charcoal Industry Company Market Share
Dynamic Charcoal Industry Market Report: 2019-2033
This comprehensive report provides an in-depth analysis of the global charcoal industry, projecting a market value exceeding $XX Million by 2033. Leveraging data from 2019-2024 (historical period), with 2025 as the base and estimated year, this report forecasts market trends until 2033, offering invaluable insights for investors, businesses, and industry stakeholders. Key players such as Holland & Barrett Retail Limited, Bulletproof 360 Inc, Forza Industries Ltd, Country Life LLC, Nature's Way Products LLC, Swanson, Schizandu Organics, and Sona are analyzed, providing a comprehensive understanding of the competitive landscape.
Charcoal Industry Market Structure & Competitive Landscape
The global charcoal industry exhibits a moderately concentrated market structure in 2025, with a Herfindahl-Hirschman Index (HHI) estimated at xx. Key drivers of innovation include the development of sustainable charcoal production methods and the expansion of applications beyond traditional uses. Regulatory impacts vary significantly across regions, with some jurisdictions imposing strict environmental regulations on charcoal production and distribution. Product substitutes, such as biofuels and other renewable energy sources, pose a moderate threat to market growth. End-user segmentation is diverse, encompassing households, industrial applications, and specialized sectors like the food and beverage industry. M&A activity in the charcoal industry has been relatively low in recent years, with an estimated xx million USD in deal value between 2019 and 2024, indicating a potential for consolidation in the coming years.
- Market Concentration: HHI estimated at xx in 2025.
- Innovation Drivers: Sustainable production methods, expanded applications.
- Regulatory Impacts: Vary significantly across regions, impacting production and distribution.
- Product Substitutes: Biofuels, renewable energy sources present a moderate threat.
- End-User Segmentation: Households, industrial, food & beverage.
- M&A Activity: Estimated xx million USD in deal value (2019-2024).
Charcoal Industry Market Trends & Opportunities
The global charcoal market is experiencing robust growth, with a projected Compound Annual Growth Rate (CAGR) of xx% during the forecast period (2025-2033). This growth is fueled by increasing demand from various sectors, including households, restaurants, and industries. Technological advancements in charcoal production, focusing on efficiency and sustainability, are driving market expansion. Consumer preferences are shifting towards higher-quality, sustainably sourced charcoal, creating opportunities for premium product offerings. Competitive dynamics are characterized by both price competition and differentiation based on quality, sustainability, and brand recognition. Market penetration rates are expected to increase significantly in developing economies with growing disposable incomes and increasing demand. The market size is projected to reach $XX Million by 2033, driven by these factors.
Dominant Markets & Segments in Charcoal Industry
The North American region is currently the dominant market for charcoal, representing approximately xx% of global market share in 2025. Within this region, the United States holds the largest national market share. In terms of segment analysis:
- By Form: The capsule segment is experiencing faster growth than the tablet segment due to ease of consumption and enhanced convenience.
- By Distribution Channel: Online retailers are experiencing significant growth owing to increased e-commerce penetration and convenient home delivery options. Pharmacies & drug stores maintain a substantial market share due to established distribution networks. Supermarket/hypermarkets also represent a crucial distribution channel.
Key Growth Drivers:
- Increased Consumer Awareness: Growing awareness of the benefits of charcoal in various applications.
- Rising Disposable Incomes: Higher disposable incomes in developing economies stimulate demand.
- Technological Advancements: Improved production methods and sustainable sourcing.
Charcoal Industry Product Analysis
Product innovation in the charcoal industry focuses on enhancing quality, sustainability, and convenience. Technological advancements include improved carbonization processes, resulting in higher-quality charcoal with greater energy efficiency. This innovation is directly impacting market fit by meeting the growing consumer demand for eco-friendly and high-performing products. New applications are expanding beyond traditional grilling to include water filtration and other niche uses, driving market diversification.
Key Drivers, Barriers & Challenges in Charcoal Industry
Key Drivers:
- Growing consumer demand from various sectors.
- Technological advancements in production and sourcing.
- Increasing environmental concerns, driving demand for sustainable charcoal.
Key Challenges:
- Fluctuations in raw material prices. This has impacted profitability margins by approximately xx% in 2024.
- Stringent environmental regulations in some regions.
- Intense competition from substitute products.
Growth Drivers in the Charcoal Industry Market
The key drivers for charcoal industry growth are rising consumer demand fueled by increasing disposable incomes and expanding applications. Technological advancements in sustainable and efficient production contribute significantly. Government policies promoting sustainable energy sources also play a crucial role. Moreover, the rising popularity of outdoor cooking and grilling further boosts demand.
Challenges Impacting Charcoal Industry Growth
Significant challenges include volatility in raw material costs, leading to price fluctuations. Environmental regulations vary across regions, posing operational hurdles and impacting production costs. Intense competition from alternative fuel sources and substitutes further constrains market expansion. Supply chain disruptions due to global events can affect availability and price stability.
Key Players Shaping the Charcoal Industry Market
- Holland & Barrett Retail Limited
- Bulletproof 360 Inc
- Forza Industries Ltd
- Country Life LLC
- Nature's Way Products LLC
- Swanson
- Schizandu Organics
- Sona
Significant Charcoal Industry Industry Milestones
- 2020: Increased focus on sustainable charcoal production practices.
- 2022: Introduction of innovative charcoal briquettes with enhanced burning time and efficiency.
- 2023: Several major players launched new product lines focusing on eco-friendly and high-quality charcoal.
Future Outlook for Charcoal Industry Market
The charcoal industry is poised for continued growth, driven by increasing consumer demand, technological advancements, and the growing focus on sustainability. Strategic partnerships and product diversification are expected to be key growth catalysts. The market presents promising opportunities for businesses that can effectively address the challenges related to raw material sourcing, environmental regulations, and competition. The global market is projected to reach $XX Million by 2033.
Charcoal Industry Segmentation
-
1. Form
- 1.1. Capsules
- 1.2. Tablets
-
2. Distribution Channel
- 2.1. Pharmacies & Drug Stores
- 2.2. Supermarket/Hypermarket
- 2.3. Online Retailers
- 2.4. Other Distribution Channels
Charcoal Industry Segmentation By Geography
-
1. North America
- 1.1. United States
- 1.2. Canada
- 1.3. Mexico
- 1.4. Rest of North America
-
2. Europe
- 2.1. Spain
- 2.2. United Kingdom
- 2.3. Germany
- 2.4. France
- 2.5. Italy
- 2.6. Russia
- 2.7. Rest of Europe
-
3. Asia Pacific
- 3.1. China
- 3.2. Japan
- 3.3. India
- 3.4. Australia
- 3.5. Rest of Asia Pacific
-
4. South America
- 4.1. Brazil
- 4.2. Argentina
- 4.3. Rest of South America
-
5. Middle East and Africa
- 5.1. South Africa
- 5.2. Saudi Arabia
- 5.3. Rest of Middle East and Africa
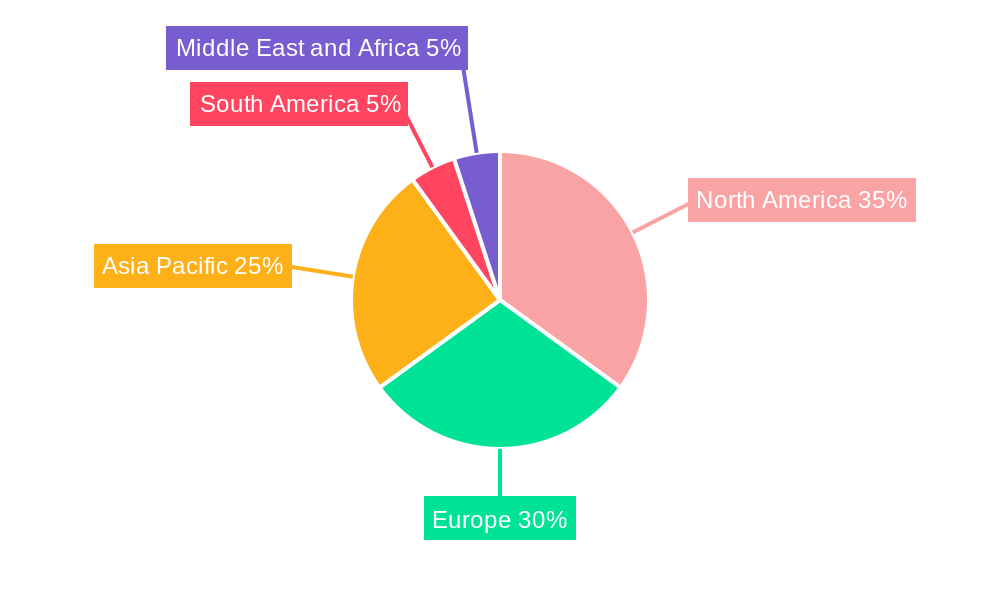
Charcoal Industry Regional Market Share
Geographic Coverage of Charcoal Industry
Charcoal Industry REPORT HIGHLIGHTS
| Aspects | Details |
|---|---|
| Study Period | 2020-2034 |
| Base Year | 2025 |
| Estimated Year | 2026 |
| Forecast Period | 2026-2034 |
| Historical Period | 2020-2025 |
| Growth Rate | CAGR of 4.12% from 2020-2034 |
| Segmentation |
|
Table of Contents
- 1. Introduction
- 1.1. Research Scope
- 1.2. Market Segmentation
- 1.3. Research Objective
- 1.4. Definitions and Assumptions
- 2. Executive Summary
- 2.1. Market Snapshot
- 3. Market Dynamics
- 3.1. Market Drivers
- 3.2. Market Restrains
- 3.3. Market Trends
- 3.4. Market Opportunities
- 4. Market Factor Analysis
- 4.1. Porters Five Forces
- 4.1.1. Bargaining Power of Suppliers
- 4.1.2. Bargaining Power of Buyers
- 4.1.3. Threat of New Entrants
- 4.1.4. Threat of Substitutes
- 4.1.5. Competitive Rivalry
- 4.2. PESTEL analysis
- 4.3. BCG Analysis
- 4.3.1. Stars (High Growth, High Market Share)
- 4.3.2. Cash Cows (Low Growth, High Market Share)
- 4.3.3. Question Mark (High Growth, Low Market Share)
- 4.3.4. Dogs (Low Growth, Low Market Share)
- 4.4. Ansoff Matrix Analysis
- 4.5. Supply Chain Analysis
- 4.6. Regulatory Landscape
- 4.7. Current Market Potential and Opportunity Assessment (TAM–SAM–SOM Framework)
- 4.8. TIR Analyst Note
- 4.1. Porters Five Forces
- 5. Market Analysis, Insights and Forecast 2021-2033
- 5.1. Market Analysis, Insights and Forecast - by Form
- 5.1.1. Capsules
- 5.1.2. Tablets
- 5.2. Market Analysis, Insights and Forecast - by Distribution Channel
- 5.2.1. Pharmacies & Drug Stores
- 5.2.2. Supermarket/Hypermarket
- 5.2.3. Online Retailers
- 5.2.4. Other Distribution Channels
- 5.3. Market Analysis, Insights and Forecast - by Region
- 5.3.1. North America
- 5.3.2. Europe
- 5.3.3. Asia Pacific
- 5.3.4. South America
- 5.3.5. Middle East and Africa
- 5.1. Market Analysis, Insights and Forecast - by Form
- 6. Global Charcoal Industry Analysis, Insights and Forecast, 2021-2033
- 6.1. Market Analysis, Insights and Forecast - by Form
- 6.1.1. Capsules
- 6.1.2. Tablets
- 6.2. Market Analysis, Insights and Forecast - by Distribution Channel
- 6.2.1. Pharmacies & Drug Stores
- 6.2.2. Supermarket/Hypermarket
- 6.2.3. Online Retailers
- 6.2.4. Other Distribution Channels
- 6.1. Market Analysis, Insights and Forecast - by Form
- 7. North America Charcoal Industry Analysis, Insights and Forecast, 2020-2032
- 7.1. Market Analysis, Insights and Forecast - by Form
- 7.1.1. Capsules
- 7.1.2. Tablets
- 7.2. Market Analysis, Insights and Forecast - by Distribution Channel
- 7.2.1. Pharmacies & Drug Stores
- 7.2.2. Supermarket/Hypermarket
- 7.2.3. Online Retailers
- 7.2.4. Other Distribution Channels
- 7.1. Market Analysis, Insights and Forecast - by Form
- 8. Europe Charcoal Industry Analysis, Insights and Forecast, 2020-2032
- 8.1. Market Analysis, Insights and Forecast - by Form
- 8.1.1. Capsules
- 8.1.2. Tablets
- 8.2. Market Analysis, Insights and Forecast - by Distribution Channel
- 8.2.1. Pharmacies & Drug Stores
- 8.2.2. Supermarket/Hypermarket
- 8.2.3. Online Retailers
- 8.2.4. Other Distribution Channels
- 8.1. Market Analysis, Insights and Forecast - by Form
- 9. Asia Pacific Charcoal Industry Analysis, Insights and Forecast, 2020-2032
- 9.1. Market Analysis, Insights and Forecast - by Form
- 9.1.1. Capsules
- 9.1.2. Tablets
- 9.2. Market Analysis, Insights and Forecast - by Distribution Channel
- 9.2.1. Pharmacies & Drug Stores
- 9.2.2. Supermarket/Hypermarket
- 9.2.3. Online Retailers
- 9.2.4. Other Distribution Channels
- 9.1. Market Analysis, Insights and Forecast - by Form
- 10. South America Charcoal Industry Analysis, Insights and Forecast, 2020-2032
- 10.1. Market Analysis, Insights and Forecast - by Form
- 10.1.1. Capsules
- 10.1.2. Tablets
- 10.2. Market Analysis, Insights and Forecast - by Distribution Channel
- 10.2.1. Pharmacies & Drug Stores
- 10.2.2. Supermarket/Hypermarket
- 10.2.3. Online Retailers
- 10.2.4. Other Distribution Channels
- 10.1. Market Analysis, Insights and Forecast - by Form
- 11. Middle East and Africa Charcoal Industry Analysis, Insights and Forecast, 2020-2032
- 11.1. Market Analysis, Insights and Forecast - by Form
- 11.1.1. Capsules
- 11.1.2. Tablets
- 11.2. Market Analysis, Insights and Forecast - by Distribution Channel
- 11.2.1. Pharmacies & Drug Stores
- 11.2.2. Supermarket/Hypermarket
- 11.2.3. Online Retailers
- 11.2.4. Other Distribution Channels
- 11.1. Market Analysis, Insights and Forecast - by Form
- 12. Competitive Analysis
- 12.1. Company Profiles
- 12.1.1 Holland & Barrett Retail Limited
- 12.1.1.1. Company Overview
- 12.1.1.2. Products
- 12.1.1.3. Company Financials
- 12.1.1.4. SWOT Analysis
- 12.1.2 Bulletproof 360 Inc *List Not Exhaustive
- 12.1.2.1. Company Overview
- 12.1.2.2. Products
- 12.1.2.3. Company Financials
- 12.1.2.4. SWOT Analysis
- 12.1.3 Forza Industries Ltd
- 12.1.3.1. Company Overview
- 12.1.3.2. Products
- 12.1.3.3. Company Financials
- 12.1.3.4. SWOT Analysis
- 12.1.4 Country Life LLC
- 12.1.4.1. Company Overview
- 12.1.4.2. Products
- 12.1.4.3. Company Financials
- 12.1.4.4. SWOT Analysis
- 12.1.5 Nature's Way Products LLC
- 12.1.5.1. Company Overview
- 12.1.5.2. Products
- 12.1.5.3. Company Financials
- 12.1.5.4. SWOT Analysis
- 12.1.6 Swanson
- 12.1.6.1. Company Overview
- 12.1.6.2. Products
- 12.1.6.3. Company Financials
- 12.1.6.4. SWOT Analysis
- 12.1.7 Schizandu Organics
- 12.1.7.1. Company Overview
- 12.1.7.2. Products
- 12.1.7.3. Company Financials
- 12.1.7.4. SWOT Analysis
- 12.1.8 Sona
- 12.1.8.1. Company Overview
- 12.1.8.2. Products
- 12.1.8.3. Company Financials
- 12.1.8.4. SWOT Analysis
- 12.1.1 Holland & Barrett Retail Limited
- 12.2. Market Entropy
- 12.2.1 Company's Key Areas Served
- 12.2.2 Recent Developments
- 12.3. Company Market Share Analysis 2025
- 12.3.1 Top 5 Companies Market Share Analysis
- 12.3.2 Top 3 Companies Market Share Analysis
- 12.4. List of Potential Customers
- 13. Research Methodology
List of Figures
- Figure 1: Global Charcoal Industry Revenue Breakdown (million, %) by Region 2025 & 2033
- Figure 2: North America Charcoal Industry Revenue (million), by Form 2025 & 2033
- Figure 3: North America Charcoal Industry Revenue Share (%), by Form 2025 & 2033
- Figure 4: North America Charcoal Industry Revenue (million), by Distribution Channel 2025 & 2033
- Figure 5: North America Charcoal Industry Revenue Share (%), by Distribution Channel 2025 & 2033
- Figure 6: North America Charcoal Industry Revenue (million), by Country 2025 & 2033
- Figure 7: North America Charcoal Industry Revenue Share (%), by Country 2025 & 2033
- Figure 8: Europe Charcoal Industry Revenue (million), by Form 2025 & 2033
- Figure 9: Europe Charcoal Industry Revenue Share (%), by Form 2025 & 2033
- Figure 10: Europe Charcoal Industry Revenue (million), by Distribution Channel 2025 & 2033
- Figure 11: Europe Charcoal Industry Revenue Share (%), by Distribution Channel 2025 & 2033
- Figure 12: Europe Charcoal Industry Revenue (million), by Country 2025 & 2033
- Figure 13: Europe Charcoal Industry Revenue Share (%), by Country 2025 & 2033
- Figure 14: Asia Pacific Charcoal Industry Revenue (million), by Form 2025 & 2033
- Figure 15: Asia Pacific Charcoal Industry Revenue Share (%), by Form 2025 & 2033
- Figure 16: Asia Pacific Charcoal Industry Revenue (million), by Distribution Channel 2025 & 2033
- Figure 17: Asia Pacific Charcoal Industry Revenue Share (%), by Distribution Channel 2025 & 2033
- Figure 18: Asia Pacific Charcoal Industry Revenue (million), by Country 2025 & 2033
- Figure 19: Asia Pacific Charcoal Industry Revenue Share (%), by Country 2025 & 2033
- Figure 20: South America Charcoal Industry Revenue (million), by Form 2025 & 2033
- Figure 21: South America Charcoal Industry Revenue Share (%), by Form 2025 & 2033
- Figure 22: South America Charcoal Industry Revenue (million), by Distribution Channel 2025 & 2033
- Figure 23: South America Charcoal Industry Revenue Share (%), by Distribution Channel 2025 & 2033
- Figure 24: South America Charcoal Industry Revenue (million), by Country 2025 & 2033
- Figure 25: South America Charcoal Industry Revenue Share (%), by Country 2025 & 2033
- Figure 26: Middle East and Africa Charcoal Industry Revenue (million), by Form 2025 & 2033
- Figure 27: Middle East and Africa Charcoal Industry Revenue Share (%), by Form 2025 & 2033
- Figure 28: Middle East and Africa Charcoal Industry Revenue (million), by Distribution Channel 2025 & 2033
- Figure 29: Middle East and Africa Charcoal Industry Revenue Share (%), by Distribution Channel 2025 & 2033
- Figure 30: Middle East and Africa Charcoal Industry Revenue (million), by Country 2025 & 2033
- Figure 31: Middle East and Africa Charcoal Industry Revenue Share (%), by Country 2025 & 2033
List of Tables
- Table 1: Global Charcoal Industry Revenue million Forecast, by Form 2020 & 2033
- Table 2: Global Charcoal Industry Revenue million Forecast, by Distribution Channel 2020 & 2033
- Table 3: Global Charcoal Industry Revenue million Forecast, by Region 2020 & 2033
- Table 4: Global Charcoal Industry Revenue million Forecast, by Form 2020 & 2033
- Table 5: Global Charcoal Industry Revenue million Forecast, by Distribution Channel 2020 & 2033
- Table 6: Global Charcoal Industry Revenue million Forecast, by Country 2020 & 2033
- Table 7: United States Charcoal Industry Revenue (million) Forecast, by Application 2020 & 2033
- Table 8: Canada Charcoal Industry Revenue (million) Forecast, by Application 2020 & 2033
- Table 9: Mexico Charcoal Industry Revenue (million) Forecast, by Application 2020 & 2033
- Table 10: Rest of North America Charcoal Industry Revenue (million) Forecast, by Application 2020 & 2033
- Table 11: Global Charcoal Industry Revenue million Forecast, by Form 2020 & 2033
- Table 12: Global Charcoal Industry Revenue million Forecast, by Distribution Channel 2020 & 2033
- Table 13: Global Charcoal Industry Revenue million Forecast, by Country 2020 & 2033
- Table 14: Spain Charcoal Industry Revenue (million) Forecast, by Application 2020 & 2033
- Table 15: United Kingdom Charcoal Industry Revenue (million) Forecast, by Application 2020 & 2033
- Table 16: Germany Charcoal Industry Revenue (million) Forecast, by Application 2020 & 2033
- Table 17: France Charcoal Industry Revenue (million) Forecast, by Application 2020 & 2033
- Table 18: Italy Charcoal Industry Revenue (million) Forecast, by Application 2020 & 2033
- Table 19: Russia Charcoal Industry Revenue (million) Forecast, by Application 2020 & 2033
- Table 20: Rest of Europe Charcoal Industry Revenue (million) Forecast, by Application 2020 & 2033
- Table 21: Global Charcoal Industry Revenue million Forecast, by Form 2020 & 2033
- Table 22: Global Charcoal Industry Revenue million Forecast, by Distribution Channel 2020 & 2033
- Table 23: Global Charcoal Industry Revenue million Forecast, by Country 2020 & 2033
- Table 24: China Charcoal Industry Revenue (million) Forecast, by Application 2020 & 2033
- Table 25: Japan Charcoal Industry Revenue (million) Forecast, by Application 2020 & 2033
- Table 26: India Charcoal Industry Revenue (million) Forecast, by Application 2020 & 2033
- Table 27: Australia Charcoal Industry Revenue (million) Forecast, by Application 2020 & 2033
- Table 28: Rest of Asia Pacific Charcoal Industry Revenue (million) Forecast, by Application 2020 & 2033
- Table 29: Global Charcoal Industry Revenue million Forecast, by Form 2020 & 2033
- Table 30: Global Charcoal Industry Revenue million Forecast, by Distribution Channel 2020 & 2033
- Table 31: Global Charcoal Industry Revenue million Forecast, by Country 2020 & 2033
- Table 32: Brazil Charcoal Industry Revenue (million) Forecast, by Application 2020 & 2033
- Table 33: Argentina Charcoal Industry Revenue (million) Forecast, by Application 2020 & 2033
- Table 34: Rest of South America Charcoal Industry Revenue (million) Forecast, by Application 2020 & 2033
- Table 35: Global Charcoal Industry Revenue million Forecast, by Form 2020 & 2033
- Table 36: Global Charcoal Industry Revenue million Forecast, by Distribution Channel 2020 & 2033
- Table 37: Global Charcoal Industry Revenue million Forecast, by Country 2020 & 2033
- Table 38: South Africa Charcoal Industry Revenue (million) Forecast, by Application 2020 & 2033
- Table 39: Saudi Arabia Charcoal Industry Revenue (million) Forecast, by Application 2020 & 2033
- Table 40: Rest of Middle East and Africa Charcoal Industry Revenue (million) Forecast, by Application 2020 & 2033
Frequently Asked Questions
1. What is the projected Compound Annual Growth Rate (CAGR) of the Charcoal Industry?
The projected CAGR is approximately 4.12%.
2. Which companies are prominent players in the Charcoal Industry?
Key companies in the market include Holland & Barrett Retail Limited, Bulletproof 360 Inc *List Not Exhaustive, Forza Industries Ltd, Country Life LLC, Nature's Way Products LLC, Swanson, Schizandu Organics, Sona.
3. What are the main segments of the Charcoal Industry?
The market segments include Form, Distribution Channel.
4. Can you provide details about the market size?
The market size is estimated to be USD 73.15 million as of 2022.
5. What are some drivers contributing to market growth?
Health Benefits Promoting Apple Cider Vinegar Demand; Unfiltered Apple Cider Vinegar Being Popular.
6. What are the notable trends driving market growth?
Rising Demand For Detoxifying Substances.
7. Are there any restraints impacting market growth?
Rising Demand for Other Vinegar Types.
8. Can you provide examples of recent developments in the market?
N/A
9. What pricing options are available for accessing the report?
Pricing options include single-user, multi-user, and enterprise licenses priced at USD 4750, USD 5250, and USD 8750 respectively.
10. Is the market size provided in terms of value or volume?
The market size is provided in terms of value, measured in million.
11. Are there any specific market keywords associated with the report?
Yes, the market keyword associated with the report is "Charcoal Industry," which aids in identifying and referencing the specific market segment covered.
12. How do I determine which pricing option suits my needs best?
The pricing options vary based on user requirements and access needs. Individual users may opt for single-user licenses, while businesses requiring broader access may choose multi-user or enterprise licenses for cost-effective access to the report.
13. Are there any additional resources or data provided in the Charcoal Industry report?
While the report offers comprehensive insights, it's advisable to review the specific contents or supplementary materials provided to ascertain if additional resources or data are available.
14. How can I stay updated on further developments or reports in the Charcoal Industry?
To stay informed about further developments, trends, and reports in the Charcoal Industry, consider subscribing to industry newsletters, following relevant companies and organizations, or regularly checking reputable industry news sources and publications.
Methodology
Step 1 - Identification of Relevant Samples Size from Population Database


Step 2 - Approaches for Defining Global Market Size (Value, Volume* & Price*)

Note*: In applicable scenarios
Step 3 - Data Sources
Primary Research
- Web Analytics
- Survey Reports
- Research Institute
- Latest Research Reports
- Opinion Leaders
Secondary Research
- Annual Reports
- White Paper
- Latest Press Release
- Industry Association
- Paid Database
- Investor Presentations

Step 4 - Data Triangulation
Involves using different sources of information in order to increase the validity of a study
These sources are likely to be stakeholders in a program - participants, other researchers, program staff, other community members, and so on.
Then we put all data in single framework & apply various statistical tools to find out the dynamic on the market.
During the analysis stage, feedback from the stakeholder groups would be compared to determine areas of agreement as well as areas of divergence