

Key Insights
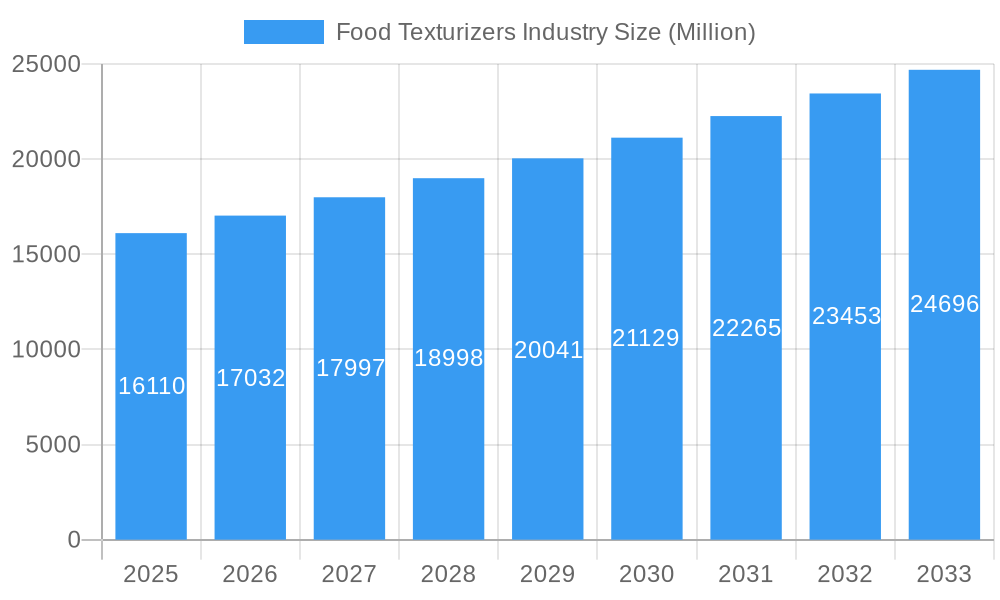
The global Food Texturizers Market is poised for substantial growth, estimated at USD 16.11 billion in 2025, and is projected to expand at a Compound Annual Growth Rate (CAGR) of 5.8% through 2033. This robust expansion is driven by a confluence of factors, including the escalating consumer demand for processed and convenience foods, the persistent innovation in food product development, and the increasing preference for clean-label ingredients. As food manufacturers strive to enhance sensory appeal, shelf-life, and nutritional profiles of their offerings, the role of texturizers becomes increasingly critical. The market's dynamism is further fueled by evolving consumer palates, leading to a greater adoption of texturizers in diverse applications such as dairy, confectionery, bakery, and ready meals, all aiming to deliver a superior eating experience. The industry is witnessing a surge in demand for natural and plant-based texturizers, reflecting a broader trend towards healthier and more sustainable food choices.
Food Texturizers Industry Market Size (In Billion)
The market's growth trajectory is underpinned by a diverse range of texturizing agents, with Cellulose Derivatives and Gums leading the pack, followed closely by Pectins and Gelatins. These ingredients play an indispensable role in achieving desired textures, from creamy smoothness in dairy products to the perfect chew in confectionery. The application landscape is equally varied, with Dairy Products & Ice Creams and Confectionery representing dominant segments due to their inherent reliance on texturizers for product integrity and appeal. However, significant growth is also anticipated in emerging applications like plant-based meat alternatives and functional beverages, where precise textural control is paramount for consumer acceptance. Geographically, Asia Pacific is expected to emerge as a high-growth region, driven by rapid urbanization, a burgeoning middle class, and increasing disposable incomes. While the market benefits from strong drivers, it also faces certain restraints, such as the volatility in raw material prices and stringent regulatory landscapes in some regions, which may necessitate strategic navigation by market players.
Food Texturizers Industry Company Market Share
This comprehensive report delves into the dynamic global Food Texturizers market, providing an in-depth analysis of its structure, competitive landscape, key trends, and future trajectory. Leveraging extensive historical data from 2019–2024 and a robust forecast period of 2025–2033, with 2025 as the base and estimated year, this study uncovers crucial insights for stakeholders. The report examines market drivers, challenges, segmentation, and significant industry developments, offering a 360-degree view of this essential sector. With an estimated market value projected to reach several hundred billion dollars, the food texturizers industry is poised for substantial expansion, driven by evolving consumer demands and technological advancements.
Food Texturizers Industry Market Structure & Competitive Landscape
The global Food Texturizers market exhibits a moderately concentrated structure, characterized by the presence of a few large multinational corporations alongside a growing number of specialized regional players. Innovation remains a primary driver, with companies continuously investing in research and development to introduce novel ingredients that cater to clean-label demands, improved functionality, and enhanced sensory experiences. Regulatory landscapes, particularly concerning food safety and labeling, play a significant role in shaping market entry and product development strategies. The threat of product substitutes, though present, is mitigated by the unique functionalities and established efficacy of various texturizers across diverse applications. End-user segmentation, encompassing dairy, bakery, confectionery, and processed foods, reveals varied demand patterns and growth potentials. Mergers and acquisitions (M&A) are strategic tools employed by leading players to expand product portfolios, gain market share, and access new geographical regions. For instance, recent M&A activities have focused on acquiring companies with expertise in hydrocolloids and plant-based texturizers, signaling a shift towards sustainable and naturally derived ingredients. The overall market concentration ratio is estimated to be between 50% and 65% for the top five players, underscoring their significant influence.
Food Texturizers Industry Market Trends & Opportunities
The Food Texturizers market is experiencing robust growth, projected to expand at a Compound Annual Growth Rate (CAGR) of over 6.5% during the forecast period, reaching an estimated valuation exceeding USD 150 billion by 2033. This expansion is fueled by a confluence of evolving consumer preferences and transformative technological shifts. Consumers are increasingly demanding healthier, more natural, and sustainably sourced food products. This trend has spurred innovation in texturizers derived from plant-based sources, such as gums and starches, offering functionalities previously dominated by animal-derived ingredients like gelatin. The "clean label" movement, emphasizing simple, recognizable ingredient lists, is a paramount driver, pushing manufacturers to reformulate products with fewer artificial additives and embrace natural texturizers. Technological advancements in extraction, modification, and encapsulation of texturizing agents are enabling the creation of ingredients with enhanced performance, stability, and cost-effectiveness. For example, the development of high-performance hydrocolloids capable of mimicking fat textures in reduced-fat products or providing specific mouthfeels in plant-based alternatives presents significant opportunities. The burgeoning ready-to-eat and convenience food sectors are also major contributors, as texturizers are crucial for maintaining product integrity, appearance, and palatability during processing and storage. Furthermore, the growing global population, coupled with rising disposable incomes in emerging economies, is expanding the addressable market for processed foods, thereby increasing the demand for a wide array of texturizers. Opportunities lie in developing texturizers that offer novel sensory experiences, improve the nutritional profile of foods (e.g., fiber enrichment), and contribute to waste reduction through improved shelf-life. The competitive landscape is characterized by strategic partnerships and product launches aimed at capturing these emerging market segments. The penetration rate of advanced texturizers in niche applications is still relatively low, indicating substantial untapped market potential.
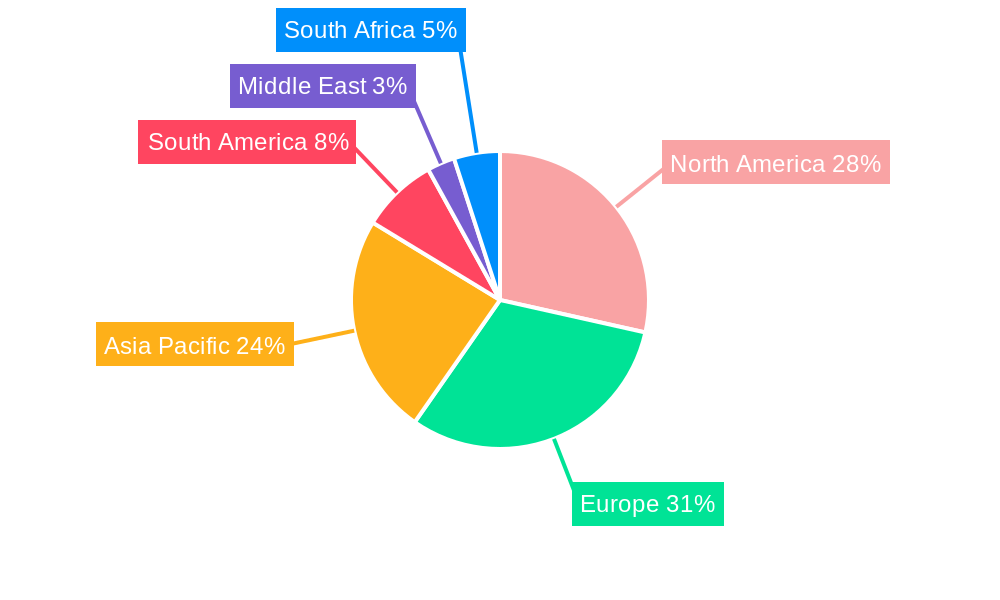
Dominant Markets & Segments in Food Texturizers Industry
The global Food Texturizers market's dominance is multifaceted, with significant leadership evident in specific regions and product categories. North America and Europe currently represent the largest regional markets, driven by mature food industries, high consumer spending on processed foods, and a strong preference for premium and convenience products. However, the Asia-Pacific region is emerging as a high-growth market, propelled by rapid urbanization, a growing middle class, and increasing adoption of Western dietary habits.
Within product segmentation, Starch holds a commanding market share, owing to its versatility, cost-effectiveness, and wide range of applications across bakery, confectionery, and dairy products. Its ability to modify viscosity, provide body, and act as a binder makes it an indispensable texturizer.
- Growth Drivers for Starch Dominance:
- Cost-Effectiveness: Starch-based texturizers are generally more economical than many other options.
- Versatile Functionality: Applicable across a broad spectrum of food products for thickening, gelling, and stabilizing.
- Consumer Acceptance: Widely recognized and accepted ingredient, fitting well with clean-label trends when derived from sources like corn, potato, and tapioca.
- Abundant Supply: Globally available raw materials ensure consistent supply.
In terms of applications, Dairy Products & Ice Creams and Bakery segments are the largest consumers of food texturizers. In dairy, texturizers are critical for achieving desired creaminess, stability, and mouthfeel in products like yogurt, cheese, and ice cream. In bakery, they are essential for improving dough handling, crumb structure, texture, and shelf-life of bread, cakes, and pastries.
Key Growth Drivers in Dairy Products & Ice Creams:
- Demand for Creaminess and Smoothness: Texturizers like gums and modified starches are vital for replicating indulgent textures in low-fat or dairy-free alternatives.
- Stabilization: Preventing ice crystal formation in ice cream and maintaining yogurt consistency.
- Clean-Label Solutions: Growing interest in plant-based and natural texturizers for dairy alternatives.
Key Growth Drivers in Bakery:
- Enhanced Dough Properties: Improving elasticity, machinability, and volume in baked goods.
- Extended Shelf-Life: Preventing staling and maintaining moisture content.
- Texture Modification: Achieving desired crumb structure and a soft, appealing bite.
While Cellulose Derivatives and Gums (like Xanthan gum, Guar gum, Carrageenan) are also significant contributors, their growth is particularly driven by their functional properties in specific applications, such as thickening in sauces and beverages, and gelling in jams and jellies. Pectins are vital for the confectionery and jam sectors, while Gelatins remain important for confectionery and desserts, though face growing competition from plant-based alternatives. Inulin and Dextrins are gaining traction for their prebiotic properties and use in low-fat formulations, respectively.
Food Texturizers Industry Product Analysis
Innovations in food texturizers are primarily focused on enhancing functionality, improving clean-label profiles, and catering to specific dietary needs. Companies are developing modified starches with superior heat and shear stability, alongside hydrocolloids that offer synergistic texturizing effects and emulate natural textures more effectively. For instance, advanced pectin formulations enable improved gel strength and clarity in jams and confectionery, while novel gum blends provide enhanced suspension and thickening in beverages. The competitive advantage lies in offering texturizers that reduce processing costs, improve product appeal, and meet stringent regulatory and consumer demands for natural and sustainable ingredients.
Key Drivers, Barriers & Challenges in Food Texturizers Industry
Key Drivers: The food texturizers industry is propelled by several key factors. Growing consumer demand for healthier and more convenient food options necessitates ingredients that enhance palatability and shelf-life. The rising trend towards plant-based and reduced-fat products creates opportunities for specialized texturizers that mimic traditional textures. Technological advancements in ingredient processing and modification are leading to the development of more functional and cost-effective texturizers. Furthermore, supportive government initiatives and increasing disposable incomes in emerging economies are fueling market growth.
Barriers & Challenges: Despite strong growth, the industry faces challenges. Fluctuations in raw material prices and availability can impact production costs and supply chain stability. Stringent regulatory frameworks governing food additives and labeling requirements can pose hurdles for market entry and product development. Intense competition among key players and the emergence of new market entrants can lead to price pressures. Lastly, consumer perception and potential concerns regarding the "artificiality" of some texturizers, even when approved, require ongoing education and transparency from manufacturers.
Growth Drivers in the Food Texturizers Industry Market
The food texturizers market is experiencing significant growth driven by several key factors. Consumer demand for healthier food options, including low-fat and sugar-reduced products, necessitates texturizers that can replicate the mouthfeel and texture of traditional ingredients. The escalating popularity of plant-based diets has created a substantial market for texturizers that provide desirable textures in meat and dairy alternatives. Technological advancements in texturizer modification and encapsulation are leading to the development of high-performance ingredients with enhanced stability and functionality, such as improved gelling agents and emulsifiers. Furthermore, increasing urbanization and a burgeoning middle class in emerging economies are leading to higher consumption of processed and convenience foods, thereby driving demand for texturizers.
Challenges Impacting Food Texturizers Industry Growth
Several challenges impact the growth trajectory of the food texturizers industry. Volatility in the prices and availability of key raw materials, such as plant-based gums and starches, can significantly affect manufacturing costs and supply chain reliability. Navigating complex and evolving regulatory landscapes across different countries, particularly concerning labeling and safety standards for novel texturizers, presents a significant hurdle. Intense competition among established players and the influx of new entrants can lead to price wars and reduced profit margins. Additionally, negative consumer perceptions surrounding certain food additives and a strong preference for "all-natural" ingredients can create resistance to the adoption of some texturizers, necessitating greater transparency and consumer education efforts.
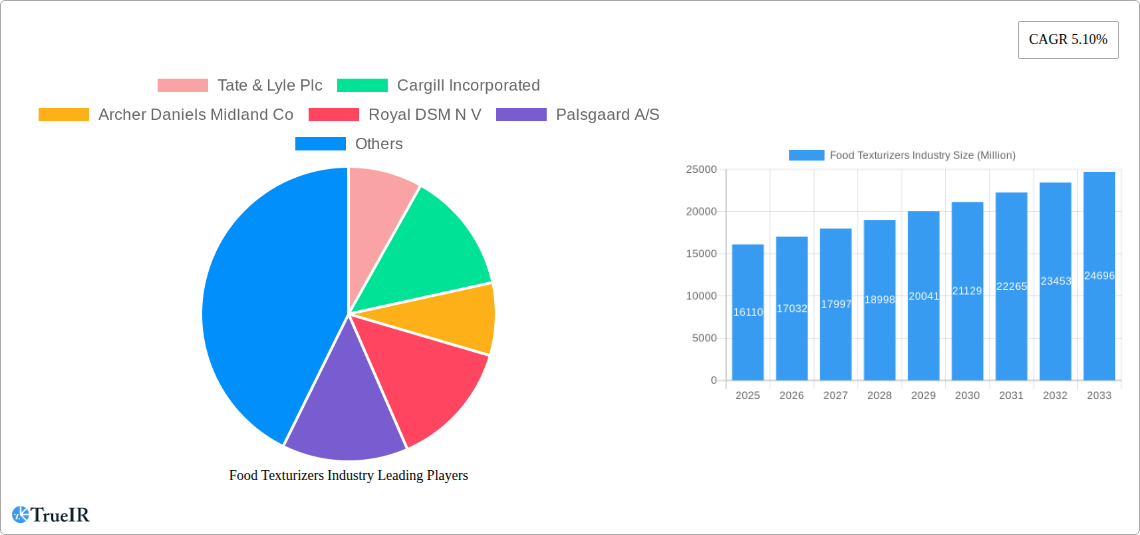
Key Players Shaping the Food Texturizers Industry Market
- Tate & Lyle Plc
- Cargill Incorporated
- Archer Daniels Midland Co
- Royal DSM N V
- Palsgaard A/S
- Kerry Inc
- Ingredion Inc
- DuPont
- Fiberstar Inc
- Estelle Chemicals Pvt Ltd
Significant Food Texturizers Industry Industry Milestones
- April 2022: Cargill Salt announced a substantial investment of USD 68 billion to expand its ST. Clair Plant. This strategic investment aims to enhance the plant's production capacity through increased automation, the adoption of new technologies, and significant efficiency improvements. The multi-year project includes the construction of a new 50,000-square-foot evaporation facility, featuring a state-of-the-art dry processing line designed to reduce waste and boost capacity by up to 40%.
- October 2021: Cargill Incorporated introduced SimPure rice flour, a clean-label bulking agent offering a taste, texture, and functionality comparable to maltodextrin. The official unveiling at the SupplySide West trade show highlighted the company's strategic focus on expanding its product portfolio to meet growing market demand for natural and functional ingredients.
Future Outlook for Food Texturizers Industry Market
The future outlook for the Food Texturizers market is exceptionally promising, with continued robust growth anticipated. Strategic opportunities lie in the development of innovative texturizers derived from sustainable and underutilized sources, addressing both functional needs and environmental concerns. The market will increasingly focus on plant-based and allergen-free solutions, catering to evolving dietary preferences and health consciousness. Advancements in ingredient technology will enable texturizers that provide enhanced sensory experiences, improved nutritional profiles, and greater cost-effectiveness. The expansion of the global food processing industry, particularly in emerging economies, will further fuel demand. Collaboration between ingredient manufacturers, food producers, and research institutions will be crucial for driving innovation and navigating regulatory landscapes to unlock the full market potential.
Food Texturizers Industry Segmentation
-
1. Type
- 1.1. Cellulose Derivatives
- 1.2. Gums
- 1.3. Pectins
- 1.4. Gelatins
- 1.5. Starch
- 1.6. Inulin
- 1.7. Dextrins
- 1.8. Other Types
-
2. Application
- 2.1. Dairy Products & Ice Creams
- 2.2. Confectionery
- 2.3. Jams
- 2.4. Layers
- 2.5. Fillings
- 2.6. Bakery
- 2.7. Meat Products
- 2.8. Ready Meals
- 2.9. Sauces
- 2.10. Beverages
- 2.11. Other Applications
Food Texturizers Industry Segmentation By Geography
-
1. North America
- 1.1. United States
- 1.2. Canada
- 1.3. Mexico
- 1.4. Rest of North America
-
2. Europe
- 2.1. United Kingdom
- 2.2. Germany
- 2.3. France
- 2.4. Russia
- 2.5. Italy
- 2.6. Spain
- 2.7. Rest of Europe
-
3. Asia Pacific
- 3.1. India
- 3.2. China
- 3.3. Japan
- 3.4. Australia
- 3.5. Rest of Asia Pacific
-
4. South America
- 4.1. Brazil
- 4.2. Argentina
- 4.3. Rest of South America
- 5. Middle East
-
6. South Africa
- 6.1. Saudi Arabia
- 6.2. Rest of Middle East
Food Texturizers Industry Regional Market Share
Geographic Coverage of Food Texturizers Industry
Food Texturizers Industry REPORT HIGHLIGHTS
| Aspects | Details |
|---|---|
| Study Period | 2020-2034 |
| Base Year | 2025 |
| Estimated Year | 2026 |
| Forecast Period | 2026-2034 |
| Historical Period | 2020-2025 |
| Growth Rate | CAGR of 7.3% from 2020-2034 |
| Segmentation |
|
Table of Contents
- 1. Introduction
- 1.1. Research Scope
- 1.2. Market Segmentation
- 1.3. Research Objective
- 1.4. Definitions and Assumptions
- 2. Executive Summary
- 2.1. Market Snapshot
- 3. Market Dynamics
- 3.1. Market Drivers
- 3.2. Market Restrains
- 3.3. Market Trends
- 3.4. Market Opportunities
- 4. Market Factor Analysis
- 4.1. Porters Five Forces
- 4.1.1. Bargaining Power of Suppliers
- 4.1.2. Bargaining Power of Buyers
- 4.1.3. Threat of New Entrants
- 4.1.4. Threat of Substitutes
- 4.1.5. Competitive Rivalry
- 4.2. PESTEL analysis
- 4.3. BCG Analysis
- 4.3.1. Stars (High Growth, High Market Share)
- 4.3.2. Cash Cows (Low Growth, High Market Share)
- 4.3.3. Question Mark (High Growth, Low Market Share)
- 4.3.4. Dogs (Low Growth, Low Market Share)
- 4.4. Ansoff Matrix Analysis
- 4.5. Supply Chain Analysis
- 4.6. Regulatory Landscape
- 4.7. Current Market Potential and Opportunity Assessment (TAM–SAM–SOM Framework)
- 4.8. TIR Analyst Note
- 4.1. Porters Five Forces
- 5. Market Analysis, Insights and Forecast 2021-2033
- 5.1. Market Analysis, Insights and Forecast - by Type
- 5.1.1. Cellulose Derivatives
- 5.1.2. Gums
- 5.1.3. Pectins
- 5.1.4. Gelatins
- 5.1.5. Starch
- 5.1.6. Inulin
- 5.1.7. Dextrins
- 5.1.8. Other Types
- 5.2. Market Analysis, Insights and Forecast - by Application
- 5.2.1. Dairy Products & Ice Creams
- 5.2.2. Confectionery
- 5.2.3. Jams
- 5.2.4. Layers
- 5.2.5. Fillings
- 5.2.6. Bakery
- 5.2.7. Meat Products
- 5.2.8. Ready Meals
- 5.2.9. Sauces
- 5.2.10. Beverages
- 5.2.11. Other Applications
- 5.3. Market Analysis, Insights and Forecast - by Region
- 5.3.1. North America
- 5.3.2. Europe
- 5.3.3. Asia Pacific
- 5.3.4. South America
- 5.3.5. Middle East
- 5.3.6. South Africa
- 5.1. Market Analysis, Insights and Forecast - by Type
- 6. Global Food Texturizers Industry Analysis, Insights and Forecast, 2021-2033
- 6.1. Market Analysis, Insights and Forecast - by Type
- 6.1.1. Cellulose Derivatives
- 6.1.2. Gums
- 6.1.3. Pectins
- 6.1.4. Gelatins
- 6.1.5. Starch
- 6.1.6. Inulin
- 6.1.7. Dextrins
- 6.1.8. Other Types
- 6.2. Market Analysis, Insights and Forecast - by Application
- 6.2.1. Dairy Products & Ice Creams
- 6.2.2. Confectionery
- 6.2.3. Jams
- 6.2.4. Layers
- 6.2.5. Fillings
- 6.2.6. Bakery
- 6.2.7. Meat Products
- 6.2.8. Ready Meals
- 6.2.9. Sauces
- 6.2.10. Beverages
- 6.2.11. Other Applications
- 6.1. Market Analysis, Insights and Forecast - by Type
- 7. North America Food Texturizers Industry Analysis, Insights and Forecast, 2020-2032
- 7.1. Market Analysis, Insights and Forecast - by Type
- 7.1.1. Cellulose Derivatives
- 7.1.2. Gums
- 7.1.3. Pectins
- 7.1.4. Gelatins
- 7.1.5. Starch
- 7.1.6. Inulin
- 7.1.7. Dextrins
- 7.1.8. Other Types
- 7.2. Market Analysis, Insights and Forecast - by Application
- 7.2.1. Dairy Products & Ice Creams
- 7.2.2. Confectionery
- 7.2.3. Jams
- 7.2.4. Layers
- 7.2.5. Fillings
- 7.2.6. Bakery
- 7.2.7. Meat Products
- 7.2.8. Ready Meals
- 7.2.9. Sauces
- 7.2.10. Beverages
- 7.2.11. Other Applications
- 7.1. Market Analysis, Insights and Forecast - by Type
- 8. Europe Food Texturizers Industry Analysis, Insights and Forecast, 2020-2032
- 8.1. Market Analysis, Insights and Forecast - by Type
- 8.1.1. Cellulose Derivatives
- 8.1.2. Gums
- 8.1.3. Pectins
- 8.1.4. Gelatins
- 8.1.5. Starch
- 8.1.6. Inulin
- 8.1.7. Dextrins
- 8.1.8. Other Types
- 8.2. Market Analysis, Insights and Forecast - by Application
- 8.2.1. Dairy Products & Ice Creams
- 8.2.2. Confectionery
- 8.2.3. Jams
- 8.2.4. Layers
- 8.2.5. Fillings
- 8.2.6. Bakery
- 8.2.7. Meat Products
- 8.2.8. Ready Meals
- 8.2.9. Sauces
- 8.2.10. Beverages
- 8.2.11. Other Applications
- 8.1. Market Analysis, Insights and Forecast - by Type
- 9. Asia Pacific Food Texturizers Industry Analysis, Insights and Forecast, 2020-2032
- 9.1. Market Analysis, Insights and Forecast - by Type
- 9.1.1. Cellulose Derivatives
- 9.1.2. Gums
- 9.1.3. Pectins
- 9.1.4. Gelatins
- 9.1.5. Starch
- 9.1.6. Inulin
- 9.1.7. Dextrins
- 9.1.8. Other Types
- 9.2. Market Analysis, Insights and Forecast - by Application
- 9.2.1. Dairy Products & Ice Creams
- 9.2.2. Confectionery
- 9.2.3. Jams
- 9.2.4. Layers
- 9.2.5. Fillings
- 9.2.6. Bakery
- 9.2.7. Meat Products
- 9.2.8. Ready Meals
- 9.2.9. Sauces
- 9.2.10. Beverages
- 9.2.11. Other Applications
- 9.1. Market Analysis, Insights and Forecast - by Type
- 10. South America Food Texturizers Industry Analysis, Insights and Forecast, 2020-2032
- 10.1. Market Analysis, Insights and Forecast - by Type
- 10.1.1. Cellulose Derivatives
- 10.1.2. Gums
- 10.1.3. Pectins
- 10.1.4. Gelatins
- 10.1.5. Starch
- 10.1.6. Inulin
- 10.1.7. Dextrins
- 10.1.8. Other Types
- 10.2. Market Analysis, Insights and Forecast - by Application
- 10.2.1. Dairy Products & Ice Creams
- 10.2.2. Confectionery
- 10.2.3. Jams
- 10.2.4. Layers
- 10.2.5. Fillings
- 10.2.6. Bakery
- 10.2.7. Meat Products
- 10.2.8. Ready Meals
- 10.2.9. Sauces
- 10.2.10. Beverages
- 10.2.11. Other Applications
- 10.1. Market Analysis, Insights and Forecast - by Type
- 11. Middle East Food Texturizers Industry Analysis, Insights and Forecast, 2020-2032
- 11.1. Market Analysis, Insights and Forecast - by Type
- 11.1.1. Cellulose Derivatives
- 11.1.2. Gums
- 11.1.3. Pectins
- 11.1.4. Gelatins
- 11.1.5. Starch
- 11.1.6. Inulin
- 11.1.7. Dextrins
- 11.1.8. Other Types
- 11.2. Market Analysis, Insights and Forecast - by Application
- 11.2.1. Dairy Products & Ice Creams
- 11.2.2. Confectionery
- 11.2.3. Jams
- 11.2.4. Layers
- 11.2.5. Fillings
- 11.2.6. Bakery
- 11.2.7. Meat Products
- 11.2.8. Ready Meals
- 11.2.9. Sauces
- 11.2.10. Beverages
- 11.2.11. Other Applications
- 11.1. Market Analysis, Insights and Forecast - by Type
- 12. South Africa Food Texturizers Industry Analysis, Insights and Forecast, 2020-2032
- 12.1. Market Analysis, Insights and Forecast - by Type
- 12.1.1. Cellulose Derivatives
- 12.1.2. Gums
- 12.1.3. Pectins
- 12.1.4. Gelatins
- 12.1.5. Starch
- 12.1.6. Inulin
- 12.1.7. Dextrins
- 12.1.8. Other Types
- 12.2. Market Analysis, Insights and Forecast - by Application
- 12.2.1. Dairy Products & Ice Creams
- 12.2.2. Confectionery
- 12.2.3. Jams
- 12.2.4. Layers
- 12.2.5. Fillings
- 12.2.6. Bakery
- 12.2.7. Meat Products
- 12.2.8. Ready Meals
- 12.2.9. Sauces
- 12.2.10. Beverages
- 12.2.11. Other Applications
- 12.1. Market Analysis, Insights and Forecast - by Type
- 13. Competitive Analysis
- 13.1. Company Profiles
- 13.1.1 Tate & Lyle Plc
- 13.1.1.1. Company Overview
- 13.1.1.2. Products
- 13.1.1.3. Company Financials
- 13.1.1.4. SWOT Analysis
- 13.1.2 Cargill Incorporated
- 13.1.2.1. Company Overview
- 13.1.2.2. Products
- 13.1.2.3. Company Financials
- 13.1.2.4. SWOT Analysis
- 13.1.3 Archer Daniels Midland Co
- 13.1.3.1. Company Overview
- 13.1.3.2. Products
- 13.1.3.3. Company Financials
- 13.1.3.4. SWOT Analysis
- 13.1.4 Royal DSM N V
- 13.1.4.1. Company Overview
- 13.1.4.2. Products
- 13.1.4.3. Company Financials
- 13.1.4.4. SWOT Analysis
- 13.1.5 Palsgaard A/S
- 13.1.5.1. Company Overview
- 13.1.5.2. Products
- 13.1.5.3. Company Financials
- 13.1.5.4. SWOT Analysis
- 13.1.6 Kerry Inc
- 13.1.6.1. Company Overview
- 13.1.6.2. Products
- 13.1.6.3. Company Financials
- 13.1.6.4. SWOT Analysis
- 13.1.7 Ingredion Inc
- 13.1.7.1. Company Overview
- 13.1.7.2. Products
- 13.1.7.3. Company Financials
- 13.1.7.4. SWOT Analysis
- 13.1.8 DuPont
- 13.1.8.1. Company Overview
- 13.1.8.2. Products
- 13.1.8.3. Company Financials
- 13.1.8.4. SWOT Analysis
- 13.1.9 Fiberstar Inc *List Not Exhaustive
- 13.1.9.1. Company Overview
- 13.1.9.2. Products
- 13.1.9.3. Company Financials
- 13.1.9.4. SWOT Analysis
- 13.1.10 Estelle Chemicals Pvt Ltd
- 13.1.10.1. Company Overview
- 13.1.10.2. Products
- 13.1.10.3. Company Financials
- 13.1.10.4. SWOT Analysis
- 13.1.1 Tate & Lyle Plc
- 13.2. Market Entropy
- 13.2.1 Company's Key Areas Served
- 13.2.2 Recent Developments
- 13.3. Company Market Share Analysis 2025
- 13.3.1 Top 5 Companies Market Share Analysis
- 13.3.2 Top 3 Companies Market Share Analysis
- 13.4. List of Potential Customers
- 14. Research Methodology
List of Figures
- Figure 1: Global Food Texturizers Industry Revenue Breakdown (billion, %) by Region 2025 & 2033
- Figure 2: Global Food Texturizers Industry Volume Breakdown (K Tons, %) by Region 2025 & 2033
- Figure 3: North America Food Texturizers Industry Revenue (billion), by Type 2025 & 2033
- Figure 4: North America Food Texturizers Industry Volume (K Tons), by Type 2025 & 2033
- Figure 5: North America Food Texturizers Industry Revenue Share (%), by Type 2025 & 2033
- Figure 6: North America Food Texturizers Industry Volume Share (%), by Type 2025 & 2033
- Figure 7: North America Food Texturizers Industry Revenue (billion), by Application 2025 & 2033
- Figure 8: North America Food Texturizers Industry Volume (K Tons), by Application 2025 & 2033
- Figure 9: North America Food Texturizers Industry Revenue Share (%), by Application 2025 & 2033
- Figure 10: North America Food Texturizers Industry Volume Share (%), by Application 2025 & 2033
- Figure 11: North America Food Texturizers Industry Revenue (billion), by Country 2025 & 2033
- Figure 12: North America Food Texturizers Industry Volume (K Tons), by Country 2025 & 2033
- Figure 13: North America Food Texturizers Industry Revenue Share (%), by Country 2025 & 2033
- Figure 14: North America Food Texturizers Industry Volume Share (%), by Country 2025 & 2033
- Figure 15: Europe Food Texturizers Industry Revenue (billion), by Type 2025 & 2033
- Figure 16: Europe Food Texturizers Industry Volume (K Tons), by Type 2025 & 2033
- Figure 17: Europe Food Texturizers Industry Revenue Share (%), by Type 2025 & 2033
- Figure 18: Europe Food Texturizers Industry Volume Share (%), by Type 2025 & 2033
- Figure 19: Europe Food Texturizers Industry Revenue (billion), by Application 2025 & 2033
- Figure 20: Europe Food Texturizers Industry Volume (K Tons), by Application 2025 & 2033
- Figure 21: Europe Food Texturizers Industry Revenue Share (%), by Application 2025 & 2033
- Figure 22: Europe Food Texturizers Industry Volume Share (%), by Application 2025 & 2033
- Figure 23: Europe Food Texturizers Industry Revenue (billion), by Country 2025 & 2033
- Figure 24: Europe Food Texturizers Industry Volume (K Tons), by Country 2025 & 2033
- Figure 25: Europe Food Texturizers Industry Revenue Share (%), by Country 2025 & 2033
- Figure 26: Europe Food Texturizers Industry Volume Share (%), by Country 2025 & 2033
- Figure 27: Asia Pacific Food Texturizers Industry Revenue (billion), by Type 2025 & 2033
- Figure 28: Asia Pacific Food Texturizers Industry Volume (K Tons), by Type 2025 & 2033
- Figure 29: Asia Pacific Food Texturizers Industry Revenue Share (%), by Type 2025 & 2033
- Figure 30: Asia Pacific Food Texturizers Industry Volume Share (%), by Type 2025 & 2033
- Figure 31: Asia Pacific Food Texturizers Industry Revenue (billion), by Application 2025 & 2033
- Figure 32: Asia Pacific Food Texturizers Industry Volume (K Tons), by Application 2025 & 2033
- Figure 33: Asia Pacific Food Texturizers Industry Revenue Share (%), by Application 2025 & 2033
- Figure 34: Asia Pacific Food Texturizers Industry Volume Share (%), by Application 2025 & 2033
- Figure 35: Asia Pacific Food Texturizers Industry Revenue (billion), by Country 2025 & 2033
- Figure 36: Asia Pacific Food Texturizers Industry Volume (K Tons), by Country 2025 & 2033
- Figure 37: Asia Pacific Food Texturizers Industry Revenue Share (%), by Country 2025 & 2033
- Figure 38: Asia Pacific Food Texturizers Industry Volume Share (%), by Country 2025 & 2033
- Figure 39: South America Food Texturizers Industry Revenue (billion), by Type 2025 & 2033
- Figure 40: South America Food Texturizers Industry Volume (K Tons), by Type 2025 & 2033
- Figure 41: South America Food Texturizers Industry Revenue Share (%), by Type 2025 & 2033
- Figure 42: South America Food Texturizers Industry Volume Share (%), by Type 2025 & 2033
- Figure 43: South America Food Texturizers Industry Revenue (billion), by Application 2025 & 2033
- Figure 44: South America Food Texturizers Industry Volume (K Tons), by Application 2025 & 2033
- Figure 45: South America Food Texturizers Industry Revenue Share (%), by Application 2025 & 2033
- Figure 46: South America Food Texturizers Industry Volume Share (%), by Application 2025 & 2033
- Figure 47: South America Food Texturizers Industry Revenue (billion), by Country 2025 & 2033
- Figure 48: South America Food Texturizers Industry Volume (K Tons), by Country 2025 & 2033
- Figure 49: South America Food Texturizers Industry Revenue Share (%), by Country 2025 & 2033
- Figure 50: South America Food Texturizers Industry Volume Share (%), by Country 2025 & 2033
- Figure 51: Middle East Food Texturizers Industry Revenue (billion), by Type 2025 & 2033
- Figure 52: Middle East Food Texturizers Industry Volume (K Tons), by Type 2025 & 2033
- Figure 53: Middle East Food Texturizers Industry Revenue Share (%), by Type 2025 & 2033
- Figure 54: Middle East Food Texturizers Industry Volume Share (%), by Type 2025 & 2033
- Figure 55: Middle East Food Texturizers Industry Revenue (billion), by Application 2025 & 2033
- Figure 56: Middle East Food Texturizers Industry Volume (K Tons), by Application 2025 & 2033
- Figure 57: Middle East Food Texturizers Industry Revenue Share (%), by Application 2025 & 2033
- Figure 58: Middle East Food Texturizers Industry Volume Share (%), by Application 2025 & 2033
- Figure 59: Middle East Food Texturizers Industry Revenue (billion), by Country 2025 & 2033
- Figure 60: Middle East Food Texturizers Industry Volume (K Tons), by Country 2025 & 2033
- Figure 61: Middle East Food Texturizers Industry Revenue Share (%), by Country 2025 & 2033
- Figure 62: Middle East Food Texturizers Industry Volume Share (%), by Country 2025 & 2033
- Figure 63: South Africa Food Texturizers Industry Revenue (billion), by Type 2025 & 2033
- Figure 64: South Africa Food Texturizers Industry Volume (K Tons), by Type 2025 & 2033
- Figure 65: South Africa Food Texturizers Industry Revenue Share (%), by Type 2025 & 2033
- Figure 66: South Africa Food Texturizers Industry Volume Share (%), by Type 2025 & 2033
- Figure 67: South Africa Food Texturizers Industry Revenue (billion), by Application 2025 & 2033
- Figure 68: South Africa Food Texturizers Industry Volume (K Tons), by Application 2025 & 2033
- Figure 69: South Africa Food Texturizers Industry Revenue Share (%), by Application 2025 & 2033
- Figure 70: South Africa Food Texturizers Industry Volume Share (%), by Application 2025 & 2033
- Figure 71: South Africa Food Texturizers Industry Revenue (billion), by Country 2025 & 2033
- Figure 72: South Africa Food Texturizers Industry Volume (K Tons), by Country 2025 & 2033
- Figure 73: South Africa Food Texturizers Industry Revenue Share (%), by Country 2025 & 2033
- Figure 74: South Africa Food Texturizers Industry Volume Share (%), by Country 2025 & 2033
List of Tables
- Table 1: Global Food Texturizers Industry Revenue billion Forecast, by Type 2020 & 2033
- Table 2: Global Food Texturizers Industry Volume K Tons Forecast, by Type 2020 & 2033
- Table 3: Global Food Texturizers Industry Revenue billion Forecast, by Application 2020 & 2033
- Table 4: Global Food Texturizers Industry Volume K Tons Forecast, by Application 2020 & 2033
- Table 5: Global Food Texturizers Industry Revenue billion Forecast, by Region 2020 & 2033
- Table 6: Global Food Texturizers Industry Volume K Tons Forecast, by Region 2020 & 2033
- Table 7: Global Food Texturizers Industry Revenue billion Forecast, by Type 2020 & 2033
- Table 8: Global Food Texturizers Industry Volume K Tons Forecast, by Type 2020 & 2033
- Table 9: Global Food Texturizers Industry Revenue billion Forecast, by Application 2020 & 2033
- Table 10: Global Food Texturizers Industry Volume K Tons Forecast, by Application 2020 & 2033
- Table 11: Global Food Texturizers Industry Revenue billion Forecast, by Country 2020 & 2033
- Table 12: Global Food Texturizers Industry Volume K Tons Forecast, by Country 2020 & 2033
- Table 13: United States Food Texturizers Industry Revenue (billion) Forecast, by Application 2020 & 2033
- Table 14: United States Food Texturizers Industry Volume (K Tons) Forecast, by Application 2020 & 2033
- Table 15: Canada Food Texturizers Industry Revenue (billion) Forecast, by Application 2020 & 2033
- Table 16: Canada Food Texturizers Industry Volume (K Tons) Forecast, by Application 2020 & 2033
- Table 17: Mexico Food Texturizers Industry Revenue (billion) Forecast, by Application 2020 & 2033
- Table 18: Mexico Food Texturizers Industry Volume (K Tons) Forecast, by Application 2020 & 2033
- Table 19: Rest of North America Food Texturizers Industry Revenue (billion) Forecast, by Application 2020 & 2033
- Table 20: Rest of North America Food Texturizers Industry Volume (K Tons) Forecast, by Application 2020 & 2033
- Table 21: Global Food Texturizers Industry Revenue billion Forecast, by Type 2020 & 2033
- Table 22: Global Food Texturizers Industry Volume K Tons Forecast, by Type 2020 & 2033
- Table 23: Global Food Texturizers Industry Revenue billion Forecast, by Application 2020 & 2033
- Table 24: Global Food Texturizers Industry Volume K Tons Forecast, by Application 2020 & 2033
- Table 25: Global Food Texturizers Industry Revenue billion Forecast, by Country 2020 & 2033
- Table 26: Global Food Texturizers Industry Volume K Tons Forecast, by Country 2020 & 2033
- Table 27: United Kingdom Food Texturizers Industry Revenue (billion) Forecast, by Application 2020 & 2033
- Table 28: United Kingdom Food Texturizers Industry Volume (K Tons) Forecast, by Application 2020 & 2033
- Table 29: Germany Food Texturizers Industry Revenue (billion) Forecast, by Application 2020 & 2033
- Table 30: Germany Food Texturizers Industry Volume (K Tons) Forecast, by Application 2020 & 2033
- Table 31: France Food Texturizers Industry Revenue (billion) Forecast, by Application 2020 & 2033
- Table 32: France Food Texturizers Industry Volume (K Tons) Forecast, by Application 2020 & 2033
- Table 33: Russia Food Texturizers Industry Revenue (billion) Forecast, by Application 2020 & 2033
- Table 34: Russia Food Texturizers Industry Volume (K Tons) Forecast, by Application 2020 & 2033
- Table 35: Italy Food Texturizers Industry Revenue (billion) Forecast, by Application 2020 & 2033
- Table 36: Italy Food Texturizers Industry Volume (K Tons) Forecast, by Application 2020 & 2033
- Table 37: Spain Food Texturizers Industry Revenue (billion) Forecast, by Application 2020 & 2033
- Table 38: Spain Food Texturizers Industry Volume (K Tons) Forecast, by Application 2020 & 2033
- Table 39: Rest of Europe Food Texturizers Industry Revenue (billion) Forecast, by Application 2020 & 2033
- Table 40: Rest of Europe Food Texturizers Industry Volume (K Tons) Forecast, by Application 2020 & 2033
- Table 41: Global Food Texturizers Industry Revenue billion Forecast, by Type 2020 & 2033
- Table 42: Global Food Texturizers Industry Volume K Tons Forecast, by Type 2020 & 2033
- Table 43: Global Food Texturizers Industry Revenue billion Forecast, by Application 2020 & 2033
- Table 44: Global Food Texturizers Industry Volume K Tons Forecast, by Application 2020 & 2033
- Table 45: Global Food Texturizers Industry Revenue billion Forecast, by Country 2020 & 2033
- Table 46: Global Food Texturizers Industry Volume K Tons Forecast, by Country 2020 & 2033
- Table 47: India Food Texturizers Industry Revenue (billion) Forecast, by Application 2020 & 2033
- Table 48: India Food Texturizers Industry Volume (K Tons) Forecast, by Application 2020 & 2033
- Table 49: China Food Texturizers Industry Revenue (billion) Forecast, by Application 2020 & 2033
- Table 50: China Food Texturizers Industry Volume (K Tons) Forecast, by Application 2020 & 2033
- Table 51: Japan Food Texturizers Industry Revenue (billion) Forecast, by Application 2020 & 2033
- Table 52: Japan Food Texturizers Industry Volume (K Tons) Forecast, by Application 2020 & 2033
- Table 53: Australia Food Texturizers Industry Revenue (billion) Forecast, by Application 2020 & 2033
- Table 54: Australia Food Texturizers Industry Volume (K Tons) Forecast, by Application 2020 & 2033
- Table 55: Rest of Asia Pacific Food Texturizers Industry Revenue (billion) Forecast, by Application 2020 & 2033
- Table 56: Rest of Asia Pacific Food Texturizers Industry Volume (K Tons) Forecast, by Application 2020 & 2033
- Table 57: Global Food Texturizers Industry Revenue billion Forecast, by Type 2020 & 2033
- Table 58: Global Food Texturizers Industry Volume K Tons Forecast, by Type 2020 & 2033
- Table 59: Global Food Texturizers Industry Revenue billion Forecast, by Application 2020 & 2033
- Table 60: Global Food Texturizers Industry Volume K Tons Forecast, by Application 2020 & 2033
- Table 61: Global Food Texturizers Industry Revenue billion Forecast, by Country 2020 & 2033
- Table 62: Global Food Texturizers Industry Volume K Tons Forecast, by Country 2020 & 2033
- Table 63: Brazil Food Texturizers Industry Revenue (billion) Forecast, by Application 2020 & 2033
- Table 64: Brazil Food Texturizers Industry Volume (K Tons) Forecast, by Application 2020 & 2033
- Table 65: Argentina Food Texturizers Industry Revenue (billion) Forecast, by Application 2020 & 2033
- Table 66: Argentina Food Texturizers Industry Volume (K Tons) Forecast, by Application 2020 & 2033
- Table 67: Rest of South America Food Texturizers Industry Revenue (billion) Forecast, by Application 2020 & 2033
- Table 68: Rest of South America Food Texturizers Industry Volume (K Tons) Forecast, by Application 2020 & 2033
- Table 69: Global Food Texturizers Industry Revenue billion Forecast, by Type 2020 & 2033
- Table 70: Global Food Texturizers Industry Volume K Tons Forecast, by Type 2020 & 2033
- Table 71: Global Food Texturizers Industry Revenue billion Forecast, by Application 2020 & 2033
- Table 72: Global Food Texturizers Industry Volume K Tons Forecast, by Application 2020 & 2033
- Table 73: Global Food Texturizers Industry Revenue billion Forecast, by Country 2020 & 2033
- Table 74: Global Food Texturizers Industry Volume K Tons Forecast, by Country 2020 & 2033
- Table 75: Global Food Texturizers Industry Revenue billion Forecast, by Type 2020 & 2033
- Table 76: Global Food Texturizers Industry Volume K Tons Forecast, by Type 2020 & 2033
- Table 77: Global Food Texturizers Industry Revenue billion Forecast, by Application 2020 & 2033
- Table 78: Global Food Texturizers Industry Volume K Tons Forecast, by Application 2020 & 2033
- Table 79: Global Food Texturizers Industry Revenue billion Forecast, by Country 2020 & 2033
- Table 80: Global Food Texturizers Industry Volume K Tons Forecast, by Country 2020 & 2033
- Table 81: Saudi Arabia Food Texturizers Industry Revenue (billion) Forecast, by Application 2020 & 2033
- Table 82: Saudi Arabia Food Texturizers Industry Volume (K Tons) Forecast, by Application 2020 & 2033
- Table 83: Rest of Middle East Food Texturizers Industry Revenue (billion) Forecast, by Application 2020 & 2033
- Table 84: Rest of Middle East Food Texturizers Industry Volume (K Tons) Forecast, by Application 2020 & 2033
Frequently Asked Questions
1. What is the projected Compound Annual Growth Rate (CAGR) of the Food Texturizers Industry?
The projected CAGR is approximately 7.3%.
2. Which companies are prominent players in the Food Texturizers Industry?
Key companies in the market include Tate & Lyle Plc, Cargill Incorporated, Archer Daniels Midland Co, Royal DSM N V, Palsgaard A/S, Kerry Inc, Ingredion Inc, DuPont, Fiberstar Inc *List Not Exhaustive, Estelle Chemicals Pvt Ltd.
3. What are the main segments of the Food Texturizers Industry?
The market segments include Type, Application.
4. Can you provide details about the market size?
The market size is estimated to be USD 10 billion as of 2022.
5. What are some drivers contributing to market growth?
Rising Incidence of Obesity and Cadiovascular Diseases; Growing Trend of Veganism Drives the Market.
6. What are the notable trends driving market growth?
Growing Demand for Low Calorie Food Products.
7. Are there any restraints impacting market growth?
Associated Allergies With Plant Proteins.
8. Can you provide examples of recent developments in the market?
April 2022: Cargill Salt announced it will invest USD 68 billion in expanding ST. Clair Plant. Investments being made by Cargill will enhance the plant's production capacity through increased automation, new technology, and efficiency improvements. The multi-year improvement project also includes constructing a new 50,000-square-foot evaporation facility to house a state-of-the-art dry processing line expected to reduce waste and increase capacity by up to 40%.
9. What pricing options are available for accessing the report?
Pricing options include single-user, multi-user, and enterprise licenses priced at USD 4750, USD 5250, and USD 8750 respectively.
10. Is the market size provided in terms of value or volume?
The market size is provided in terms of value, measured in billion and volume, measured in K Tons.
11. Are there any specific market keywords associated with the report?
Yes, the market keyword associated with the report is "Food Texturizers Industry," which aids in identifying and referencing the specific market segment covered.
12. How do I determine which pricing option suits my needs best?
The pricing options vary based on user requirements and access needs. Individual users may opt for single-user licenses, while businesses requiring broader access may choose multi-user or enterprise licenses for cost-effective access to the report.
13. Are there any additional resources or data provided in the Food Texturizers Industry report?
While the report offers comprehensive insights, it's advisable to review the specific contents or supplementary materials provided to ascertain if additional resources or data are available.
14. How can I stay updated on further developments or reports in the Food Texturizers Industry?
To stay informed about further developments, trends, and reports in the Food Texturizers Industry, consider subscribing to industry newsletters, following relevant companies and organizations, or regularly checking reputable industry news sources and publications.
Methodology
Step 1 - Identification of Relevant Samples Size from Population Database


Step 2 - Approaches for Defining Global Market Size (Value, Volume* & Price*)

Note*: In applicable scenarios
Step 3 - Data Sources
Primary Research
- Web Analytics
- Survey Reports
- Research Institute
- Latest Research Reports
- Opinion Leaders
Secondary Research
- Annual Reports
- White Paper
- Latest Press Release
- Industry Association
- Paid Database
- Investor Presentations

Step 4 - Data Triangulation
Involves using different sources of information in order to increase the validity of a study
These sources are likely to be stakeholders in a program - participants, other researchers, program staff, other community members, and so on.
Then we put all data in single framework & apply various statistical tools to find out the dynamic on the market.
During the analysis stage, feedback from the stakeholder groups would be compared to determine areas of agreement as well as areas of divergence