

Key Insights
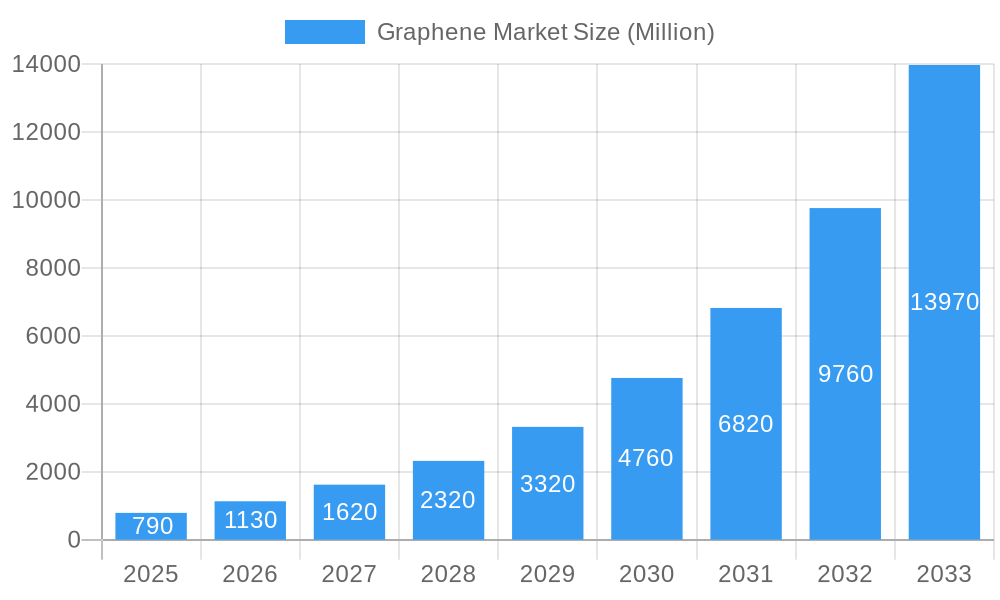
The global graphene market is poised for explosive growth, driven by its revolutionary properties and expanding applications across diverse industries. With a current market size of approximately $790 million, the industry is projected to witness an astonishing Compound Annual Growth Rate (CAGR) of 43.64% over the forecast period of 2025-2033. This surge is fueled by the increasing demand for advanced materials in sectors like electronics and telecommunications, where graphene's exceptional electrical conductivity and mechanical strength are revolutionizing component design for faster, smaller, and more energy-efficient devices. The biomedical and healthcare sector is also a significant growth engine, leveraging graphene for advanced drug delivery systems, biosensors, and diagnostic tools due to its biocompatibility and unique surface properties. Furthermore, its application in energy storage solutions, such as high-performance batteries and supercapacitors, is gaining traction as the world transitions towards sustainable energy.
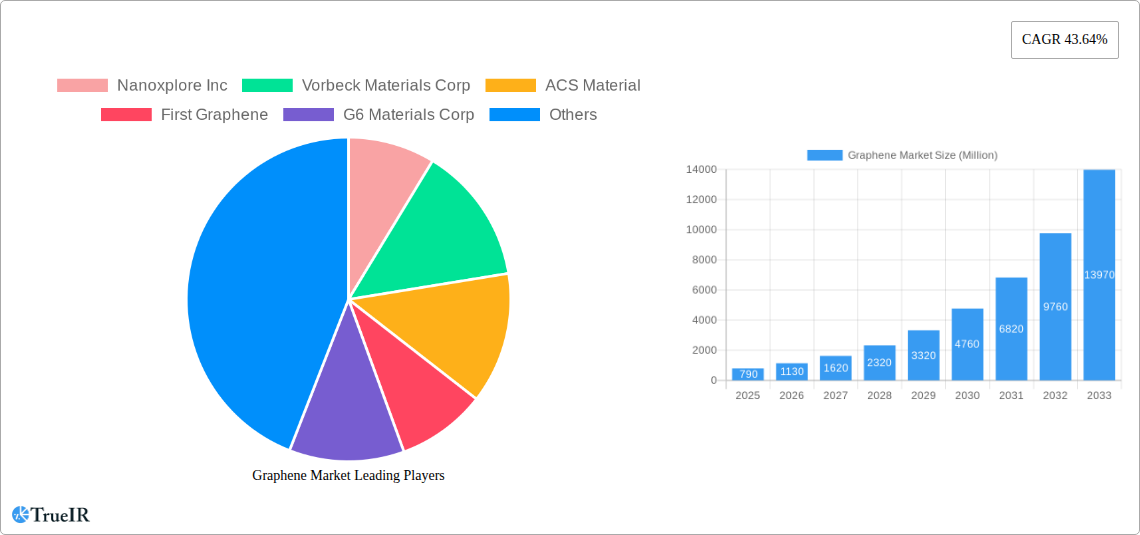
Graphene Market Market Size (In Million)
The market's expansion is further propelled by ongoing research and development, leading to the innovation of new graphene product types, including graphene sheets and films, nanoribbons, nanoplatelets, and graphene oxide, each catering to specific performance requirements. Companies like Nanoxplore Inc., Vorbeck Materials Corp., and ACS Material are at the forefront of this innovation, driving market penetration. While the market is experiencing robust growth, certain challenges, such as the high cost of production and scalability concerns, may present moderate restraints. However, continuous advancements in manufacturing techniques and increasing government support for nanotechnology are expected to mitigate these challenges. Geographically, the Asia Pacific region, particularly China, is anticipated to dominate the market, owing to its strong manufacturing base and significant investments in graphene research. The United States and Europe are also expected to be key growth regions, driven by technological advancements and the adoption of graphene in cutting-edge applications.
Graphene Market Company Market Share
Comprehensive Graphene Market Analysis: Trends, Opportunities, and Dominant Segments (2019-2033)
This in-depth Graphene Market report provides an exhaustive analysis of the global graphene industry, projecting significant growth and evolution from 2019 to 2033. With a base year of 2025 and a forecast period extending to 2033, this study delves into market dynamics, technological advancements, and competitive strategies shaping this transformative material sector. The report leverages high-volume SEO keywords like "graphene market size," "graphene applications," "graphene production," and "graphene market trends" to ensure maximum visibility and engagement for industry stakeholders.
Graphene Market Market Structure & Competitive Landscape
The graphene market, while experiencing rapid innovation, exhibits a moderately concentrated structure with key players investing heavily in research and development to gain a competitive edge. Innovation drivers are predominantly centered around improving graphene's cost-effectiveness in production, enhancing its integration into existing materials, and discovering novel applications across diverse sectors. Regulatory impacts, though evolving, are increasingly focused on standardization and safety protocols for scaled graphene production and utilization. Product substitutes, while present in niche applications, are yet to offer the comprehensive performance advantages of graphene. End-user segmentation reveals a dynamic landscape, with the electronics and telecommunication sector leading adoption, followed closely by bio-medical and healthcare, and energy. Mergers and acquisitions (M&A) are becoming pivotal strategic moves, as evidenced by the increasing volume of such transactions aimed at consolidating market share and expanding technological portfolios. For instance, in March 2023, Universal Matter UK Limited acquired Applied Graphene Materials UK Limited and its LLC, significantly bolstering Universal Matter's market standing and R&D capabilities in advanced graphene solutions. This consolidation trend indicates a maturing market where strategic alliances and acquisitions are key to sustained growth and competitive advantage. The market is anticipated to see further consolidation as companies seek economies of scale and integrated supply chains.
Graphene Market Market Trends & Opportunities
The global graphene market is poised for exponential expansion, driven by a confluence of technological breakthroughs, escalating demand from high-growth industries, and increasing investment in R&D. The market size is projected to witness a Compound Annual Growth Rate (CAGR) of approximately 30% from 2025 to 2033, reaching an estimated market valuation exceeding One Hundred Million by the end of the forecast period. This robust growth is fueled by the unique properties of graphene, including its exceptional electrical and thermal conductivity, remarkable strength, and ultra-lightweight nature. Technological shifts are moving towards more scalable and cost-effective graphene production methods, such as chemical vapor deposition (CVD) and liquid-phase exfoliation, making the material more accessible for widespread adoption. Consumer preferences are increasingly leaning towards products that offer enhanced performance, durability, and energy efficiency, areas where graphene provides significant advantages.
The competitive dynamics are characterized by intense innovation and strategic partnerships. Companies are focusing on developing specialized graphene grades tailored for specific applications, from advanced composites in aerospace to high-performance electrodes in batteries. The "graphene market opportunities" lie in developing graphene-enhanced materials for next-generation electronics, such as flexible displays and faster processors, and in the bio-medical field for drug delivery systems, biosensors, and tissue engineering. The energy sector presents substantial opportunities through graphene's role in improving battery efficiency, supercapacitors, and solar cells. Market penetration rates are expected to surge as production costs decline and a wider array of viable applications emerge. The continued investment in graphene research and the growing ecosystem of suppliers and end-users are critical factors driving this upward trajectory. The development of robust supply chains and standardized quality control measures will further accelerate market penetration.
Dominant Markets & Segments in Graphene Market
The graphene market's dominance is currently characterized by a strong presence in the Electronics and Telecommunication sector, driven by the demand for faster, smaller, and more efficient electronic devices. This segment is expected to maintain its leading position throughout the forecast period, with significant growth fueled by the development of advanced semiconductors, flexible electronics, and high-performance displays. The increasing integration of graphene in conductive inks, antistatic coatings, and thermal management solutions within electronic components further solidifies its dominance.
In terms of product types, Graphene Nanoplatelets are currently the most dominant, owing to their versatility and cost-effectiveness in applications like polymer composites, coatings, and lubricants. Their widespread use in enhancing mechanical strength and electrical conductivity in plastics makes them a preferred choice for various industrial applications.
The Energy sector represents another rapidly growing and strategically important segment. Graphene's application in advanced battery technologies, particularly for electric vehicles and energy storage systems, is a major growth catalyst. Improvements in battery capacity, charging speed, and lifespan, facilitated by graphene integration, are driving substantial market penetration.
The Bio-medical and Healthcare segment, while still in its nascent stages compared to electronics, holds immense future potential. Graphene's biocompatibility and unique properties make it ideal for applications in drug delivery, diagnostics, biosensing, and regenerative medicine. The increasing research and development in this area are expected to lead to significant market expansion in the coming years.
Regionally, Asia-Pacific continues to be the leading market for graphene, driven by its robust manufacturing base, strong government support for advanced materials, and significant investments in research and development. Countries like China and South Korea are at the forefront of graphene innovation and adoption across various industries.
Key growth drivers in these dominant segments include:
- Electronics and Telecommunication:
- Demand for high-speed data transmission and miniaturization of devices.
- Development of flexible and wearable electronics.
- Advancements in thermal management solutions for powerful processors.
- Energy:
- Growing demand for electric vehicles (EVs) and renewable energy storage solutions.
- Improvements in battery energy density and charging efficiency.
- Development of next-generation supercapacitors.
- Bio-medical and Healthcare:
- Advancements in targeted drug delivery systems.
- Development of highly sensitive biosensors for disease diagnosis.
- Research in regenerative medicine and tissue engineering.
- Product Type - Graphene Nanoplatelets:
- Cost-effective production methods.
- Ease of dispersion in various matrices.
- Versatility in enhancing mechanical and electrical properties of composites.
Graphene Market Product Analysis
Graphene product innovations are primarily focused on improving quality, scalability, and application-specific performance. Graphene sheets and films offer unparalleled surface area and electrical conductivity, making them crucial for advanced electronic components and sensors. Graphene nanoribbons, with their confined electrical properties, are key to developing next-generation transistors and quantum computing applications. Graphene nanoplatelets are gaining widespread adoption due to their cost-effectiveness and ability to enhance mechanical strength, thermal conductivity, and electrical properties in composites, coatings, and inks. Graphene oxide, a precursor to reduced graphene oxide, serves as a versatile building block for various graphene-based materials and finds applications in sensors, water purification, and biomedical research. These advancements cater to growing market demands for lighter, stronger, and more conductive materials across industries, driving competitive advantages through tailored functionalities and performance enhancements.
Key Drivers, Barriers & Challenges in Graphene Market
The graphene market is propelled by significant technological advancements in production techniques, leading to improved quality and reduced costs. The unique electrical and thermal conductivity of graphene is a key driver for its adoption in advanced electronics, energy storage, and composites. Economic factors, such as increasing investment in R&D and the growing demand for high-performance materials, further fuel market growth. Policy-driven initiatives supporting advanced materials research and development also play a crucial role.
However, the market faces several challenges. The high cost of production for high-quality graphene remains a significant barrier to widespread adoption, especially in price-sensitive applications. Supply chain issues, including consistent quality and availability of raw materials, can hinder scalability. Regulatory hurdles related to health and safety assessments for novel nanomaterials also present challenges. Competitive pressures from alternative materials and established technologies, coupled with the need for more robust and standardized application development, require continuous innovation and strategic market positioning.
Growth Drivers in the Graphene Market Market
Key growth drivers in the graphene market are fundamentally rooted in its unparalleled material properties and their application potential. Technologically, advancements in scalable and cost-effective graphene production methods, such as chemical vapor deposition (CVD) and exfoliation techniques, are crucial. Economic drivers include the burgeoning demand for lightweight, high-strength materials in aerospace and automotive industries, and the need for enhanced energy storage solutions in the rapidly expanding electric vehicle and renewable energy sectors. Regulatory factors, such as government incentives for nanotechnology research and development, and the increasing focus on material innovation for environmental sustainability, also contribute to market expansion. For instance, the demand for energy-efficient electronics is directly benefiting from graphene's superior thermal conductivity.
Challenges Impacting Graphene Market Growth
Significant challenges continue to impact the growth trajectory of the graphene market. The primary restraint remains the relatively high cost of producing high-quality graphene at scale, which limits its adoption in many mass-market applications. Supply chain complexities, including ensuring consistent material quality and availability across global manufacturers, pose another hurdle. Regulatory uncertainties surrounding the long-term health and environmental impacts of nanomaterials can also slow down commercialization and adoption, requiring extensive testing and certification. Furthermore, intense competitive pressures from existing advanced materials and the need for substantial investment in application-specific research and development create a challenging landscape for new entrants and established players alike. Overcoming these barriers is critical for unlocking graphene's full market potential.
Key Players Shaping the Graphene Market Market
- Nanoxplore Inc
- Vorbeck Materials Corp
- ACS Material
- First Graphene
- G6 Materials Corp
- Changzhou Two-Dimensional Carbon Technology Co Ltd
- Morsh (Ningbo Moxi Technology Co Ltd)
- The Sixth Element (Changzhou) Materials Technology Co Ltd
- Perpetuus Advanced Materials PLC
- Xiamen Knano Graphene Technology Corporation Limited
- Neograf
- Universal Matter
- Grafoid Inc
- Global Graphene Group
- Graphenano Group
- Thomas Swan & Co Ltd
- Haydale Graphene Industries PLC
- Graphenea
- Elcora Advanced Materials Corp
- Versarien PLC
- Graphene Manufacturing Group Ltd
Significant Graphene Market Industry Milestones
- March 2023: Universal Matter UK Limited, a subsidiary of Universal Matter Inc., acquired Applied Graphene Materials UK Limited and its LLC, significantly strengthening its market presence and technological capabilities.
- February 2023: Global Graphene Group announced that its subsidiary, Honeycomb Battery Company, signed a business combination agreement with Nubia Brand International Corp. to develop advanced battery materials, leveraging graphene produced by Global Graphene Group.
Future Outlook for Graphene Market Market
The future outlook for the graphene market is exceptionally bright, characterized by sustained high growth rates and an expanding array of transformative applications. Strategic opportunities lie in the continued refinement of graphene production techniques, aiming for even greater cost reductions and scalability to unlock new market segments. The increasing demand for advanced materials in sectors like electric vehicles, renewable energy, and personalized medicine will serve as significant growth catalysts. Furthermore, collaborations between graphene manufacturers, material scientists, and end-user industries will be crucial for developing commercially viable and impactful graphene-based solutions. The market potential is immense, driven by graphene's ability to revolutionize existing technologies and enable entirely new ones, promising a future where this "wonder material" plays a pivotal role across global industries.
Graphene Market Segmentation
-
1. Product Type
- 1.1. Graphene Sheets and Films
- 1.2. Nanoribbons
- 1.3. Nanoplatelets
- 1.4. Graphene Oxide
- 1.5. Other Product Types
-
2. End-user Industry
- 2.1. Electronics and Telecommunication
- 2.2. Bio-medical and Healthcare
- 2.3. Energy
- 2.4. Aerospace and Defense
- 2.5. Other End-user Industries
Graphene Market Segmentation By Geography
-
1. Asia Pacific
- 1.1. China
- 1.2. India
- 1.3. Japan
- 1.4. South Korea
- 1.5. Malaysia
- 1.6. Thailand
- 1.7. Indonesia
- 1.8. Vietnam
- 1.9. Rest of Asia Pacific
-
2. North America
- 2.1. United States
- 2.2. Canada
- 2.3. Mexico
-
3. Europe
- 3.1. Germany
- 3.2. United Kingdom
- 3.3. France
- 3.4. Italy
- 3.5. Spain
- 3.6. NORDIC Countries
- 3.7. Turkey
- 3.8. Russia
- 3.9. Rest of Europe
-
4. South America
- 4.1. Brazil
- 4.2. Argentina
- 4.3. Colombia
- 4.4. Rest of South America
-
5. Middle East and Africa
- 5.1. Saudi Arabia
- 5.2. Qatar
- 5.3. United Arab Emirates
- 5.4. Nigeria
- 5.5. Egypt
- 5.6. South Africa
- 5.7. Rest of Middle East and Africa
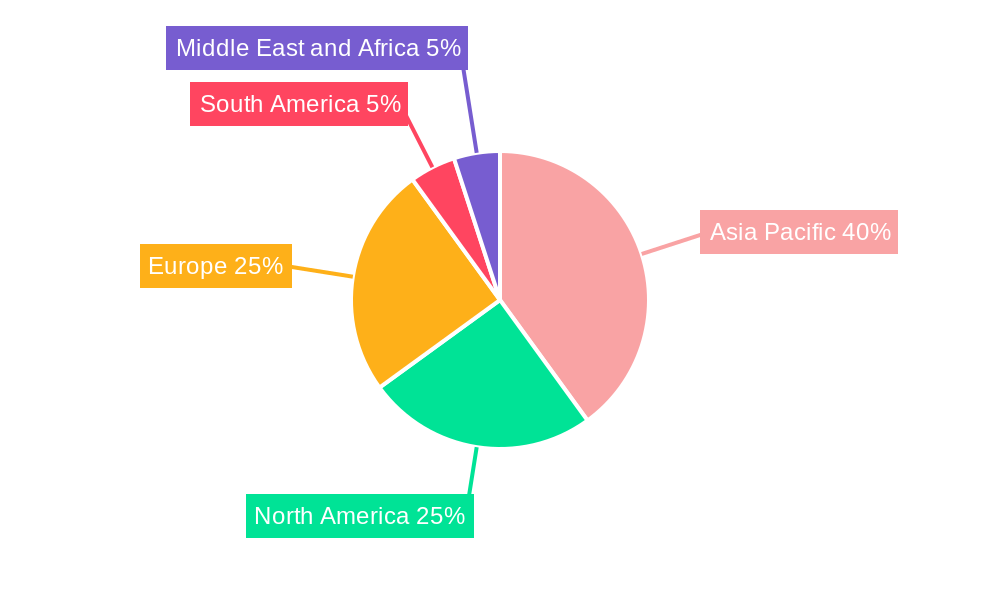
Graphene Market Regional Market Share
Geographic Coverage of Graphene Market
Graphene Market REPORT HIGHLIGHTS
| Aspects | Details |
|---|---|
| Study Period | 2020-2034 |
| Base Year | 2025 |
| Estimated Year | 2026 |
| Forecast Period | 2026-2034 |
| Historical Period | 2020-2025 |
| Growth Rate | CAGR of 43.64% from 2020-2034 |
| Segmentation |
|
Table of Contents
- 1. Introduction
- 1.1. Research Scope
- 1.2. Market Segmentation
- 1.3. Research Objective
- 1.4. Definitions and Assumptions
- 2. Executive Summary
- 2.1. Market Snapshot
- 3. Market Dynamics
- 3.1. Market Drivers
- 3.2. Market Restrains
- 3.3. Market Trends
- 3.4. Market Opportunities
- 4. Market Factor Analysis
- 4.1. Porters Five Forces
- 4.1.1. Bargaining Power of Suppliers
- 4.1.2. Bargaining Power of Buyers
- 4.1.3. Threat of New Entrants
- 4.1.4. Threat of Substitutes
- 4.1.5. Competitive Rivalry
- 4.2. PESTEL analysis
- 4.3. BCG Analysis
- 4.3.1. Stars (High Growth, High Market Share)
- 4.3.2. Cash Cows (Low Growth, High Market Share)
- 4.3.3. Question Mark (High Growth, Low Market Share)
- 4.3.4. Dogs (Low Growth, Low Market Share)
- 4.4. Ansoff Matrix Analysis
- 4.5. Supply Chain Analysis
- 4.6. Regulatory Landscape
- 4.7. Current Market Potential and Opportunity Assessment (TAM–SAM–SOM Framework)
- 4.8. TIR Analyst Note
- 4.1. Porters Five Forces
- 5. Market Analysis, Insights and Forecast 2021-2033
- 5.1. Market Analysis, Insights and Forecast - by Product Type
- 5.1.1. Graphene Sheets and Films
- 5.1.2. Nanoribbons
- 5.1.3. Nanoplatelets
- 5.1.4. Graphene Oxide
- 5.1.5. Other Product Types
- 5.2. Market Analysis, Insights and Forecast - by End-user Industry
- 5.2.1. Electronics and Telecommunication
- 5.2.2. Bio-medical and Healthcare
- 5.2.3. Energy
- 5.2.4. Aerospace and Defense
- 5.2.5. Other End-user Industries
- 5.3. Market Analysis, Insights and Forecast - by Region
- 5.3.1. Asia Pacific
- 5.3.2. North America
- 5.3.3. Europe
- 5.3.4. South America
- 5.3.5. Middle East and Africa
- 5.1. Market Analysis, Insights and Forecast - by Product Type
- 6. Global Graphene Market Analysis, Insights and Forecast, 2021-2033
- 6.1. Market Analysis, Insights and Forecast - by Product Type
- 6.1.1. Graphene Sheets and Films
- 6.1.2. Nanoribbons
- 6.1.3. Nanoplatelets
- 6.1.4. Graphene Oxide
- 6.1.5. Other Product Types
- 6.2. Market Analysis, Insights and Forecast - by End-user Industry
- 6.2.1. Electronics and Telecommunication
- 6.2.2. Bio-medical and Healthcare
- 6.2.3. Energy
- 6.2.4. Aerospace and Defense
- 6.2.5. Other End-user Industries
- 6.1. Market Analysis, Insights and Forecast - by Product Type
- 7. Asia Pacific Graphene Market Analysis, Insights and Forecast, 2020-2032
- 7.1. Market Analysis, Insights and Forecast - by Product Type
- 7.1.1. Graphene Sheets and Films
- 7.1.2. Nanoribbons
- 7.1.3. Nanoplatelets
- 7.1.4. Graphene Oxide
- 7.1.5. Other Product Types
- 7.2. Market Analysis, Insights and Forecast - by End-user Industry
- 7.2.1. Electronics and Telecommunication
- 7.2.2. Bio-medical and Healthcare
- 7.2.3. Energy
- 7.2.4. Aerospace and Defense
- 7.2.5. Other End-user Industries
- 7.1. Market Analysis, Insights and Forecast - by Product Type
- 8. North America Graphene Market Analysis, Insights and Forecast, 2020-2032
- 8.1. Market Analysis, Insights and Forecast - by Product Type
- 8.1.1. Graphene Sheets and Films
- 8.1.2. Nanoribbons
- 8.1.3. Nanoplatelets
- 8.1.4. Graphene Oxide
- 8.1.5. Other Product Types
- 8.2. Market Analysis, Insights and Forecast - by End-user Industry
- 8.2.1. Electronics and Telecommunication
- 8.2.2. Bio-medical and Healthcare
- 8.2.3. Energy
- 8.2.4. Aerospace and Defense
- 8.2.5. Other End-user Industries
- 8.1. Market Analysis, Insights and Forecast - by Product Type
- 9. Europe Graphene Market Analysis, Insights and Forecast, 2020-2032
- 9.1. Market Analysis, Insights and Forecast - by Product Type
- 9.1.1. Graphene Sheets and Films
- 9.1.2. Nanoribbons
- 9.1.3. Nanoplatelets
- 9.1.4. Graphene Oxide
- 9.1.5. Other Product Types
- 9.2. Market Analysis, Insights and Forecast - by End-user Industry
- 9.2.1. Electronics and Telecommunication
- 9.2.2. Bio-medical and Healthcare
- 9.2.3. Energy
- 9.2.4. Aerospace and Defense
- 9.2.5. Other End-user Industries
- 9.1. Market Analysis, Insights and Forecast - by Product Type
- 10. South America Graphene Market Analysis, Insights and Forecast, 2020-2032
- 10.1. Market Analysis, Insights and Forecast - by Product Type
- 10.1.1. Graphene Sheets and Films
- 10.1.2. Nanoribbons
- 10.1.3. Nanoplatelets
- 10.1.4. Graphene Oxide
- 10.1.5. Other Product Types
- 10.2. Market Analysis, Insights and Forecast - by End-user Industry
- 10.2.1. Electronics and Telecommunication
- 10.2.2. Bio-medical and Healthcare
- 10.2.3. Energy
- 10.2.4. Aerospace and Defense
- 10.2.5. Other End-user Industries
- 10.1. Market Analysis, Insights and Forecast - by Product Type
- 11. Middle East and Africa Graphene Market Analysis, Insights and Forecast, 2020-2032
- 11.1. Market Analysis, Insights and Forecast - by Product Type
- 11.1.1. Graphene Sheets and Films
- 11.1.2. Nanoribbons
- 11.1.3. Nanoplatelets
- 11.1.4. Graphene Oxide
- 11.1.5. Other Product Types
- 11.2. Market Analysis, Insights and Forecast - by End-user Industry
- 11.2.1. Electronics and Telecommunication
- 11.2.2. Bio-medical and Healthcare
- 11.2.3. Energy
- 11.2.4. Aerospace and Defense
- 11.2.5. Other End-user Industries
- 11.1. Market Analysis, Insights and Forecast - by Product Type
- 12. Competitive Analysis
- 12.1. Company Profiles
- 12.1.1 Nanoxplore Inc
- 12.1.1.1. Company Overview
- 12.1.1.2. Products
- 12.1.1.3. Company Financials
- 12.1.1.4. SWOT Analysis
- 12.1.2 Vorbeck Materials Corp
- 12.1.2.1. Company Overview
- 12.1.2.2. Products
- 12.1.2.3. Company Financials
- 12.1.2.4. SWOT Analysis
- 12.1.3 ACS Material
- 12.1.3.1. Company Overview
- 12.1.3.2. Products
- 12.1.3.3. Company Financials
- 12.1.3.4. SWOT Analysis
- 12.1.4 First Graphene
- 12.1.4.1. Company Overview
- 12.1.4.2. Products
- 12.1.4.3. Company Financials
- 12.1.4.4. SWOT Analysis
- 12.1.5 G6 Materials Corp
- 12.1.5.1. Company Overview
- 12.1.5.2. Products
- 12.1.5.3. Company Financials
- 12.1.5.4. SWOT Analysis
- 12.1.6 Changzhou Two-Dimensional Carbon Technology Co Ltd
- 12.1.6.1. Company Overview
- 12.1.6.2. Products
- 12.1.6.3. Company Financials
- 12.1.6.4. SWOT Analysis
- 12.1.7 Morsh (Ningbo Moxi Technology Co Ltd)
- 12.1.7.1. Company Overview
- 12.1.7.2. Products
- 12.1.7.3. Company Financials
- 12.1.7.4. SWOT Analysis
- 12.1.8 The Sixth Element (Changzhou) Materials Technology Co Ltd
- 12.1.8.1. Company Overview
- 12.1.8.2. Products
- 12.1.8.3. Company Financials
- 12.1.8.4. SWOT Analysis
- 12.1.9 Perpetuus Advanced Materials PLC
- 12.1.9.1. Company Overview
- 12.1.9.2. Products
- 12.1.9.3. Company Financials
- 12.1.9.4. SWOT Analysis
- 12.1.10 Xiamen Knano Graphene Technology Corporation Limited*List Not Exhaustive
- 12.1.10.1. Company Overview
- 12.1.10.2. Products
- 12.1.10.3. Company Financials
- 12.1.10.4. SWOT Analysis
- 12.1.11 Neograf
- 12.1.11.1. Company Overview
- 12.1.11.2. Products
- 12.1.11.3. Company Financials
- 12.1.11.4. SWOT Analysis
- 12.1.12 Universal Matter
- 12.1.12.1. Company Overview
- 12.1.12.2. Products
- 12.1.12.3. Company Financials
- 12.1.12.4. SWOT Analysis
- 12.1.13 Grafoid Inc
- 12.1.13.1. Company Overview
- 12.1.13.2. Products
- 12.1.13.3. Company Financials
- 12.1.13.4. SWOT Analysis
- 12.1.14 Graphene Production
- 12.1.14.1. Company Overview
- 12.1.14.2. Products
- 12.1.14.3. Company Financials
- 12.1.14.4. SWOT Analysis
- 12.1.15 Global Graphene Group
- 12.1.15.1. Company Overview
- 12.1.15.2. Products
- 12.1.15.3. Company Financials
- 12.1.15.4. SWOT Analysis
- 12.1.16 Graphenano Group
- 12.1.16.1. Company Overview
- 12.1.16.2. Products
- 12.1.16.3. Company Financials
- 12.1.16.4. SWOT Analysis
- 12.1.17 Thomas Swan & Co Ltd
- 12.1.17.1. Company Overview
- 12.1.17.2. Products
- 12.1.17.3. Company Financials
- 12.1.17.4. SWOT Analysis
- 12.1.18 Haydale Graphene Industries PLC
- 12.1.18.1. Company Overview
- 12.1.18.2. Products
- 12.1.18.3. Company Financials
- 12.1.18.4. SWOT Analysis
- 12.1.19 Graphenea
- 12.1.19.1. Company Overview
- 12.1.19.2. Products
- 12.1.19.3. Company Financials
- 12.1.19.4. SWOT Analysis
- 12.1.20 Elcora Advanced Materials Corp
- 12.1.20.1. Company Overview
- 12.1.20.2. Products
- 12.1.20.3. Company Financials
- 12.1.20.4. SWOT Analysis
- 12.1.21 Versarien PLC
- 12.1.21.1. Company Overview
- 12.1.21.2. Products
- 12.1.21.3. Company Financials
- 12.1.21.4. SWOT Analysis
- 12.1.22 Graphene Manufacturing Group Ltd
- 12.1.22.1. Company Overview
- 12.1.22.2. Products
- 12.1.22.3. Company Financials
- 12.1.22.4. SWOT Analysis
- 12.1.1 Nanoxplore Inc
- 12.2. Market Entropy
- 12.2.1 Company's Key Areas Served
- 12.2.2 Recent Developments
- 12.3. Company Market Share Analysis 2025
- 12.3.1 Top 5 Companies Market Share Analysis
- 12.3.2 Top 3 Companies Market Share Analysis
- 12.4. List of Potential Customers
- 13. Research Methodology
List of Figures
- Figure 1: Global Graphene Market Revenue Breakdown (Million, %) by Region 2025 & 2033
- Figure 2: Asia Pacific Graphene Market Revenue (Million), by Product Type 2025 & 2033
- Figure 3: Asia Pacific Graphene Market Revenue Share (%), by Product Type 2025 & 2033
- Figure 4: Asia Pacific Graphene Market Revenue (Million), by End-user Industry 2025 & 2033
- Figure 5: Asia Pacific Graphene Market Revenue Share (%), by End-user Industry 2025 & 2033
- Figure 6: Asia Pacific Graphene Market Revenue (Million), by Country 2025 & 2033
- Figure 7: Asia Pacific Graphene Market Revenue Share (%), by Country 2025 & 2033
- Figure 8: North America Graphene Market Revenue (Million), by Product Type 2025 & 2033
- Figure 9: North America Graphene Market Revenue Share (%), by Product Type 2025 & 2033
- Figure 10: North America Graphene Market Revenue (Million), by End-user Industry 2025 & 2033
- Figure 11: North America Graphene Market Revenue Share (%), by End-user Industry 2025 & 2033
- Figure 12: North America Graphene Market Revenue (Million), by Country 2025 & 2033
- Figure 13: North America Graphene Market Revenue Share (%), by Country 2025 & 2033
- Figure 14: Europe Graphene Market Revenue (Million), by Product Type 2025 & 2033
- Figure 15: Europe Graphene Market Revenue Share (%), by Product Type 2025 & 2033
- Figure 16: Europe Graphene Market Revenue (Million), by End-user Industry 2025 & 2033
- Figure 17: Europe Graphene Market Revenue Share (%), by End-user Industry 2025 & 2033
- Figure 18: Europe Graphene Market Revenue (Million), by Country 2025 & 2033
- Figure 19: Europe Graphene Market Revenue Share (%), by Country 2025 & 2033
- Figure 20: South America Graphene Market Revenue (Million), by Product Type 2025 & 2033
- Figure 21: South America Graphene Market Revenue Share (%), by Product Type 2025 & 2033
- Figure 22: South America Graphene Market Revenue (Million), by End-user Industry 2025 & 2033
- Figure 23: South America Graphene Market Revenue Share (%), by End-user Industry 2025 & 2033
- Figure 24: South America Graphene Market Revenue (Million), by Country 2025 & 2033
- Figure 25: South America Graphene Market Revenue Share (%), by Country 2025 & 2033
- Figure 26: Middle East and Africa Graphene Market Revenue (Million), by Product Type 2025 & 2033
- Figure 27: Middle East and Africa Graphene Market Revenue Share (%), by Product Type 2025 & 2033
- Figure 28: Middle East and Africa Graphene Market Revenue (Million), by End-user Industry 2025 & 2033
- Figure 29: Middle East and Africa Graphene Market Revenue Share (%), by End-user Industry 2025 & 2033
- Figure 30: Middle East and Africa Graphene Market Revenue (Million), by Country 2025 & 2033
- Figure 31: Middle East and Africa Graphene Market Revenue Share (%), by Country 2025 & 2033
List of Tables
- Table 1: Global Graphene Market Revenue Million Forecast, by Product Type 2020 & 2033
- Table 2: Global Graphene Market Revenue Million Forecast, by End-user Industry 2020 & 2033
- Table 3: Global Graphene Market Revenue Million Forecast, by Region 2020 & 2033
- Table 4: Global Graphene Market Revenue Million Forecast, by Product Type 2020 & 2033
- Table 5: Global Graphene Market Revenue Million Forecast, by End-user Industry 2020 & 2033
- Table 6: Global Graphene Market Revenue Million Forecast, by Country 2020 & 2033
- Table 7: China Graphene Market Revenue (Million) Forecast, by Application 2020 & 2033
- Table 8: India Graphene Market Revenue (Million) Forecast, by Application 2020 & 2033
- Table 9: Japan Graphene Market Revenue (Million) Forecast, by Application 2020 & 2033
- Table 10: South Korea Graphene Market Revenue (Million) Forecast, by Application 2020 & 2033
- Table 11: Malaysia Graphene Market Revenue (Million) Forecast, by Application 2020 & 2033
- Table 12: Thailand Graphene Market Revenue (Million) Forecast, by Application 2020 & 2033
- Table 13: Indonesia Graphene Market Revenue (Million) Forecast, by Application 2020 & 2033
- Table 14: Vietnam Graphene Market Revenue (Million) Forecast, by Application 2020 & 2033
- Table 15: Rest of Asia Pacific Graphene Market Revenue (Million) Forecast, by Application 2020 & 2033
- Table 16: Global Graphene Market Revenue Million Forecast, by Product Type 2020 & 2033
- Table 17: Global Graphene Market Revenue Million Forecast, by End-user Industry 2020 & 2033
- Table 18: Global Graphene Market Revenue Million Forecast, by Country 2020 & 2033
- Table 19: United States Graphene Market Revenue (Million) Forecast, by Application 2020 & 2033
- Table 20: Canada Graphene Market Revenue (Million) Forecast, by Application 2020 & 2033
- Table 21: Mexico Graphene Market Revenue (Million) Forecast, by Application 2020 & 2033
- Table 22: Global Graphene Market Revenue Million Forecast, by Product Type 2020 & 2033
- Table 23: Global Graphene Market Revenue Million Forecast, by End-user Industry 2020 & 2033
- Table 24: Global Graphene Market Revenue Million Forecast, by Country 2020 & 2033
- Table 25: Germany Graphene Market Revenue (Million) Forecast, by Application 2020 & 2033
- Table 26: United Kingdom Graphene Market Revenue (Million) Forecast, by Application 2020 & 2033
- Table 27: France Graphene Market Revenue (Million) Forecast, by Application 2020 & 2033
- Table 28: Italy Graphene Market Revenue (Million) Forecast, by Application 2020 & 2033
- Table 29: Spain Graphene Market Revenue (Million) Forecast, by Application 2020 & 2033
- Table 30: NORDIC Countries Graphene Market Revenue (Million) Forecast, by Application 2020 & 2033
- Table 31: Turkey Graphene Market Revenue (Million) Forecast, by Application 2020 & 2033
- Table 32: Russia Graphene Market Revenue (Million) Forecast, by Application 2020 & 2033
- Table 33: Rest of Europe Graphene Market Revenue (Million) Forecast, by Application 2020 & 2033
- Table 34: Global Graphene Market Revenue Million Forecast, by Product Type 2020 & 2033
- Table 35: Global Graphene Market Revenue Million Forecast, by End-user Industry 2020 & 2033
- Table 36: Global Graphene Market Revenue Million Forecast, by Country 2020 & 2033
- Table 37: Brazil Graphene Market Revenue (Million) Forecast, by Application 2020 & 2033
- Table 38: Argentina Graphene Market Revenue (Million) Forecast, by Application 2020 & 2033
- Table 39: Colombia Graphene Market Revenue (Million) Forecast, by Application 2020 & 2033
- Table 40: Rest of South America Graphene Market Revenue (Million) Forecast, by Application 2020 & 2033
- Table 41: Global Graphene Market Revenue Million Forecast, by Product Type 2020 & 2033
- Table 42: Global Graphene Market Revenue Million Forecast, by End-user Industry 2020 & 2033
- Table 43: Global Graphene Market Revenue Million Forecast, by Country 2020 & 2033
- Table 44: Saudi Arabia Graphene Market Revenue (Million) Forecast, by Application 2020 & 2033
- Table 45: Qatar Graphene Market Revenue (Million) Forecast, by Application 2020 & 2033
- Table 46: United Arab Emirates Graphene Market Revenue (Million) Forecast, by Application 2020 & 2033
- Table 47: Nigeria Graphene Market Revenue (Million) Forecast, by Application 2020 & 2033
- Table 48: Egypt Graphene Market Revenue (Million) Forecast, by Application 2020 & 2033
- Table 49: South Africa Graphene Market Revenue (Million) Forecast, by Application 2020 & 2033
- Table 50: Rest of Middle East and Africa Graphene Market Revenue (Million) Forecast, by Application 2020 & 2033
Frequently Asked Questions
1. What is the projected Compound Annual Growth Rate (CAGR) of the Graphene Market?
The projected CAGR is approximately 43.64%.
2. Which companies are prominent players in the Graphene Market?
Key companies in the market include Nanoxplore Inc, Vorbeck Materials Corp, ACS Material, First Graphene, G6 Materials Corp, Changzhou Two-Dimensional Carbon Technology Co Ltd, Morsh (Ningbo Moxi Technology Co Ltd), The Sixth Element (Changzhou) Materials Technology Co Ltd, Perpetuus Advanced Materials PLC, Xiamen Knano Graphene Technology Corporation Limited*List Not Exhaustive, Neograf, Universal Matter, Grafoid Inc, Graphene Production, Global Graphene Group, Graphenano Group, Thomas Swan & Co Ltd, Haydale Graphene Industries PLC, Graphenea, Elcora Advanced Materials Corp, Versarien PLC, Graphene Manufacturing Group Ltd.
3. What are the main segments of the Graphene Market?
The market segments include Product Type, End-user Industry.
4. Can you provide details about the market size?
The market size is estimated to be USD 0.79 Million as of 2022.
5. What are some drivers contributing to market growth?
Graphene Aiding the Aerospace Industry; Rising Demand for Printed Electronics.
6. What are the notable trends driving market growth?
Electronics and Telecommunication Segment to Dominate the Market.
7. Are there any restraints impacting market growth?
Higher Costs of Technology.
8. Can you provide examples of recent developments in the market?
In March 2023, Universal Matter UK Limited, a wholly-owned subsidiary of Universal Matter Inc., announced the acquisition of Applied Graphene Materials UK Limited and Applied Graphene Materials LLC, the principal operating subsidiaries of Applied Graphene Materials PLC. Through the acquisition, the company has strengthened its market presence.
9. What pricing options are available for accessing the report?
Pricing options include single-user, multi-user, and enterprise licenses priced at USD 4750, USD 5250, and USD 8750 respectively.
10. Is the market size provided in terms of value or volume?
The market size is provided in terms of value, measured in Million.
11. Are there any specific market keywords associated with the report?
Yes, the market keyword associated with the report is "Graphene Market," which aids in identifying and referencing the specific market segment covered.
12. How do I determine which pricing option suits my needs best?
The pricing options vary based on user requirements and access needs. Individual users may opt for single-user licenses, while businesses requiring broader access may choose multi-user or enterprise licenses for cost-effective access to the report.
13. Are there any additional resources or data provided in the Graphene Market report?
While the report offers comprehensive insights, it's advisable to review the specific contents or supplementary materials provided to ascertain if additional resources or data are available.
14. How can I stay updated on further developments or reports in the Graphene Market?
To stay informed about further developments, trends, and reports in the Graphene Market, consider subscribing to industry newsletters, following relevant companies and organizations, or regularly checking reputable industry news sources and publications.
Methodology
Step 1 - Identification of Relevant Samples Size from Population Database


Step 2 - Approaches for Defining Global Market Size (Value, Volume* & Price*)

Note*: In applicable scenarios
Step 3 - Data Sources
Primary Research
- Web Analytics
- Survey Reports
- Research Institute
- Latest Research Reports
- Opinion Leaders
Secondary Research
- Annual Reports
- White Paper
- Latest Press Release
- Industry Association
- Paid Database
- Investor Presentations

Step 4 - Data Triangulation
Involves using different sources of information in order to increase the validity of a study
These sources are likely to be stakeholders in a program - participants, other researchers, program staff, other community members, and so on.
Then we put all data in single framework & apply various statistical tools to find out the dynamic on the market.
During the analysis stage, feedback from the stakeholder groups would be compared to determine areas of agreement as well as areas of divergence