

Key Insights
The global Poly Aluminum Chloride (PAC) market is poised for robust expansion, projected to surpass \$1.2 billion by 2025 and maintain a Compound Annual Growth Rate (CAGR) exceeding 4.00% through 2033. This growth trajectory is primarily fueled by the escalating demand for efficient water treatment solutions across municipal and industrial sectors, driven by stringent environmental regulations and increasing water scarcity concerns. The paper industry also represents a significant consumer, utilizing PAC as a crucial coagulant and flocculant in papermaking processes to enhance paper quality and reduce effluent pollution. Emerging economies, particularly in the Asia Pacific region, are anticipated to be major growth engines, owing to rapid industrialization, urbanization, and a burgeoning need for clean water and improved sanitation infrastructure.
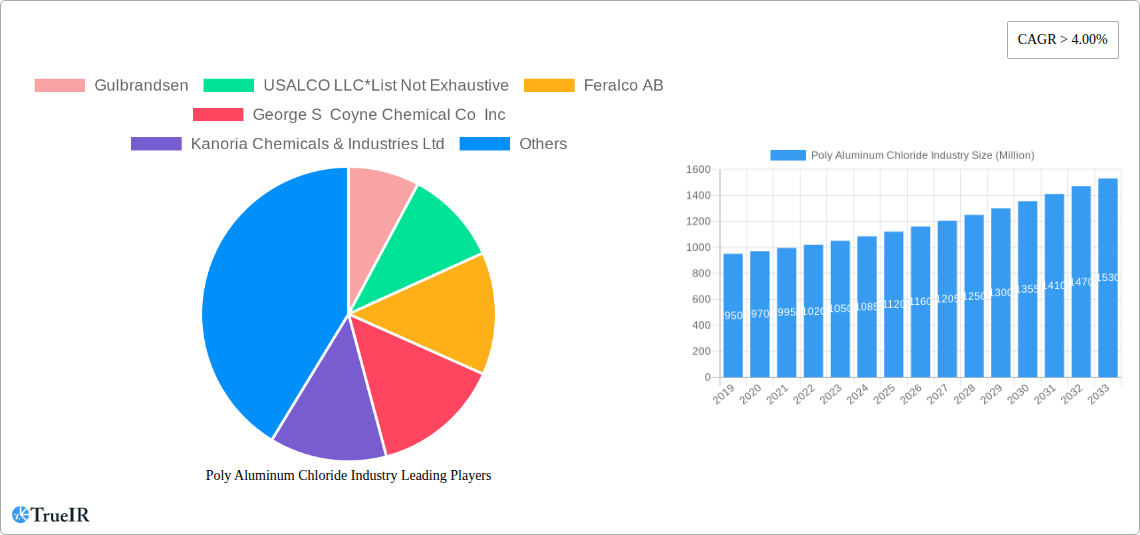
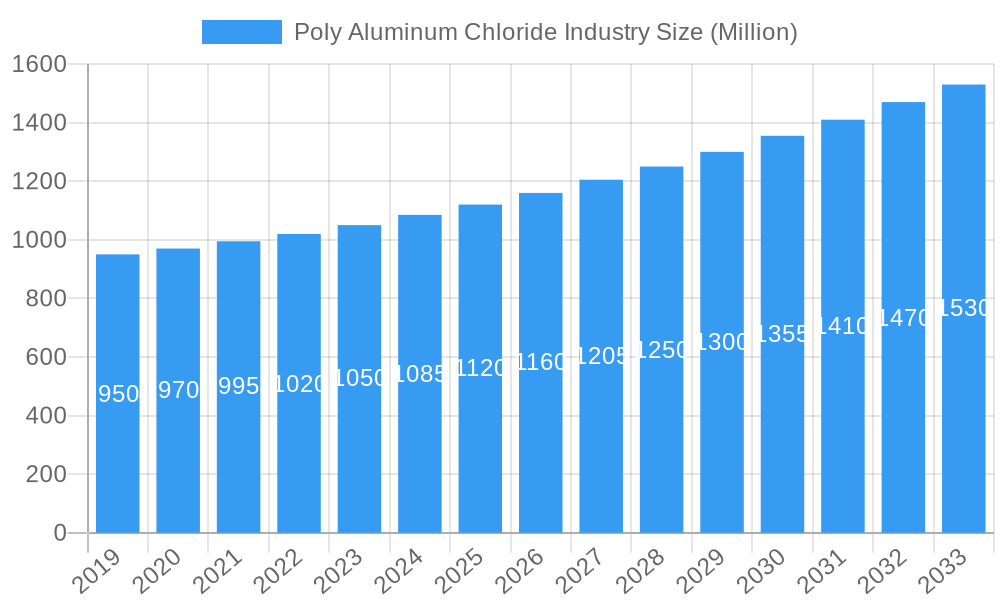
Poly Aluminum Chloride Industry Market Size (In Million)
Further bolstering market growth are the inherent advantages of PAC, including its superior performance over traditional coagulants like aluminum sulfate in terms of efficiency, cost-effectiveness, and wider pH operating range. The market is segmented by form into solid and liquid variants, with both witnessing steady demand, though liquid PAC often finds favor in large-scale industrial applications for ease of handling. Geographically, North America and Europe currently hold significant market shares, driven by established water treatment infrastructure and advanced manufacturing capabilities. However, the Asia Pacific region, led by China and India, is expected to witness the fastest growth, presenting substantial opportunities for market players. Key players like Kemira, Gulbrandsen, and USALCO LLC are actively investing in research and development to innovate product offerings and expand their geographical reach to capitalize on these dynamic market trends.
Poly Aluminum Chloride Industry Company Market Share
Poly Aluminum Chloride Industry Market Structure & Competitive Landscape
The global Poly Aluminum Chloride (PAC) industry, a critical component in water purification and various industrial processes, exhibits a moderately concentrated market structure. The presence of several key global players, including Gulbrandsen, USALCO LLC, Feralco AB, George S Coyne Chemical Co Inc, Kanoria Chemicals & Industries Ltd, Airedale Chemical, Kemira, GEO Specialty Chemicals Inc, Summit Chemical Specialty Products LLC, Synergy Multichem Pvt Ltd, HOLLAND COMPANY, and Aditya Birla Chemicals (India) Limited, indicates a competitive yet consolidated landscape. Innovation drivers are primarily focused on enhancing PAC's efficacy in water treatment, developing specialized grades for niche applications (such as in the paper and oil & gas sectors), and improving production efficiency to reduce costs. Regulatory impacts, particularly concerning environmental standards for wastewater discharge and drinking water quality, significantly shape product development and market entry strategies. The threat of product substitutes, such as Ferric Chloride and Aluminum Sulfate, remains a constant consideration, pushing PAC manufacturers to highlight their superior performance and cost-effectiveness in specific applications. End-user segmentation reveals the dominant influence of the Water Treatment sector, followed by the Paper Industry, with growing contributions from Cosmetics and Personal Care, and Oil and Gas. Mergers and acquisitions (M&A) activity has been a notable trend, with an estimated XX Million in M&A deal value over the historical period, aimed at expanding market reach, acquiring new technologies, and consolidating market share. For instance, the concentration ratio among the top 5 players is estimated at XX%, signifying a substantial market share controlled by these entities.
Poly Aluminum Chloride Industry Market Trends & Opportunities
The global Poly Aluminum Chloride (PAC) market is poised for robust growth, driven by escalating demand for clean water and the expanding applications of PAC across various industrial sectors. The market size, estimated at approximately XX Billion in the base year of 2025, is projected to witness a Compound Annual Growth Rate (CAGR) of XX% during the forecast period of 2025–2033. This impressive expansion is underpinned by several significant market trends.
Technological advancements are at the forefront of this growth, with manufacturers increasingly focusing on developing high-performance PAC formulations. This includes innovations in producing PAC with higher basicity and lower impurity levels, leading to enhanced flocculation efficiency and reduced sludge generation. The shift towards more sustainable and environmentally friendly production processes is also gaining momentum, driven by stringent environmental regulations and growing consumer awareness. Opportunities exist for companies that can offer bio-based or recycled content in their PAC products.
Consumer preferences are evolving, with a growing emphasis on water quality and safety. This translates into increased adoption of PAC in municipal water treatment plants and industrial wastewater management. Furthermore, the growing population and rapid urbanization worldwide are directly fueling the demand for potable water and efficient wastewater treatment solutions, making the water treatment segment a dominant force in the PAC market.
Competitive dynamics within the PAC industry are characterized by a blend of global giants and regional players. Strategic partnerships, joint ventures, and acquisitions are prevalent strategies employed by companies to expand their geographical footprint, enhance their product portfolios, and gain a competitive edge. The market penetration rate of PAC in developed economies is already high, presenting opportunities for growth in emerging economies where infrastructure development and industrialization are on the rise. The increasing use of PAC in the paper industry for sizing and retention, as well as its emerging applications in cosmetics and personal care for antiperspirant formulations and in the oil and gas sector for drilling fluid additives, further diversifies the market and presents new avenues for revenue generation. The forecast period is expected to see a continuous upward trajectory in market size, driven by both established applications and nascent market explorations.
Dominant Markets & Segments in Poly Aluminum Chloride Industry
The Water Treatment end-user industry unequivocally dominates the global Poly Aluminum Chloride (PAC) market, driven by a confluence of factors that underscore the critical need for clean water and efficient wastewater management worldwide. This segment accounts for an estimated XX% of the total market revenue in the base year 2025.
Key Growth Drivers in the Water Treatment Segment:
- Rising Global Population and Urbanization: Increased population density necessitates enhanced water purification capabilities for both potable water and sewage treatment.
- Stringent Environmental Regulations: Governments globally are implementing stricter regulations on wastewater discharge, compelling industries and municipalities to adopt advanced treatment chemicals like PAC.
- Infrastructure Development: Significant investments in water and wastewater treatment infrastructure, particularly in developing economies, are creating substantial demand for PAC.
- Growing Awareness of Waterborne Diseases: Public health concerns and the desire to prevent waterborne illnesses are pushing for higher standards in water treatment.
The Liquid form of PAC holds a significant market share, estimated at XX% in 2025, owing to its ease of handling, dosing, and dissolution in water treatment applications. However, the Solid form is also crucial, particularly for its higher concentration and longer shelf life, finding use in regions with logistical challenges or for specific industrial processes.
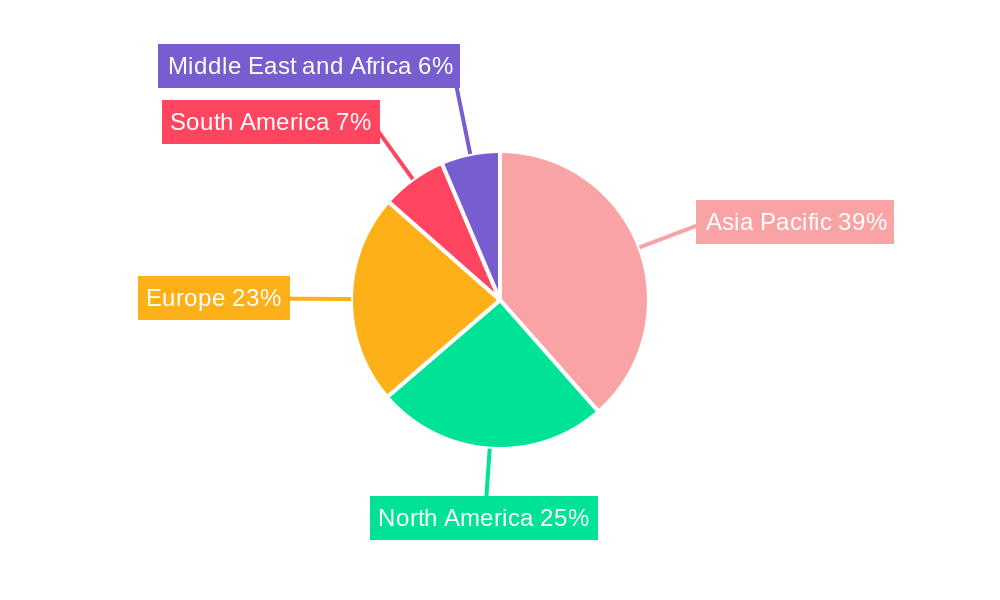
Geographically, Asia Pacific is emerging as the dominant region for PAC consumption, projected to account for XX% of the global market by 2025. This dominance is fueled by rapid industrialization, massive infrastructure projects, and growing populations in countries like China and India, where water scarcity and pollution are pressing concerns. The Paper Industry represents the second-largest end-user segment, consuming an estimated XX% of PAC for applications such as improving paper strength, brightness, and retention of fillers. While smaller in market share, the Cosmetics and Personal Care industry is a notable growth segment, utilizing PAC in antiperspirants and deodorants. The Oil and Gas sector also contributes, employing PAC in drilling fluids and for wastewater treatment in exploration and production activities. The "Other End-user Industries" category encompasses diverse applications in textiles, mining, and food processing, collectively contributing to the overall market demand.
Poly Aluminum Chloride Industry Product Analysis
Poly Aluminum Chloride (PAC) products are continuously evolving to meet stringent performance demands across diverse industries. Innovations focus on enhancing basicity, optimizing impurity profiles, and developing specialized grades for specific applications. Key product advancements include the development of high-purity PAC with superior coagulation and flocculation capabilities, leading to improved water clarity and reduced sludge formation in water treatment. For the paper industry, advancements have led to PAC formulations that offer better retention and drainage properties, contributing to paper quality and production efficiency. The competitive advantage of PAC lies in its effectiveness over a wider pH range compared to traditional coagulants, its lower dosage requirements, and its ability to produce less sludge, making it an economically and environmentally sound choice for many industrial processes.
Key Drivers, Barriers & Challenges in Poly Aluminum Chloride Industry
Key Drivers, Barriers & Challenges in Poly Aluminum Chloride Industry
The Poly Aluminum Chloride (PAC) industry is propelled by several key drivers. The escalating global demand for clean water, driven by population growth and industrial expansion, is a primary catalyst. Increasingly stringent environmental regulations worldwide, mandating improved wastewater treatment standards, further boost PAC adoption. Technological advancements leading to more efficient and cost-effective PAC production, along with its proven effectiveness in applications like the paper and oil & gas industries, also contribute significantly. For instance, the increasing investment in water infrastructure projects, estimated at XX Billion globally over the historical period, directly translates to higher PAC consumption.
However, the industry faces significant barriers and challenges. Fluctuations in the prices of raw materials, such as bauxite and hydrochloric acid, can impact production costs and profitability. Intense competition from established and emerging players, as well as from alternative coagulants like ferric chloride and aluminum sulfate, puts pressure on pricing and market share. Navigating complex and varying regulatory landscapes across different regions can also pose a challenge for market expansion. Supply chain disruptions, as evidenced by XX% increase in logistics costs over the historical period, can impact product availability and delivery timelines.
Growth Drivers in the Poly Aluminum Chloride Industry Market
The Poly Aluminum Chloride (PAC) market's growth is significantly fueled by a combination of technological, economic, and policy-driven factors. Technologically, advancements in production processes are yielding PAC with higher purity and improved performance characteristics, leading to more efficient water treatment and industrial applications. Economically, the sustained global demand for clean water, coupled with the rapid industrialization of emerging economies, creates a consistently expanding market base. Policy-wise, stricter environmental regulations worldwide, particularly concerning water quality and wastewater discharge, are compelling industries and municipalities to invest in advanced treatment solutions like PAC. For example, government initiatives promoting water recycling and reuse directly enhance PAC demand. The development of specialized PAC grades for niche applications also opens up new revenue streams.
Challenges Impacting Poly Aluminum Chloride Industry Growth
Several challenges can impede the growth of the Poly Aluminum Chloride (PAC) industry. Volatility in the prices of key raw materials, such as bauxite and hydrochloric acid, can significantly affect production costs and, consequently, profit margins. Intense market competition, both from established global players and a growing number of regional manufacturers, as well as the availability of alternative coagulants, can lead to price wars and reduced market share for individual companies. Furthermore, the complex and often disparate regulatory frameworks governing chemical usage and environmental standards across different countries can create hurdles for international market expansion and product standardization. Supply chain disruptions, whether due to geopolitical events or logistical bottlenecks, can also lead to product shortages and increased lead times, impacting customer satisfaction and sales.
Key Players Shaping the Poly Aluminum Chloride Industry Market
- Gulbrandsen
- USALCO LLC
- Feralco AB
- George S Coyne Chemical Co Inc
- Kanoria Chemicals & Industries Ltd
- Airedale Chemical
- Kemira
- GEO Specialty Chemicals Inc
- Summit Chemical Specialty Products LLC
- Synergy Multichem Pvt Ltd
- HOLLAND COMPANY
- Aditya Birla Chemicals (India) Limited
Significant Poly Aluminum Chloride Industry Industry Milestones
- 2019: Increased focus on sustainable production methods and the development of PAC with reduced environmental impact.
- 2020: Growing adoption of PAC in emerging economies driven by infrastructure development and stricter water quality standards.
- 2021: Heightened demand for PAC in industrial wastewater treatment due to increased manufacturing activity and environmental compliance.
- 2022: M&A activities aimed at expanding product portfolios and geographical reach become more prominent.
- 2023: Innovations in PAC formulations for specialized applications in the cosmetics and personal care industry gain traction.
- 2024: Continued investment in R&D for high-performance PAC grades with enhanced efficiency and cost-effectiveness.
Future Outlook for Poly Aluminum Chloride Industry Market
The future outlook for the Poly Aluminum Chloride (PAC) market remains exceptionally positive, driven by persistent global trends and emerging opportunities. The unabating demand for clean water, coupled with the imperative for efficient industrial wastewater management, will continue to be the primary growth catalyst. Significant investments in water infrastructure, particularly in developing regions, will further propel market expansion. Opportunities lie in the development of advanced PAC formulations with superior performance and environmental credentials, catering to evolving regulatory landscapes and consumer preferences. The growing use of PAC in non-traditional sectors, such as cosmetics and enhanced oil recovery, also presents promising avenues for market diversification. Strategic collaborations and technological advancements in production will be crucial for players seeking to capitalize on the robust growth trajectory projected for the PAC industry.
Poly Aluminum Chloride Industry Segmentation
-
1. Form
- 1.1. Solid
- 1.2. Liquid
-
2. End-user Industry
- 2.1. Water Treatment
- 2.2. Paper Industry
- 2.3. Cosmetics and Personal Care
- 2.4. Oil and Gas
- 2.5. Other End-user Industries
Poly Aluminum Chloride Industry Segmentation By Geography
-
1. Asia Pacific
- 1.1. China
- 1.2. India
- 1.3. Japan
- 1.4. South Korea
- 1.5. Rest of Asia Pacific
-
2. North America
- 2.1. United States
- 2.2. Canada
- 2.3. Mexico
-
3. Europe
- 3.1. Germany
- 3.2. United Kingdom
- 3.3. France
- 3.4. Italy
- 3.5. Rest of Europe
-
4. South America
- 4.1. Brazil
- 4.2. Argentina
- 4.3. Rest of South America
-
5. Middle East and Africa
- 5.1. Saudi Arabia
- 5.2. South Africa
- 5.3. Rest of Middle East and Africa
Poly Aluminum Chloride Industry Regional Market Share
Geographic Coverage of Poly Aluminum Chloride Industry
Poly Aluminum Chloride Industry REPORT HIGHLIGHTS
| Aspects | Details |
|---|---|
| Study Period | 2020-2034 |
| Base Year | 2025 |
| Estimated Year | 2026 |
| Forecast Period | 2026-2034 |
| Historical Period | 2020-2025 |
| Growth Rate | CAGR of 5.82% from 2020-2034 |
| Segmentation |
|
Table of Contents
- 1. Introduction
- 1.1. Research Scope
- 1.2. Market Segmentation
- 1.3. Research Objective
- 1.4. Definitions and Assumptions
- 2. Executive Summary
- 2.1. Market Snapshot
- 3. Market Dynamics
- 3.1. Market Drivers
- 3.2. Market Restrains
- 3.3. Market Trends
- 3.4. Market Opportunities
- 4. Market Factor Analysis
- 4.1. Porters Five Forces
- 4.1.1. Bargaining Power of Suppliers
- 4.1.2. Bargaining Power of Buyers
- 4.1.3. Threat of New Entrants
- 4.1.4. Threat of Substitutes
- 4.1.5. Competitive Rivalry
- 4.2. PESTEL analysis
- 4.3. BCG Analysis
- 4.3.1. Stars (High Growth, High Market Share)
- 4.3.2. Cash Cows (Low Growth, High Market Share)
- 4.3.3. Question Mark (High Growth, Low Market Share)
- 4.3.4. Dogs (Low Growth, Low Market Share)
- 4.4. Ansoff Matrix Analysis
- 4.5. Supply Chain Analysis
- 4.6. Regulatory Landscape
- 4.7. Current Market Potential and Opportunity Assessment (TAM–SAM–SOM Framework)
- 4.8. TIR Analyst Note
- 4.1. Porters Five Forces
- 5. Market Analysis, Insights and Forecast 2021-2033
- 5.1. Market Analysis, Insights and Forecast - by Form
- 5.1.1. Solid
- 5.1.2. Liquid
- 5.2. Market Analysis, Insights and Forecast - by End-user Industry
- 5.2.1. Water Treatment
- 5.2.2. Paper Industry
- 5.2.3. Cosmetics and Personal Care
- 5.2.4. Oil and Gas
- 5.2.5. Other End-user Industries
- 5.3. Market Analysis, Insights and Forecast - by Region
- 5.3.1. Asia Pacific
- 5.3.2. North America
- 5.3.3. Europe
- 5.3.4. South America
- 5.3.5. Middle East and Africa
- 5.1. Market Analysis, Insights and Forecast - by Form
- 6. Global Poly Aluminum Chloride Industry Analysis, Insights and Forecast, 2021-2033
- 6.1. Market Analysis, Insights and Forecast - by Form
- 6.1.1. Solid
- 6.1.2. Liquid
- 6.2. Market Analysis, Insights and Forecast - by End-user Industry
- 6.2.1. Water Treatment
- 6.2.2. Paper Industry
- 6.2.3. Cosmetics and Personal Care
- 6.2.4. Oil and Gas
- 6.2.5. Other End-user Industries
- 6.1. Market Analysis, Insights and Forecast - by Form
- 7. Asia Pacific Poly Aluminum Chloride Industry Analysis, Insights and Forecast, 2020-2032
- 7.1. Market Analysis, Insights and Forecast - by Form
- 7.1.1. Solid
- 7.1.2. Liquid
- 7.2. Market Analysis, Insights and Forecast - by End-user Industry
- 7.2.1. Water Treatment
- 7.2.2. Paper Industry
- 7.2.3. Cosmetics and Personal Care
- 7.2.4. Oil and Gas
- 7.2.5. Other End-user Industries
- 7.1. Market Analysis, Insights and Forecast - by Form
- 8. North America Poly Aluminum Chloride Industry Analysis, Insights and Forecast, 2020-2032
- 8.1. Market Analysis, Insights and Forecast - by Form
- 8.1.1. Solid
- 8.1.2. Liquid
- 8.2. Market Analysis, Insights and Forecast - by End-user Industry
- 8.2.1. Water Treatment
- 8.2.2. Paper Industry
- 8.2.3. Cosmetics and Personal Care
- 8.2.4. Oil and Gas
- 8.2.5. Other End-user Industries
- 8.1. Market Analysis, Insights and Forecast - by Form
- 9. Europe Poly Aluminum Chloride Industry Analysis, Insights and Forecast, 2020-2032
- 9.1. Market Analysis, Insights and Forecast - by Form
- 9.1.1. Solid
- 9.1.2. Liquid
- 9.2. Market Analysis, Insights and Forecast - by End-user Industry
- 9.2.1. Water Treatment
- 9.2.2. Paper Industry
- 9.2.3. Cosmetics and Personal Care
- 9.2.4. Oil and Gas
- 9.2.5. Other End-user Industries
- 9.1. Market Analysis, Insights and Forecast - by Form
- 10. South America Poly Aluminum Chloride Industry Analysis, Insights and Forecast, 2020-2032
- 10.1. Market Analysis, Insights and Forecast - by Form
- 10.1.1. Solid
- 10.1.2. Liquid
- 10.2. Market Analysis, Insights and Forecast - by End-user Industry
- 10.2.1. Water Treatment
- 10.2.2. Paper Industry
- 10.2.3. Cosmetics and Personal Care
- 10.2.4. Oil and Gas
- 10.2.5. Other End-user Industries
- 10.1. Market Analysis, Insights and Forecast - by Form
- 11. Middle East and Africa Poly Aluminum Chloride Industry Analysis, Insights and Forecast, 2020-2032
- 11.1. Market Analysis, Insights and Forecast - by Form
- 11.1.1. Solid
- 11.1.2. Liquid
- 11.2. Market Analysis, Insights and Forecast - by End-user Industry
- 11.2.1. Water Treatment
- 11.2.2. Paper Industry
- 11.2.3. Cosmetics and Personal Care
- 11.2.4. Oil and Gas
- 11.2.5. Other End-user Industries
- 11.1. Market Analysis, Insights and Forecast - by Form
- 12. Competitive Analysis
- 12.1. Company Profiles
- 12.1.1 Gulbrandsen
- 12.1.1.1. Company Overview
- 12.1.1.2. Products
- 12.1.1.3. Company Financials
- 12.1.1.4. SWOT Analysis
- 12.1.2 USALCO LLC*List Not Exhaustive
- 12.1.2.1. Company Overview
- 12.1.2.2. Products
- 12.1.2.3. Company Financials
- 12.1.2.4. SWOT Analysis
- 12.1.3 Feralco AB
- 12.1.3.1. Company Overview
- 12.1.3.2. Products
- 12.1.3.3. Company Financials
- 12.1.3.4. SWOT Analysis
- 12.1.4 George S Coyne Chemical Co Inc
- 12.1.4.1. Company Overview
- 12.1.4.2. Products
- 12.1.4.3. Company Financials
- 12.1.4.4. SWOT Analysis
- 12.1.5 Kanoria Chemicals & Industries Ltd
- 12.1.5.1. Company Overview
- 12.1.5.2. Products
- 12.1.5.3. Company Financials
- 12.1.5.4. SWOT Analysis
- 12.1.6 Airedale Chemical
- 12.1.6.1. Company Overview
- 12.1.6.2. Products
- 12.1.6.3. Company Financials
- 12.1.6.4. SWOT Analysis
- 12.1.7 Kemira
- 12.1.7.1. Company Overview
- 12.1.7.2. Products
- 12.1.7.3. Company Financials
- 12.1.7.4. SWOT Analysis
- 12.1.8 GEO Specialty Chemicals Inc
- 12.1.8.1. Company Overview
- 12.1.8.2. Products
- 12.1.8.3. Company Financials
- 12.1.8.4. SWOT Analysis
- 12.1.9 Summit Chemical Specialty Products LLC
- 12.1.9.1. Company Overview
- 12.1.9.2. Products
- 12.1.9.3. Company Financials
- 12.1.9.4. SWOT Analysis
- 12.1.10 Synergy Multichem Pvt Ltd
- 12.1.10.1. Company Overview
- 12.1.10.2. Products
- 12.1.10.3. Company Financials
- 12.1.10.4. SWOT Analysis
- 12.1.11 HOLLAND COMPANY
- 12.1.11.1. Company Overview
- 12.1.11.2. Products
- 12.1.11.3. Company Financials
- 12.1.11.4. SWOT Analysis
- 12.1.12 Aditya Birla Chemicals (India) Limited
- 12.1.12.1. Company Overview
- 12.1.12.2. Products
- 12.1.12.3. Company Financials
- 12.1.12.4. SWOT Analysis
- 12.1.1 Gulbrandsen
- 12.2. Market Entropy
- 12.2.1 Company's Key Areas Served
- 12.2.2 Recent Developments
- 12.3. Company Market Share Analysis 2025
- 12.3.1 Top 5 Companies Market Share Analysis
- 12.3.2 Top 3 Companies Market Share Analysis
- 12.4. List of Potential Customers
- 13. Research Methodology
List of Figures
- Figure 1: Global Poly Aluminum Chloride Industry Revenue Breakdown (million, %) by Region 2025 & 2033
- Figure 2: Asia Pacific Poly Aluminum Chloride Industry Revenue (million), by Form 2025 & 2033
- Figure 3: Asia Pacific Poly Aluminum Chloride Industry Revenue Share (%), by Form 2025 & 2033
- Figure 4: Asia Pacific Poly Aluminum Chloride Industry Revenue (million), by End-user Industry 2025 & 2033
- Figure 5: Asia Pacific Poly Aluminum Chloride Industry Revenue Share (%), by End-user Industry 2025 & 2033
- Figure 6: Asia Pacific Poly Aluminum Chloride Industry Revenue (million), by Country 2025 & 2033
- Figure 7: Asia Pacific Poly Aluminum Chloride Industry Revenue Share (%), by Country 2025 & 2033
- Figure 8: North America Poly Aluminum Chloride Industry Revenue (million), by Form 2025 & 2033
- Figure 9: North America Poly Aluminum Chloride Industry Revenue Share (%), by Form 2025 & 2033
- Figure 10: North America Poly Aluminum Chloride Industry Revenue (million), by End-user Industry 2025 & 2033
- Figure 11: North America Poly Aluminum Chloride Industry Revenue Share (%), by End-user Industry 2025 & 2033
- Figure 12: North America Poly Aluminum Chloride Industry Revenue (million), by Country 2025 & 2033
- Figure 13: North America Poly Aluminum Chloride Industry Revenue Share (%), by Country 2025 & 2033
- Figure 14: Europe Poly Aluminum Chloride Industry Revenue (million), by Form 2025 & 2033
- Figure 15: Europe Poly Aluminum Chloride Industry Revenue Share (%), by Form 2025 & 2033
- Figure 16: Europe Poly Aluminum Chloride Industry Revenue (million), by End-user Industry 2025 & 2033
- Figure 17: Europe Poly Aluminum Chloride Industry Revenue Share (%), by End-user Industry 2025 & 2033
- Figure 18: Europe Poly Aluminum Chloride Industry Revenue (million), by Country 2025 & 2033
- Figure 19: Europe Poly Aluminum Chloride Industry Revenue Share (%), by Country 2025 & 2033
- Figure 20: South America Poly Aluminum Chloride Industry Revenue (million), by Form 2025 & 2033
- Figure 21: South America Poly Aluminum Chloride Industry Revenue Share (%), by Form 2025 & 2033
- Figure 22: South America Poly Aluminum Chloride Industry Revenue (million), by End-user Industry 2025 & 2033
- Figure 23: South America Poly Aluminum Chloride Industry Revenue Share (%), by End-user Industry 2025 & 2033
- Figure 24: South America Poly Aluminum Chloride Industry Revenue (million), by Country 2025 & 2033
- Figure 25: South America Poly Aluminum Chloride Industry Revenue Share (%), by Country 2025 & 2033
- Figure 26: Middle East and Africa Poly Aluminum Chloride Industry Revenue (million), by Form 2025 & 2033
- Figure 27: Middle East and Africa Poly Aluminum Chloride Industry Revenue Share (%), by Form 2025 & 2033
- Figure 28: Middle East and Africa Poly Aluminum Chloride Industry Revenue (million), by End-user Industry 2025 & 2033
- Figure 29: Middle East and Africa Poly Aluminum Chloride Industry Revenue Share (%), by End-user Industry 2025 & 2033
- Figure 30: Middle East and Africa Poly Aluminum Chloride Industry Revenue (million), by Country 2025 & 2033
- Figure 31: Middle East and Africa Poly Aluminum Chloride Industry Revenue Share (%), by Country 2025 & 2033
List of Tables
- Table 1: Global Poly Aluminum Chloride Industry Revenue million Forecast, by Form 2020 & 2033
- Table 2: Global Poly Aluminum Chloride Industry Revenue million Forecast, by End-user Industry 2020 & 2033
- Table 3: Global Poly Aluminum Chloride Industry Revenue million Forecast, by Region 2020 & 2033
- Table 4: Global Poly Aluminum Chloride Industry Revenue million Forecast, by Form 2020 & 2033
- Table 5: Global Poly Aluminum Chloride Industry Revenue million Forecast, by End-user Industry 2020 & 2033
- Table 6: Global Poly Aluminum Chloride Industry Revenue million Forecast, by Country 2020 & 2033
- Table 7: China Poly Aluminum Chloride Industry Revenue (million) Forecast, by Application 2020 & 2033
- Table 8: India Poly Aluminum Chloride Industry Revenue (million) Forecast, by Application 2020 & 2033
- Table 9: Japan Poly Aluminum Chloride Industry Revenue (million) Forecast, by Application 2020 & 2033
- Table 10: South Korea Poly Aluminum Chloride Industry Revenue (million) Forecast, by Application 2020 & 2033
- Table 11: Rest of Asia Pacific Poly Aluminum Chloride Industry Revenue (million) Forecast, by Application 2020 & 2033
- Table 12: Global Poly Aluminum Chloride Industry Revenue million Forecast, by Form 2020 & 2033
- Table 13: Global Poly Aluminum Chloride Industry Revenue million Forecast, by End-user Industry 2020 & 2033
- Table 14: Global Poly Aluminum Chloride Industry Revenue million Forecast, by Country 2020 & 2033
- Table 15: United States Poly Aluminum Chloride Industry Revenue (million) Forecast, by Application 2020 & 2033
- Table 16: Canada Poly Aluminum Chloride Industry Revenue (million) Forecast, by Application 2020 & 2033
- Table 17: Mexico Poly Aluminum Chloride Industry Revenue (million) Forecast, by Application 2020 & 2033
- Table 18: Global Poly Aluminum Chloride Industry Revenue million Forecast, by Form 2020 & 2033
- Table 19: Global Poly Aluminum Chloride Industry Revenue million Forecast, by End-user Industry 2020 & 2033
- Table 20: Global Poly Aluminum Chloride Industry Revenue million Forecast, by Country 2020 & 2033
- Table 21: Germany Poly Aluminum Chloride Industry Revenue (million) Forecast, by Application 2020 & 2033
- Table 22: United Kingdom Poly Aluminum Chloride Industry Revenue (million) Forecast, by Application 2020 & 2033
- Table 23: France Poly Aluminum Chloride Industry Revenue (million) Forecast, by Application 2020 & 2033
- Table 24: Italy Poly Aluminum Chloride Industry Revenue (million) Forecast, by Application 2020 & 2033
- Table 25: Rest of Europe Poly Aluminum Chloride Industry Revenue (million) Forecast, by Application 2020 & 2033
- Table 26: Global Poly Aluminum Chloride Industry Revenue million Forecast, by Form 2020 & 2033
- Table 27: Global Poly Aluminum Chloride Industry Revenue million Forecast, by End-user Industry 2020 & 2033
- Table 28: Global Poly Aluminum Chloride Industry Revenue million Forecast, by Country 2020 & 2033
- Table 29: Brazil Poly Aluminum Chloride Industry Revenue (million) Forecast, by Application 2020 & 2033
- Table 30: Argentina Poly Aluminum Chloride Industry Revenue (million) Forecast, by Application 2020 & 2033
- Table 31: Rest of South America Poly Aluminum Chloride Industry Revenue (million) Forecast, by Application 2020 & 2033
- Table 32: Global Poly Aluminum Chloride Industry Revenue million Forecast, by Form 2020 & 2033
- Table 33: Global Poly Aluminum Chloride Industry Revenue million Forecast, by End-user Industry 2020 & 2033
- Table 34: Global Poly Aluminum Chloride Industry Revenue million Forecast, by Country 2020 & 2033
- Table 35: Saudi Arabia Poly Aluminum Chloride Industry Revenue (million) Forecast, by Application 2020 & 2033
- Table 36: South Africa Poly Aluminum Chloride Industry Revenue (million) Forecast, by Application 2020 & 2033
- Table 37: Rest of Middle East and Africa Poly Aluminum Chloride Industry Revenue (million) Forecast, by Application 2020 & 2033
Frequently Asked Questions
1. What is the projected Compound Annual Growth Rate (CAGR) of the Poly Aluminum Chloride Industry?
The projected CAGR is approximately 5.82%.
2. Which companies are prominent players in the Poly Aluminum Chloride Industry?
Key companies in the market include Gulbrandsen, USALCO LLC*List Not Exhaustive, Feralco AB, George S Coyne Chemical Co Inc, Kanoria Chemicals & Industries Ltd, Airedale Chemical, Kemira, GEO Specialty Chemicals Inc, Summit Chemical Specialty Products LLC, Synergy Multichem Pvt Ltd, HOLLAND COMPANY, Aditya Birla Chemicals (India) Limited.
3. What are the main segments of the Poly Aluminum Chloride Industry?
The market segments include Form, End-user Industry.
4. Can you provide details about the market size?
The market size is estimated to be USD 1942 million as of 2022.
5. What are some drivers contributing to market growth?
; Increasing Demand from Large-scale Water Treatment Industries; Increasing Demand in Paper and Pulp Industry.
6. What are the notable trends driving market growth?
Large Scale Water Treatment to Boost Poly Aluminum Chloride Market.
7. Are there any restraints impacting market growth?
; Unfavorable Conditions Arising Due to COVID-19; Other Restraints.
8. Can you provide examples of recent developments in the market?
N/A
9. What pricing options are available for accessing the report?
Pricing options include single-user, multi-user, and enterprise licenses priced at USD 4750, USD 5250, and USD 8750 respectively.
10. Is the market size provided in terms of value or volume?
The market size is provided in terms of value, measured in million.
11. Are there any specific market keywords associated with the report?
Yes, the market keyword associated with the report is "Poly Aluminum Chloride Industry," which aids in identifying and referencing the specific market segment covered.
12. How do I determine which pricing option suits my needs best?
The pricing options vary based on user requirements and access needs. Individual users may opt for single-user licenses, while businesses requiring broader access may choose multi-user or enterprise licenses for cost-effective access to the report.
13. Are there any additional resources or data provided in the Poly Aluminum Chloride Industry report?
While the report offers comprehensive insights, it's advisable to review the specific contents or supplementary materials provided to ascertain if additional resources or data are available.
14. How can I stay updated on further developments or reports in the Poly Aluminum Chloride Industry?
To stay informed about further developments, trends, and reports in the Poly Aluminum Chloride Industry, consider subscribing to industry newsletters, following relevant companies and organizations, or regularly checking reputable industry news sources and publications.
Methodology
Step 1 - Identification of Relevant Samples Size from Population Database


Step 2 - Approaches for Defining Global Market Size (Value, Volume* & Price*)

Note*: In applicable scenarios
Step 3 - Data Sources
Primary Research
- Web Analytics
- Survey Reports
- Research Institute
- Latest Research Reports
- Opinion Leaders
Secondary Research
- Annual Reports
- White Paper
- Latest Press Release
- Industry Association
- Paid Database
- Investor Presentations

Step 4 - Data Triangulation
Involves using different sources of information in order to increase the validity of a study
These sources are likely to be stakeholders in a program - participants, other researchers, program staff, other community members, and so on.
Then we put all data in single framework & apply various statistical tools to find out the dynamic on the market.
During the analysis stage, feedback from the stakeholder groups would be compared to determine areas of agreement as well as areas of divergence