

Key Insights
The global Graphene Nanocomposites Market is poised for explosive growth, projected to reach an impressive market size of approximately USD 1,800 million by 2025, with a Compound Annual Growth Rate (CAGR) exceeding 30.00% through 2033. This rapid expansion is fueled by the exceptional properties of graphene, including its superior strength, conductivity, and thermal performance, making it an ideal additive for a wide array of materials. Key drivers for this surge include the increasing demand for lightweight and durable materials in the automotive and aerospace sectors, driven by a global push for fuel efficiency and enhanced performance. Furthermore, the burgeoning electronics industry is leveraging graphene nanocomposites for next-generation semiconductors, flexible displays, and high-performance batteries, where their electrical and thermal conductivity are paramount. The medical field is also a significant contributor, exploring graphene for advanced drug delivery systems, biosensors, and biocompatible implants, owing to its unique surface chemistry and low toxicity. The building and construction sector is beginning to adopt these advanced materials for enhanced concrete strength, fire resistance, and insulation properties, while the packaging industry is seeing its application in creating barrier films and smart packaging solutions.
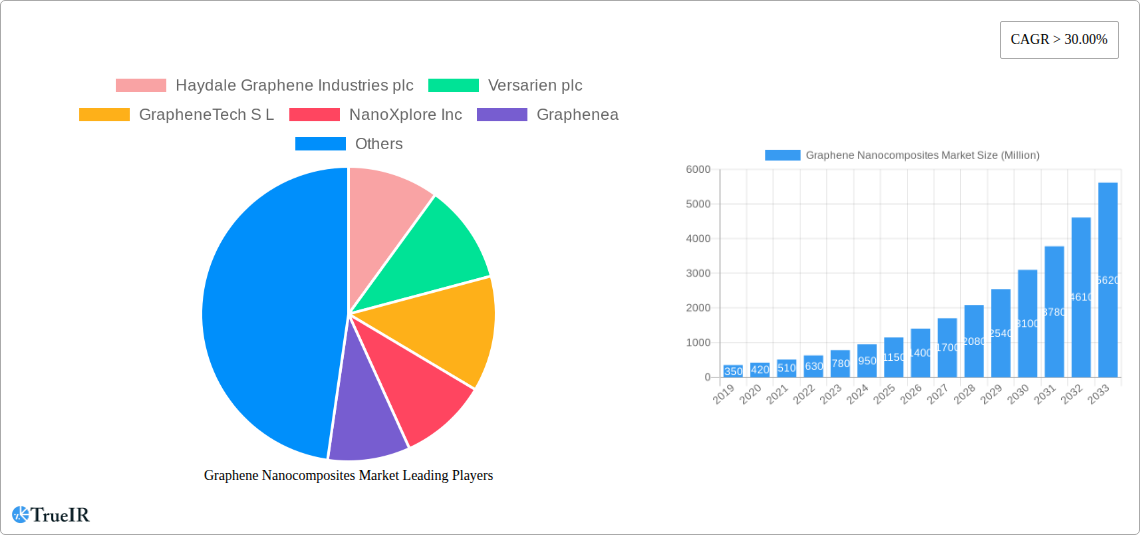
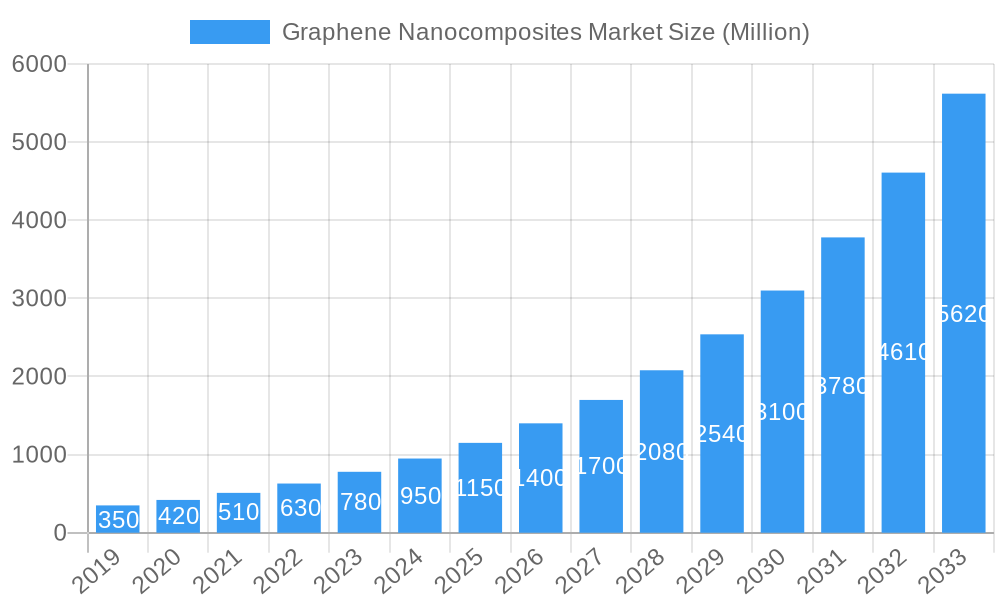
Graphene Nanocomposites Market Market Size (In Million)
The market segmentation highlights the dominance of Graphene Oxide (GO) and Graphene Nano Platelets (GNP) as the primary types of graphene nanocomposites, owing to their widespread availability and established manufacturing processes. The Electrical and Electronics segment is expected to lead the end-user industry, driven by the relentless innovation in consumer electronics and the demand for advanced materials in electric vehicles and renewable energy storage. While the market offers substantial opportunities, certain restraints exist, including the high cost of graphene production and the need for standardization in manufacturing processes and quality control. However, ongoing research and development efforts, coupled with increasing investments in graphene technology, are steadily addressing these challenges. Geographically, the Asia Pacific region, particularly China and Japan, is anticipated to be a dominant force due to its strong manufacturing base and significant investments in advanced materials research. North America and Europe are also showing robust growth, driven by technological advancements and a strong focus on sustainable and high-performance applications. Companies such as Haydale Graphene Industries plc, Versarien plc, and NanoXplore Inc. are at the forefront of this innovation, driving market penetration and product development.
Graphene Nanocomposites Market Company Market Share
Here is a dynamic, SEO-optimized report description for the Graphene Nanocomposites Market, incorporating your specified details and structure.
Graphene Nanocomposites Market: Advanced Materials for a High-Performance Future (2019-2033)
Introduction
This comprehensive report delves into the burgeoning Graphene Nanocomposites Market, offering in-depth analysis and strategic insights for stakeholders. Examining the period from 2019 to 2033, with a base and estimated year of 2025, this report provides a meticulous forecast for the next decade. We explore the technological advancements, key players, and emerging opportunities driving the adoption of graphene in composite materials across diverse industries. With a focus on high-volume SEO keywords, this report aims to be the definitive resource for understanding the global market dynamics of graphene nanocomposites.
Graphene Nanocomposites Market Market Structure & Competitive Landscape
The Graphene Nanocomposites Market is characterized by a dynamic and evolving competitive landscape, with a moderate level of market concentration. Innovation remains a key driver, fueled by ongoing research and development in graphene production and functionalization techniques. Regulatory impacts, while nascent, are beginning to shape market entry and product approvals, particularly in sectors like medical devices and consumer goods. Product substitutes, such as carbon nanotubes and other advanced fillers, present a competitive challenge, though graphene's unique properties often offer superior performance advantages. End-user segmentation highlights the critical role of the Electrical and Electronics, Automotive and Aerospace, and Medical industries in driving demand. Mergers and acquisitions are anticipated to play a significant role in consolidating the market, with early-stage investments and strategic partnerships becoming more prevalent. The market is expected to witness approximately 5-8 significant M&A activities and strategic alliances in the next three years, signaling a trend towards consolidation and vertical integration.
Graphene Nanocomposites Market Market Trends & Opportunities
The global Graphene Nanocomposites Market is poised for substantial growth, driven by the unique and superior properties of graphene, including exceptional electrical conductivity, thermal conductivity, mechanical strength, and barrier properties. This market is projected to witness a Compound Annual Growth Rate (CAGR) of approximately 25-30% over the forecast period (2025-2033), reaching an estimated market size of over $5,000 Million by 2033. Technological shifts are central to this expansion, with advancements in scalable and cost-effective graphene production methods like Chemical Vapor Deposition (CVD) and exfoliation techniques continually improving the accessibility and application potential of graphene. Consumer preferences are increasingly leaning towards lighter, stronger, and more energy-efficient products, directly benefiting the adoption of graphene nanocomposites in sectors such as automotive (lightweighting for fuel efficiency), aerospace (enhanced structural integrity), and electronics (improved conductivity for advanced devices). Competitive dynamics are intensifying as established material manufacturers and emerging graphene specialists vie for market share through product innovation and strategic collaborations. Opportunities abound in developing novel applications that leverage graphene's multifaceted capabilities, from advanced battery technologies and conductive inks to smart textiles and biocompatible medical implants. The market penetration rate for graphene nanocomposites is still relatively low, indicating significant untapped potential for widespread adoption.
Dominant Markets & Segments in Graphene Nanocomposites Market
The Electrical and Electronics end-user industry is currently the dominant market segment for graphene nanocomposites, driven by the insatiable demand for advanced materials in high-performance electronic devices. This segment is expected to maintain its leadership position throughout the forecast period. Key growth drivers include the need for enhanced conductivity in next-generation semiconductors, flexible displays, advanced sensors, and efficient energy storage solutions like supercapacitors and batteries. The Automotive and Aerospace industries represent another significant and rapidly growing segment. Here, graphene nanocomposites are crucial for lightweighting vehicles and aircraft, leading to improved fuel efficiency and reduced emissions. Furthermore, their superior mechanical strength and thermal management capabilities are vital for structural components and advanced battery systems in electric vehicles.
- Dominant Region: Asia-Pacific is projected to be the leading region in the Graphene Nanocomposites Market. This dominance is attributed to the robust manufacturing base in countries like China, South Korea, and Japan, coupled with substantial investments in research and development of advanced materials and electronics. Government initiatives promoting technological innovation and the presence of a large consumer base further fuel this growth.
- Leading Segment (Type): Graphene Nano Platelets (GNP) is currently the most widely adopted type of graphene in nanocomposites. GNPs offer a favorable balance of performance and cost-effectiveness for a broad range of applications, including conductive coatings, polymers, and composites. Graphene Oxide (GO) is gaining traction, particularly in applications requiring specific surface chemistry and dispersion properties, such as in biomedical applications and water purification.
- Key Growth Drivers for Dominant Segments:
- Electrical and Electronics: Miniaturization of devices, demand for faster processing speeds, and the development of wearable technology.
- Automotive and Aerospace: Stringent fuel efficiency regulations, the rapid expansion of the electric vehicle market, and the demand for lighter, more durable aircraft components.
- Medical: Advancements in biocompatible implants, drug delivery systems, and diagnostic tools.
Graphene Nanocomposites Market Product Analysis
Graphene nanocomposites represent a leap forward in material science, combining the exceptional properties of graphene with traditional matrices like polymers, ceramics, and metals. Product innovations are focused on enhancing the performance characteristics of these composites, leading to materials that are significantly stronger, lighter, more conductive, and more durable than their conventional counterparts. Applications are diverse, ranging from advanced coatings and structural components to functional textiles and energy storage solutions. Competitive advantages stem from graphene's ability to impart properties that are often unattainable with other fillers, offering tailored solutions for demanding applications and opening new avenues for product development.
Key Drivers, Barriers & Challenges in Graphene Nanocomposites Market
Key Drivers:
- Technological Advancements: Breakthroughs in graphene synthesis and functionalization are making it more accessible and cost-effective for industrial applications.
- Demand for High-Performance Materials: Industries like automotive, aerospace, and electronics are increasingly seeking materials with superior strength-to-weight ratios, conductivity, and durability.
- Energy Efficiency and Sustainability: Graphene's role in lightweighting and improving energy storage contributes to sustainability goals.
- Government Initiatives and Funding: Increased support for R&D and commercialization of nanomaterials.
Barriers & Challenges:
- Production Cost: While decreasing, the cost of high-quality graphene remains a significant barrier for mass adoption in certain applications.
- Scalability of Production: Ensuring consistent quality and high-volume production of functionalized graphene remains a challenge.
- Dispersion Issues: Achieving uniform dispersion of graphene within composite matrices can be complex and impacts performance.
- Regulatory Hurdles: Evolving safety regulations and standardization for nanomaterials can slow down market entry.
- Lack of Standardized Testing and Characterization: This can lead to inconsistencies in performance evaluation and adoption.
Growth Drivers in the Graphene Nanocomposites Market Market
The graphene nanocomposites market is propelled by several key growth drivers. Technologically, advancements in graphene synthesis and functionalization are making it more economical and accessible for a wider range of applications. The increasing demand for lightweight, high-strength materials in the automotive and aerospace sectors, driven by fuel efficiency and performance requirements, is a significant catalyst. Furthermore, the burgeoning electric vehicle market necessitates advanced battery materials where graphene plays a crucial role in enhancing capacity and charging speeds. In the electronics sector, graphene's exceptional conductivity is vital for next-generation flexible displays, high-speed circuitry, and advanced sensors. Regulatory bodies are also increasingly recognizing the potential of nanomaterials, leading to more supportive policies and funding for research and development, further accelerating market growth.
Challenges Impacting Graphene Nanocomposites Market Growth
Despite its immense potential, the graphene nanocomposites market faces several significant challenges. The high cost of producing high-quality graphene, although gradually declining, remains a primary barrier for widespread adoption, particularly in cost-sensitive industries. Ensuring consistent scalability and quality control in graphene production is an ongoing technical hurdle. Effectively dispersing graphene uniformly within composite matrices is critical for realizing its full performance benefits, and achieving this can be complex, leading to performance variability. Furthermore, the evolving landscape of nanomaterial regulations, including safety assessments and standardization, can create complexities and delays in product commercialization. Competitive pressures from other advanced materials also require continuous innovation and demonstrable advantages for graphene-based solutions.
Key Players Shaping the Graphene Nanocomposites Market Market
- Haydale Graphene Industries plc.
- Versarien plc
- GrapheneTech S L
- NanoXplore Inc
- Graphenea
- Applied Graphene Materials
- XG Sciences
- Directa Plus S p A
- Abalonyx AS
- Aztrong
Significant Graphene Nanocomposites Market Industry Milestones
- January 2022: Haydale Graphene Industries plc. announced the incorporation of graphene nano-platelets (GNPs) in its cosmetic face mask sheets and PPE face masks, marking a significant step into the consumer goods market. Additionally, iCraft is leveraging Haydale's functionalized GNPs in its graphene-coated fabric, THERMiT., showcasing diverse application potential.
- March 2021: Haydale Graphene Industries plc. was awarded a GBP 1.1 million loan facility by Innovate UK Loans Limited. This funding supports Haydale's strategic expansion of its capacity to manufacture functionalized nanomaterials, including graphene, with a target output exceeding 30 tons per annum, indicating a significant scaling up of production capabilities.
Future Outlook for Graphene Nanocomposites Market Market
The future outlook for the Graphene Nanocomposites Market is exceptionally bright, driven by continuous innovation and increasing demand across a multitude of high-growth sectors. Strategic opportunities lie in the development of advanced composite materials for renewable energy applications, such as next-generation solar cells and more efficient battery technologies. The growing trend towards smart textiles and wearable electronics presents a significant avenue for market expansion, leveraging graphene's conductivity and flexibility. Furthermore, advancements in healthcare, including biocompatible materials for implants and targeted drug delivery systems, are poised to become major growth catalysts. As production costs continue to decrease and manufacturing processes become more refined, the market penetration of graphene nanocomposites is expected to accelerate, establishing them as a cornerstone material for future technological advancements.
Graphene Nanocomposites Market Segmentation
-
1. Type
- 1.1. Graphene Oxide (GO)
- 1.2. Graphene Nano Platelets (GNP)
- 1.3. Other Types
-
2. End-user Industry
- 2.1. Electrical and Electronics
- 2.2. Medical
- 2.3. Automotive and Aerospace
- 2.4. Building and Construction
- 2.5. Packaging
- 2.6. Other End-user Industries
Graphene Nanocomposites Market Segmentation By Geography
-
1. Asia Pacific
- 1.1. China
- 1.2. India
- 1.3. Japan
- 1.4. South Korea
- 1.5. Rest of Asia Pacific
-
2. North America
- 2.1. United States
- 2.2. Canada
- 2.3. Mexico
-
3. Europe
- 3.1. Germany
- 3.2. United Kingdom
- 3.3. Italy
- 3.4. France
- 3.5. Rest of Europe
-
4. South America
- 4.1. Brazil
- 4.2. Argentina
- 4.3. Rest of South America
-
5. Middle East and Africa
- 5.1. Saudi Arabia
- 5.2. South Africa
- 5.3. Rest of Middle East and Africa
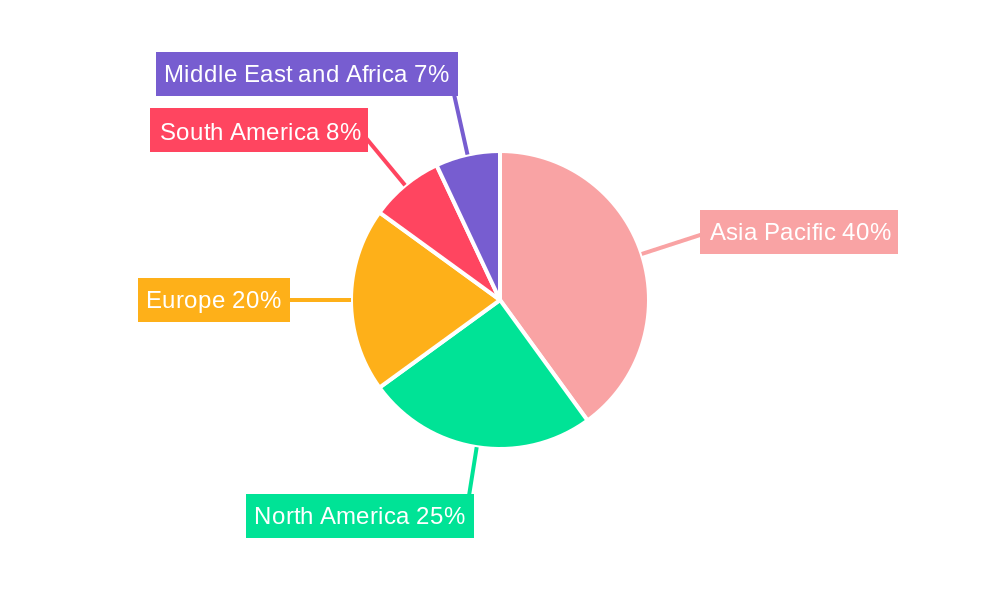
Graphene Nanocomposites Market Regional Market Share
Geographic Coverage of Graphene Nanocomposites Market
Graphene Nanocomposites Market REPORT HIGHLIGHTS
| Aspects | Details |
|---|---|
| Study Period | 2020-2034 |
| Base Year | 2025 |
| Estimated Year | 2026 |
| Forecast Period | 2026-2034 |
| Historical Period | 2020-2025 |
| Growth Rate | CAGR of 25.4% from 2020-2034 |
| Segmentation |
|
Table of Contents
- 1. Introduction
- 1.1. Research Scope
- 1.2. Market Segmentation
- 1.3. Research Objective
- 1.4. Definitions and Assumptions
- 2. Executive Summary
- 2.1. Market Snapshot
- 3. Market Dynamics
- 3.1. Market Drivers
- 3.2. Market Restrains
- 3.3. Market Trends
- 3.4. Market Opportunities
- 4. Market Factor Analysis
- 4.1. Porters Five Forces
- 4.1.1. Bargaining Power of Suppliers
- 4.1.2. Bargaining Power of Buyers
- 4.1.3. Threat of New Entrants
- 4.1.4. Threat of Substitutes
- 4.1.5. Competitive Rivalry
- 4.2. PESTEL analysis
- 4.3. BCG Analysis
- 4.3.1. Stars (High Growth, High Market Share)
- 4.3.2. Cash Cows (Low Growth, High Market Share)
- 4.3.3. Question Mark (High Growth, Low Market Share)
- 4.3.4. Dogs (Low Growth, Low Market Share)
- 4.4. Ansoff Matrix Analysis
- 4.5. Supply Chain Analysis
- 4.6. Regulatory Landscape
- 4.7. Current Market Potential and Opportunity Assessment (TAM–SAM–SOM Framework)
- 4.8. TIR Analyst Note
- 4.1. Porters Five Forces
- 5. Market Analysis, Insights and Forecast 2021-2033
- 5.1. Market Analysis, Insights and Forecast - by Type
- 5.1.1. Graphene Oxide (GO)
- 5.1.2. Graphene Nano Platelets (GNP)
- 5.1.3. Other Types
- 5.2. Market Analysis, Insights and Forecast - by End-user Industry
- 5.2.1. Electrical and Electronics
- 5.2.2. Medical
- 5.2.3. Automotive and Aerospace
- 5.2.4. Building and Construction
- 5.2.5. Packaging
- 5.2.6. Other End-user Industries
- 5.3. Market Analysis, Insights and Forecast - by Region
- 5.3.1. Asia Pacific
- 5.3.2. North America
- 5.3.3. Europe
- 5.3.4. South America
- 5.3.5. Middle East and Africa
- 5.1. Market Analysis, Insights and Forecast - by Type
- 6. Global Graphene Nanocomposites Market Analysis, Insights and Forecast, 2021-2033
- 6.1. Market Analysis, Insights and Forecast - by Type
- 6.1.1. Graphene Oxide (GO)
- 6.1.2. Graphene Nano Platelets (GNP)
- 6.1.3. Other Types
- 6.2. Market Analysis, Insights and Forecast - by End-user Industry
- 6.2.1. Electrical and Electronics
- 6.2.2. Medical
- 6.2.3. Automotive and Aerospace
- 6.2.4. Building and Construction
- 6.2.5. Packaging
- 6.2.6. Other End-user Industries
- 6.1. Market Analysis, Insights and Forecast - by Type
- 7. Asia Pacific Graphene Nanocomposites Market Analysis, Insights and Forecast, 2020-2032
- 7.1. Market Analysis, Insights and Forecast - by Type
- 7.1.1. Graphene Oxide (GO)
- 7.1.2. Graphene Nano Platelets (GNP)
- 7.1.3. Other Types
- 7.2. Market Analysis, Insights and Forecast - by End-user Industry
- 7.2.1. Electrical and Electronics
- 7.2.2. Medical
- 7.2.3. Automotive and Aerospace
- 7.2.4. Building and Construction
- 7.2.5. Packaging
- 7.2.6. Other End-user Industries
- 7.1. Market Analysis, Insights and Forecast - by Type
- 8. North America Graphene Nanocomposites Market Analysis, Insights and Forecast, 2020-2032
- 8.1. Market Analysis, Insights and Forecast - by Type
- 8.1.1. Graphene Oxide (GO)
- 8.1.2. Graphene Nano Platelets (GNP)
- 8.1.3. Other Types
- 8.2. Market Analysis, Insights and Forecast - by End-user Industry
- 8.2.1. Electrical and Electronics
- 8.2.2. Medical
- 8.2.3. Automotive and Aerospace
- 8.2.4. Building and Construction
- 8.2.5. Packaging
- 8.2.6. Other End-user Industries
- 8.1. Market Analysis, Insights and Forecast - by Type
- 9. Europe Graphene Nanocomposites Market Analysis, Insights and Forecast, 2020-2032
- 9.1. Market Analysis, Insights and Forecast - by Type
- 9.1.1. Graphene Oxide (GO)
- 9.1.2. Graphene Nano Platelets (GNP)
- 9.1.3. Other Types
- 9.2. Market Analysis, Insights and Forecast - by End-user Industry
- 9.2.1. Electrical and Electronics
- 9.2.2. Medical
- 9.2.3. Automotive and Aerospace
- 9.2.4. Building and Construction
- 9.2.5. Packaging
- 9.2.6. Other End-user Industries
- 9.1. Market Analysis, Insights and Forecast - by Type
- 10. South America Graphene Nanocomposites Market Analysis, Insights and Forecast, 2020-2032
- 10.1. Market Analysis, Insights and Forecast - by Type
- 10.1.1. Graphene Oxide (GO)
- 10.1.2. Graphene Nano Platelets (GNP)
- 10.1.3. Other Types
- 10.2. Market Analysis, Insights and Forecast - by End-user Industry
- 10.2.1. Electrical and Electronics
- 10.2.2. Medical
- 10.2.3. Automotive and Aerospace
- 10.2.4. Building and Construction
- 10.2.5. Packaging
- 10.2.6. Other End-user Industries
- 10.1. Market Analysis, Insights and Forecast - by Type
- 11. Middle East and Africa Graphene Nanocomposites Market Analysis, Insights and Forecast, 2020-2032
- 11.1. Market Analysis, Insights and Forecast - by Type
- 11.1.1. Graphene Oxide (GO)
- 11.1.2. Graphene Nano Platelets (GNP)
- 11.1.3. Other Types
- 11.2. Market Analysis, Insights and Forecast - by End-user Industry
- 11.2.1. Electrical and Electronics
- 11.2.2. Medical
- 11.2.3. Automotive and Aerospace
- 11.2.4. Building and Construction
- 11.2.5. Packaging
- 11.2.6. Other End-user Industries
- 11.1. Market Analysis, Insights and Forecast - by Type
- 12. Competitive Analysis
- 12.1. Company Profiles
- 12.1.1 Haydale Graphene Industries plc
- 12.1.1.1. Company Overview
- 12.1.1.2. Products
- 12.1.1.3. Company Financials
- 12.1.1.4. SWOT Analysis
- 12.1.2 Versarien plc
- 12.1.2.1. Company Overview
- 12.1.2.2. Products
- 12.1.2.3. Company Financials
- 12.1.2.4. SWOT Analysis
- 12.1.3 GrapheneTech S L
- 12.1.3.1. Company Overview
- 12.1.3.2. Products
- 12.1.3.3. Company Financials
- 12.1.3.4. SWOT Analysis
- 12.1.4 NanoXplore Inc
- 12.1.4.1. Company Overview
- 12.1.4.2. Products
- 12.1.4.3. Company Financials
- 12.1.4.4. SWOT Analysis
- 12.1.5 Graphenea
- 12.1.5.1. Company Overview
- 12.1.5.2. Products
- 12.1.5.3. Company Financials
- 12.1.5.4. SWOT Analysis
- 12.1.6 Applied Graphene Materials
- 12.1.6.1. Company Overview
- 12.1.6.2. Products
- 12.1.6.3. Company Financials
- 12.1.6.4. SWOT Analysis
- 12.1.7 XG Sciences
- 12.1.7.1. Company Overview
- 12.1.7.2. Products
- 12.1.7.3. Company Financials
- 12.1.7.4. SWOT Analysis
- 12.1.8 Directa Plus S p A
- 12.1.8.1. Company Overview
- 12.1.8.2. Products
- 12.1.8.3. Company Financials
- 12.1.8.4. SWOT Analysis
- 12.1.9 Abalonyx AS
- 12.1.9.1. Company Overview
- 12.1.9.2. Products
- 12.1.9.3. Company Financials
- 12.1.9.4. SWOT Analysis
- 12.1.10 Aztrong*List Not Exhaustive
- 12.1.10.1. Company Overview
- 12.1.10.2. Products
- 12.1.10.3. Company Financials
- 12.1.10.4. SWOT Analysis
- 12.1.1 Haydale Graphene Industries plc
- 12.2. Market Entropy
- 12.2.1 Company's Key Areas Served
- 12.2.2 Recent Developments
- 12.3. Company Market Share Analysis 2025
- 12.3.1 Top 5 Companies Market Share Analysis
- 12.3.2 Top 3 Companies Market Share Analysis
- 12.4. List of Potential Customers
- 13. Research Methodology
List of Figures
- Figure 1: Global Graphene Nanocomposites Market Revenue Breakdown (million, %) by Region 2025 & 2033
- Figure 2: Asia Pacific Graphene Nanocomposites Market Revenue (million), by Type 2025 & 2033
- Figure 3: Asia Pacific Graphene Nanocomposites Market Revenue Share (%), by Type 2025 & 2033
- Figure 4: Asia Pacific Graphene Nanocomposites Market Revenue (million), by End-user Industry 2025 & 2033
- Figure 5: Asia Pacific Graphene Nanocomposites Market Revenue Share (%), by End-user Industry 2025 & 2033
- Figure 6: Asia Pacific Graphene Nanocomposites Market Revenue (million), by Country 2025 & 2033
- Figure 7: Asia Pacific Graphene Nanocomposites Market Revenue Share (%), by Country 2025 & 2033
- Figure 8: North America Graphene Nanocomposites Market Revenue (million), by Type 2025 & 2033
- Figure 9: North America Graphene Nanocomposites Market Revenue Share (%), by Type 2025 & 2033
- Figure 10: North America Graphene Nanocomposites Market Revenue (million), by End-user Industry 2025 & 2033
- Figure 11: North America Graphene Nanocomposites Market Revenue Share (%), by End-user Industry 2025 & 2033
- Figure 12: North America Graphene Nanocomposites Market Revenue (million), by Country 2025 & 2033
- Figure 13: North America Graphene Nanocomposites Market Revenue Share (%), by Country 2025 & 2033
- Figure 14: Europe Graphene Nanocomposites Market Revenue (million), by Type 2025 & 2033
- Figure 15: Europe Graphene Nanocomposites Market Revenue Share (%), by Type 2025 & 2033
- Figure 16: Europe Graphene Nanocomposites Market Revenue (million), by End-user Industry 2025 & 2033
- Figure 17: Europe Graphene Nanocomposites Market Revenue Share (%), by End-user Industry 2025 & 2033
- Figure 18: Europe Graphene Nanocomposites Market Revenue (million), by Country 2025 & 2033
- Figure 19: Europe Graphene Nanocomposites Market Revenue Share (%), by Country 2025 & 2033
- Figure 20: South America Graphene Nanocomposites Market Revenue (million), by Type 2025 & 2033
- Figure 21: South America Graphene Nanocomposites Market Revenue Share (%), by Type 2025 & 2033
- Figure 22: South America Graphene Nanocomposites Market Revenue (million), by End-user Industry 2025 & 2033
- Figure 23: South America Graphene Nanocomposites Market Revenue Share (%), by End-user Industry 2025 & 2033
- Figure 24: South America Graphene Nanocomposites Market Revenue (million), by Country 2025 & 2033
- Figure 25: South America Graphene Nanocomposites Market Revenue Share (%), by Country 2025 & 2033
- Figure 26: Middle East and Africa Graphene Nanocomposites Market Revenue (million), by Type 2025 & 2033
- Figure 27: Middle East and Africa Graphene Nanocomposites Market Revenue Share (%), by Type 2025 & 2033
- Figure 28: Middle East and Africa Graphene Nanocomposites Market Revenue (million), by End-user Industry 2025 & 2033
- Figure 29: Middle East and Africa Graphene Nanocomposites Market Revenue Share (%), by End-user Industry 2025 & 2033
- Figure 30: Middle East and Africa Graphene Nanocomposites Market Revenue (million), by Country 2025 & 2033
- Figure 31: Middle East and Africa Graphene Nanocomposites Market Revenue Share (%), by Country 2025 & 2033
List of Tables
- Table 1: Global Graphene Nanocomposites Market Revenue million Forecast, by Type 2020 & 2033
- Table 2: Global Graphene Nanocomposites Market Revenue million Forecast, by End-user Industry 2020 & 2033
- Table 3: Global Graphene Nanocomposites Market Revenue million Forecast, by Region 2020 & 2033
- Table 4: Global Graphene Nanocomposites Market Revenue million Forecast, by Type 2020 & 2033
- Table 5: Global Graphene Nanocomposites Market Revenue million Forecast, by End-user Industry 2020 & 2033
- Table 6: Global Graphene Nanocomposites Market Revenue million Forecast, by Country 2020 & 2033
- Table 7: China Graphene Nanocomposites Market Revenue (million) Forecast, by Application 2020 & 2033
- Table 8: India Graphene Nanocomposites Market Revenue (million) Forecast, by Application 2020 & 2033
- Table 9: Japan Graphene Nanocomposites Market Revenue (million) Forecast, by Application 2020 & 2033
- Table 10: South Korea Graphene Nanocomposites Market Revenue (million) Forecast, by Application 2020 & 2033
- Table 11: Rest of Asia Pacific Graphene Nanocomposites Market Revenue (million) Forecast, by Application 2020 & 2033
- Table 12: Global Graphene Nanocomposites Market Revenue million Forecast, by Type 2020 & 2033
- Table 13: Global Graphene Nanocomposites Market Revenue million Forecast, by End-user Industry 2020 & 2033
- Table 14: Global Graphene Nanocomposites Market Revenue million Forecast, by Country 2020 & 2033
- Table 15: United States Graphene Nanocomposites Market Revenue (million) Forecast, by Application 2020 & 2033
- Table 16: Canada Graphene Nanocomposites Market Revenue (million) Forecast, by Application 2020 & 2033
- Table 17: Mexico Graphene Nanocomposites Market Revenue (million) Forecast, by Application 2020 & 2033
- Table 18: Global Graphene Nanocomposites Market Revenue million Forecast, by Type 2020 & 2033
- Table 19: Global Graphene Nanocomposites Market Revenue million Forecast, by End-user Industry 2020 & 2033
- Table 20: Global Graphene Nanocomposites Market Revenue million Forecast, by Country 2020 & 2033
- Table 21: Germany Graphene Nanocomposites Market Revenue (million) Forecast, by Application 2020 & 2033
- Table 22: United Kingdom Graphene Nanocomposites Market Revenue (million) Forecast, by Application 2020 & 2033
- Table 23: Italy Graphene Nanocomposites Market Revenue (million) Forecast, by Application 2020 & 2033
- Table 24: France Graphene Nanocomposites Market Revenue (million) Forecast, by Application 2020 & 2033
- Table 25: Rest of Europe Graphene Nanocomposites Market Revenue (million) Forecast, by Application 2020 & 2033
- Table 26: Global Graphene Nanocomposites Market Revenue million Forecast, by Type 2020 & 2033
- Table 27: Global Graphene Nanocomposites Market Revenue million Forecast, by End-user Industry 2020 & 2033
- Table 28: Global Graphene Nanocomposites Market Revenue million Forecast, by Country 2020 & 2033
- Table 29: Brazil Graphene Nanocomposites Market Revenue (million) Forecast, by Application 2020 & 2033
- Table 30: Argentina Graphene Nanocomposites Market Revenue (million) Forecast, by Application 2020 & 2033
- Table 31: Rest of South America Graphene Nanocomposites Market Revenue (million) Forecast, by Application 2020 & 2033
- Table 32: Global Graphene Nanocomposites Market Revenue million Forecast, by Type 2020 & 2033
- Table 33: Global Graphene Nanocomposites Market Revenue million Forecast, by End-user Industry 2020 & 2033
- Table 34: Global Graphene Nanocomposites Market Revenue million Forecast, by Country 2020 & 2033
- Table 35: Saudi Arabia Graphene Nanocomposites Market Revenue (million) Forecast, by Application 2020 & 2033
- Table 36: South Africa Graphene Nanocomposites Market Revenue (million) Forecast, by Application 2020 & 2033
- Table 37: Rest of Middle East and Africa Graphene Nanocomposites Market Revenue (million) Forecast, by Application 2020 & 2033
Frequently Asked Questions
1. What is the projected Compound Annual Growth Rate (CAGR) of the Graphene Nanocomposites Market?
The projected CAGR is approximately 25.4%.
2. Which companies are prominent players in the Graphene Nanocomposites Market?
Key companies in the market include Haydale Graphene Industries plc, Versarien plc, GrapheneTech S L, NanoXplore Inc, Graphenea, Applied Graphene Materials, XG Sciences, Directa Plus S p A, Abalonyx AS, Aztrong*List Not Exhaustive.
3. What are the main segments of the Graphene Nanocomposites Market?
The market segments include Type, End-user Industry.
4. Can you provide details about the market size?
The market size is estimated to be USD 38.1 million as of 2022.
5. What are some drivers contributing to market growth?
Rising Applications from Electronic Sector; Increasing Adoption in Biomedical Devices.
6. What are the notable trends driving market growth?
Rising Demand from Electrical and Electronics End-user Industries.
7. Are there any restraints impacting market growth?
Rising Applications from Electronic Sector; Increasing Adoption in Biomedical Devices.
8. Can you provide examples of recent developments in the market?
In January 2022, Haydale Graphene Industries plc., announced the incorporation of graphene nano-platelets (GNPs) in its cosmetic face mask sheets and PPE face masks, iCraft is using Haydale's functionalized GNPs in its graphene-coated fabric, THERMiT.
9. What pricing options are available for accessing the report?
Pricing options include single-user, multi-user, and enterprise licenses priced at USD 4750, USD 5250, and USD 8750 respectively.
10. Is the market size provided in terms of value or volume?
The market size is provided in terms of value, measured in million.
11. Are there any specific market keywords associated with the report?
Yes, the market keyword associated with the report is "Graphene Nanocomposites Market," which aids in identifying and referencing the specific market segment covered.
12. How do I determine which pricing option suits my needs best?
The pricing options vary based on user requirements and access needs. Individual users may opt for single-user licenses, while businesses requiring broader access may choose multi-user or enterprise licenses for cost-effective access to the report.
13. Are there any additional resources or data provided in the Graphene Nanocomposites Market report?
While the report offers comprehensive insights, it's advisable to review the specific contents or supplementary materials provided to ascertain if additional resources or data are available.
14. How can I stay updated on further developments or reports in the Graphene Nanocomposites Market?
To stay informed about further developments, trends, and reports in the Graphene Nanocomposites Market, consider subscribing to industry newsletters, following relevant companies and organizations, or regularly checking reputable industry news sources and publications.
Methodology
Step 1 - Identification of Relevant Samples Size from Population Database


Step 2 - Approaches for Defining Global Market Size (Value, Volume* & Price*)

Note*: In applicable scenarios
Step 3 - Data Sources
Primary Research
- Web Analytics
- Survey Reports
- Research Institute
- Latest Research Reports
- Opinion Leaders
Secondary Research
- Annual Reports
- White Paper
- Latest Press Release
- Industry Association
- Paid Database
- Investor Presentations

Step 4 - Data Triangulation
Involves using different sources of information in order to increase the validity of a study
These sources are likely to be stakeholders in a program - participants, other researchers, program staff, other community members, and so on.
Then we put all data in single framework & apply various statistical tools to find out the dynamic on the market.
During the analysis stage, feedback from the stakeholder groups would be compared to determine areas of agreement as well as areas of divergence