

Key Insights
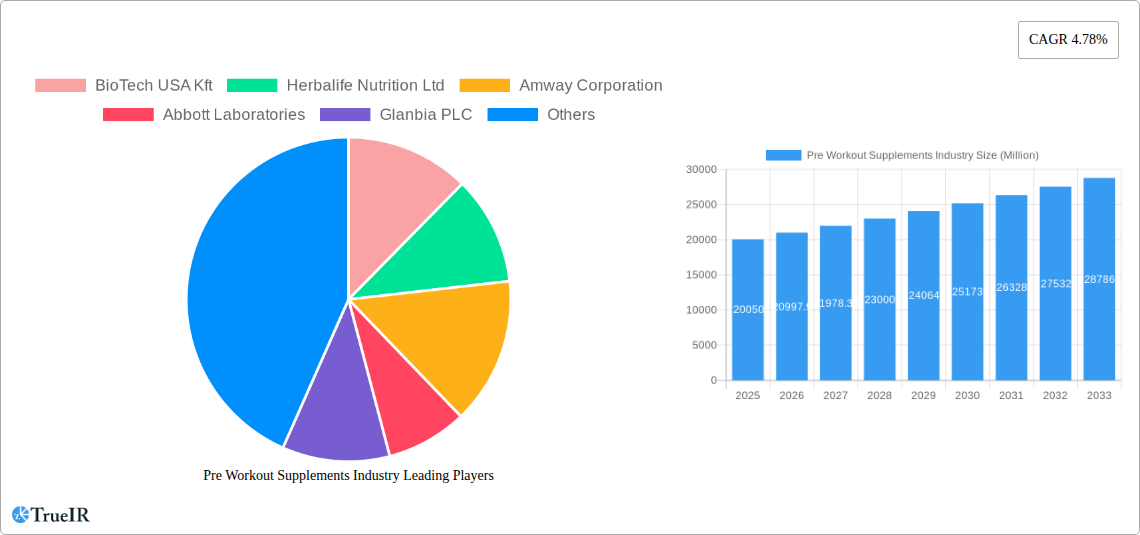
The pre-workout supplement market, valued at $20.05 billion in 2025, is projected to experience robust growth, driven by a rising health-conscious population, increasing participation in fitness activities, and the growing popularity of functional fitness. The market's Compound Annual Growth Rate (CAGR) of 4.78% from 2019-2024 suggests a continued upward trajectory. Key growth drivers include the expanding availability of diverse product formats—powders, capsules/tablets, and ready-to-drink options—catering to varied consumer preferences. The rise of e-commerce also significantly boosts accessibility, supplementing traditional channels like hypermarkets, supermarkets, and specialty stores. However, concerns regarding ingredient safety and efficacy, coupled with potential side effects, present challenges to the market's sustained growth. Furthermore, stringent regulatory frameworks in certain regions might impede market expansion. The market segmentation reveals a strong preference for powder supplements, indicating a significant portion of consumers value the flexibility and customization offered by this format. North America and Europe currently dominate the market share, but the Asia-Pacific region exhibits substantial growth potential, fueled by increasing disposable incomes and fitness awareness. Competition within the market is fierce, with major players like Biotech USA, Herbalife Nutrition, and Amway vying for market share alongside specialized brands such as MusclePharm and Nutrabolt. Future growth will likely hinge on product innovation, focusing on natural ingredients, improved formulations, and enhanced transparency regarding ingredient sourcing and manufacturing processes.
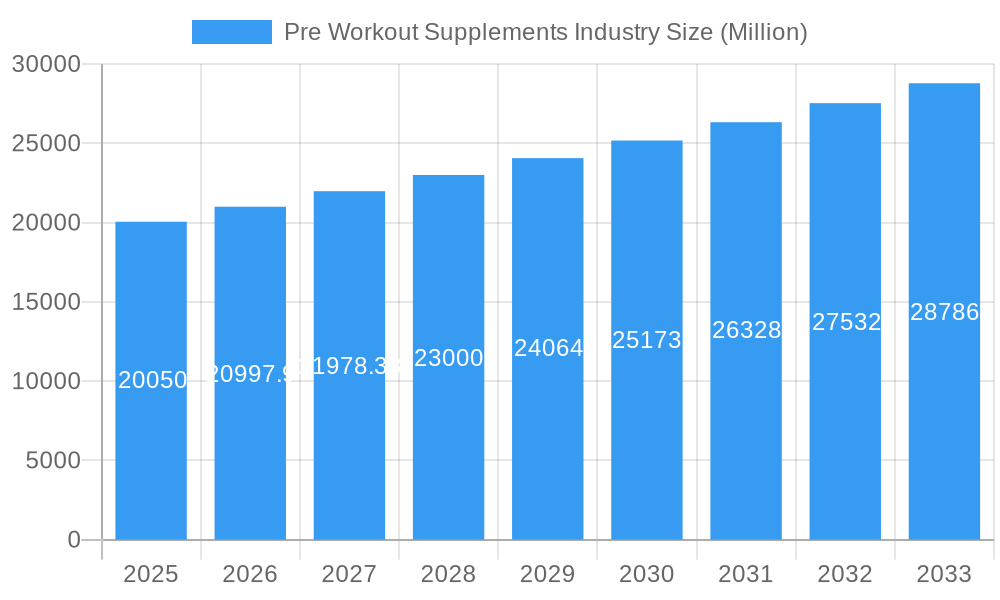
Pre Workout Supplements Industry Market Size (In Billion)
The forecast period from 2025 to 2033 anticipates continued expansion. Estimating future market size requires considering the CAGR and incorporating external factors. Given the 4.78% CAGR over the historical period and the aforementioned drivers, a conservative estimate of the market size in 2033 could be in the range of $30-35 billion. This projection takes into account potential market saturation in mature markets and the ongoing need for product innovation to attract and retain consumers. The regional distribution will likely see a gradual shift toward Asia Pacific as its market matures, though North America and Europe will maintain significant market shares due to established consumer bases and strong distribution networks. The competitive landscape will continue to evolve with mergers and acquisitions, as well as the emergence of new, innovative brands.
Pre Workout Supplements Industry Company Market Share
This comprehensive report provides a detailed analysis of the global pre workout supplements industry, covering market size, growth trends, competitive landscape, and future outlook from 2019 to 2033. The study period spans 2019-2033, with 2025 serving as both the base and estimated year. The forecast period is 2025-2033, and the historical period is 2019-2024. This report is invaluable for industry stakeholders, investors, and anyone seeking to understand this dynamic market. The market is valued at XX Million in 2025 and is projected to reach XX Million by 2033.
Pre Workout Supplements Industry Market Structure & Competitive Landscape
The pre workout supplements market exhibits a moderately concentrated structure, with several key players holding significant market share. Concentration ratios, such as the Herfindahl-Hirschman Index (HHI), are expected to fall within the range of XX, indicating a competitive yet not overly fragmented landscape. Innovation is a crucial driver, with companies continually developing new formulations focusing on enhanced efficacy, improved taste, and convenient formats. Regulatory oversight, particularly concerning ingredient labeling and safety, significantly impacts market dynamics. Product substitutes, such as natural energy boosters or alternative training methods, represent a competitive pressure. The end-user segmentation is primarily driven by athletes (both professional and amateur), fitness enthusiasts, and individuals seeking enhanced physical performance. M&A activity in this space has been moderate, with approximately XX deals recorded between 2019 and 2024, mostly involving smaller companies being acquired by larger players seeking to expand their product portfolios and market reach.
- Key Players: BioTech USA Kft, Herbalife Nutrition Ltd, Amway Corporation, Abbott Laboratories, Glanbia PLC, Nutrex Research Inc, MusclePharm Corporation, QNT SA, Bulk, Nutrabolt (list not exhaustive).
- Market Concentration: Moderately concentrated, with HHI estimated at XX.
- Innovation Drivers: Enhanced efficacy, improved taste profiles, convenient formats (e.g., ready-to-drink options).
- Regulatory Impacts: Stringent labeling requirements and safety regulations influence product development and marketing.
- Product Substitutes: Natural energy boosters and alternative training methods.
- End-User Segmentation: Athletes (professional and amateur), fitness enthusiasts, general consumers seeking performance enhancement.
- M&A Activity: Approximately XX deals between 2019 and 2024, driven by expansion strategies.
Pre Workout Supplements Industry Market Trends & Opportunities
The global pre workout supplements market is experiencing robust growth, driven by the increasing popularity of fitness and athletic activities worldwide. The market size is estimated to be XX Million in 2025 and is projected to expand at a Compound Annual Growth Rate (CAGR) of XX% during the forecast period (2025-2033), reaching XX Million by 2033. Technological advancements, including improved ingredient delivery systems and personalized formulations based on genetic testing, are reshaping the market. Consumer preferences are shifting towards cleaner label products with natural ingredients and reduced sugar content. The rising health consciousness and preference for convenient, on-the-go solutions are boosting the demand for ready-to-drink pre workout supplements. Furthermore, the growing adoption of online retail channels is expanding market reach and creating new opportunities for direct-to-consumer brands. Competitive dynamics are intense, with companies focusing on product innovation, marketing strategies, and strategic partnerships to gain market share. Market penetration rates vary significantly across different regions and consumer segments, with higher penetration observed in developed markets and among dedicated fitness enthusiasts.
Dominant Markets & Segments in Pre Workout Supplements Industry
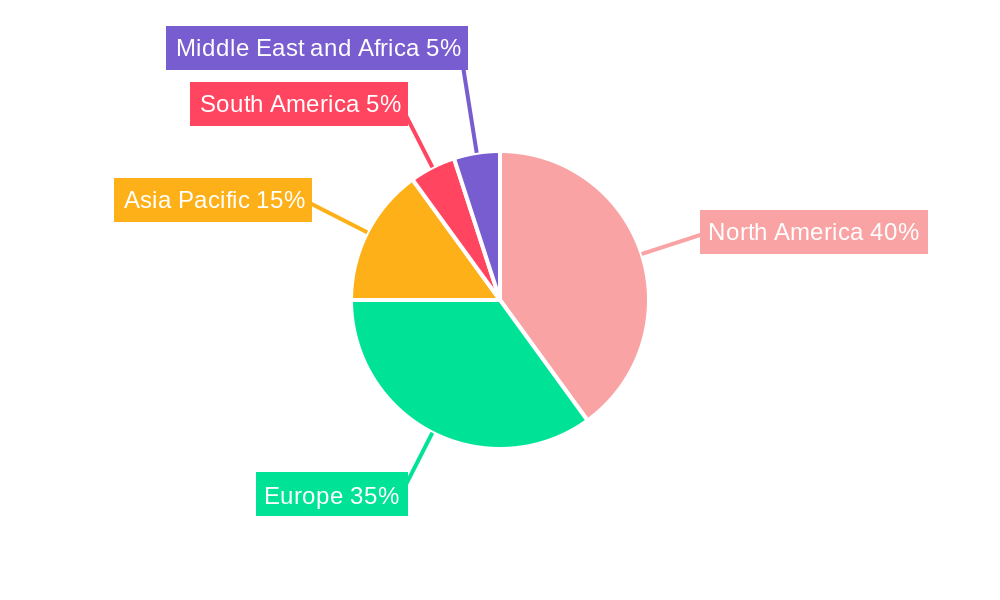
The North American market currently holds the largest share of the global pre-workout supplements market, driven by high fitness awareness, readily available distribution channels, and a well-established consumer base. Within this region, the United States leads in market size. However, Asia Pacific is poised for significant growth in the forecast period, fueled by rising disposable incomes, expanding fitness culture, and increased health consciousness.
- Leading Region: North America (United States specifically)
- Fastest-Growing Region: Asia Pacific
- Dominant Segment (Type): Powder (due to cost-effectiveness and versatility)
- Dominant Segment (Distribution Channel): Online retail stores (due to increasing internet penetration and convenience)
Key Growth Drivers (by Region):
- North America: Strong fitness culture, established distribution networks, high disposable incomes.
- Europe: Rising health consciousness, increasing adoption of online retail channels.
- Asia Pacific: Rapidly expanding fitness culture, growing disposable incomes, increasing health awareness.
Dominant Segments Analysis:
The powder segment dominates due to its affordability and versatility, allowing for customization of dosages and mixes. Online retail channels are expanding rapidly due to convenience, broader product range, and targeted marketing opportunities. However, specialty stores maintain a strong foothold due to expert advice and personalized customer service. Hypermarkets/supermarkets offer mass-market accessibility.
Pre Workout Supplements Industry Product Analysis
Pre workout supplement innovation focuses on enhancing ingredient bioavailability, optimizing formulation for specific athletic goals (e.g., strength, endurance), and integrating novel delivery systems for faster absorption and sustained energy release. Products are differentiated by ingredient profiles (e.g., caffeine levels, creatine types), flavor variations, and convenient formats (e.g., ready-to-drink, capsules, powders). Competitive advantages are built on superior formulation, proven efficacy, brand reputation, marketing effectiveness, and strong distribution networks. Technological advancements include the use of liposomal encapsulation for enhanced nutrient delivery and the incorporation of personalized nutrition strategies based on genetic testing.
Key Drivers, Barriers & Challenges in Pre Workout Supplements Industry
Key Drivers:
- Rising health consciousness: Increased awareness of health and fitness is driving demand.
- Growing fitness culture: The global fitness trend significantly boosts market demand.
- Technological advancements: Improved formulations and delivery systems are enhancing product appeal.
Challenges and Restraints:
- Stringent regulations: Varying regulatory frameworks across different countries create complexities.
- Supply chain disruptions: Raw material shortages and logistics challenges can impact availability.
- Intense competition: The market is highly competitive, requiring continuous innovation to stay ahead. This is further impacted by the rise of private label brands, which exert downward pressure on margins.
Growth Drivers in the Pre Workout Supplements Industry Market
The primary growth drivers are the increasing popularity of fitness and wellness, the growing awareness of the importance of sports nutrition, and technological advancements leading to superior product formulations. Government initiatives supporting sports development and increased investment in research and development further bolster market growth. Economic factors like rising disposable incomes and increased health expenditure also play a crucial role.
Challenges Impacting Pre Workout Supplements Industry Growth
Major challenges include stringent regulatory requirements, fluctuations in raw material prices, and intense competition from established brands and new entrants. Supply chain vulnerabilities and potential health concerns associated with certain ingredients represent additional hurdles.
Key Players Shaping the Pre Workout Supplements Industry Market
- BioTech USA Kft
- Herbalife Nutrition Ltd
- Amway Corporation
- Abbott Laboratories
- Glanbia PLC
- Nutrex Research Inc
- MusclePharm Corporation
- QNT SA
- Bulk
- Nutrabolt
Significant Pre Workout Supplements Industry Milestones
- 2020: Several key players launched new lines of vegan-friendly pre-workout supplements, aligning with growing consumer demand.
- 2021: Increased regulatory scrutiny in several key markets led to reformulations of certain products.
- 2022: A major merger between two mid-sized companies significantly altered the competitive landscape.
- 2023: Several companies invested heavily in direct-to-consumer marketing and e-commerce strategies.
- 2024: The introduction of personalized pre-workout supplement recommendations based on genetic profiling marked a significant technological advancement.
Future Outlook for Pre Workout Supplements Industry Market
The pre workout supplements market is poised for continued growth, driven by evolving consumer preferences, technological innovations, and expanding global fitness culture. Strategic partnerships, product diversification, and a focus on sustainability will be key to success. Market penetration in emerging economies presents significant opportunities. The market is expected to witness a shift toward personalized and functional formulations, driven by increasing consumer demand for tailored nutrition solutions.
Pre Workout Supplements Industry Segmentation
-
1. Type
- 1.1. Powder
- 1.2. Capsule/ Tablet
- 1.3. Drinks
- 1.4. Other Types
-
2. Distribution Channel
- 2.1. Hypermarket/Supermarket
- 2.2. Specialty Stores
- 2.3. Online Retail Stores
- 2.4. Other Distribution Channels
Pre Workout Supplements Industry Segmentation By Geography
-
1. North America
- 1.1. United States
- 1.2. Canada
- 1.3. Mexico
- 1.4. Rest of North America
-
2. Europe
- 2.1. Spain
- 2.2. United Kingdom
- 2.3. Germany
- 2.4. France
- 2.5. Italy
- 2.6. Russia
- 2.7. Rest of Europe
-
3. Asia Pacific
- 3.1. China
- 3.2. Japan
- 3.3. India
- 3.4. Australia
- 3.5. Rest of Asia Pacific
-
4. South America
- 4.1. Brazil
- 4.2. Argentina
- 4.3. Rest of South America
-
5. Middle East and Africa
- 5.1. United Arab Emirates
- 5.2. South Africa
- 5.3. Rest of Middle East and Africa
Pre Workout Supplements Industry Regional Market Share
Geographic Coverage of Pre Workout Supplements Industry
Pre Workout Supplements Industry REPORT HIGHLIGHTS
| Aspects | Details |
|---|---|
| Study Period | 2020-2034 |
| Base Year | 2025 |
| Estimated Year | 2026 |
| Forecast Period | 2026-2034 |
| Historical Period | 2020-2025 |
| Growth Rate | CAGR of 4.78% from 2020-2034 |
| Segmentation |
|
Table of Contents
- 1. Introduction
- 1.1. Research Scope
- 1.2. Market Segmentation
- 1.3. Research Objective
- 1.4. Definitions and Assumptions
- 2. Executive Summary
- 2.1. Market Snapshot
- 3. Market Dynamics
- 3.1. Market Drivers
- 3.2. Market Restrains
- 3.3. Market Trends
- 3.4. Market Opportunities
- 4. Market Factor Analysis
- 4.1. Porters Five Forces
- 4.1.1. Bargaining Power of Suppliers
- 4.1.2. Bargaining Power of Buyers
- 4.1.3. Threat of New Entrants
- 4.1.4. Threat of Substitutes
- 4.1.5. Competitive Rivalry
- 4.2. PESTEL analysis
- 4.3. BCG Analysis
- 4.3.1. Stars (High Growth, High Market Share)
- 4.3.2. Cash Cows (Low Growth, High Market Share)
- 4.3.3. Question Mark (High Growth, Low Market Share)
- 4.3.4. Dogs (Low Growth, Low Market Share)
- 4.4. Ansoff Matrix Analysis
- 4.5. Supply Chain Analysis
- 4.6. Regulatory Landscape
- 4.7. Current Market Potential and Opportunity Assessment (TAM–SAM–SOM Framework)
- 4.8. TIR Analyst Note
- 4.1. Porters Five Forces
- 5. Market Analysis, Insights and Forecast 2021-2033
- 5.1. Market Analysis, Insights and Forecast - by Type
- 5.1.1. Powder
- 5.1.2. Capsule/ Tablet
- 5.1.3. Drinks
- 5.1.4. Other Types
- 5.2. Market Analysis, Insights and Forecast - by Distribution Channel
- 5.2.1. Hypermarket/Supermarket
- 5.2.2. Specialty Stores
- 5.2.3. Online Retail Stores
- 5.2.4. Other Distribution Channels
- 5.3. Market Analysis, Insights and Forecast - by Region
- 5.3.1. North America
- 5.3.2. Europe
- 5.3.3. Asia Pacific
- 5.3.4. South America
- 5.3.5. Middle East and Africa
- 5.1. Market Analysis, Insights and Forecast - by Type
- 6. Global Pre Workout Supplements Industry Analysis, Insights and Forecast, 2021-2033
- 6.1. Market Analysis, Insights and Forecast - by Type
- 6.1.1. Powder
- 6.1.2. Capsule/ Tablet
- 6.1.3. Drinks
- 6.1.4. Other Types
- 6.2. Market Analysis, Insights and Forecast - by Distribution Channel
- 6.2.1. Hypermarket/Supermarket
- 6.2.2. Specialty Stores
- 6.2.3. Online Retail Stores
- 6.2.4. Other Distribution Channels
- 6.1. Market Analysis, Insights and Forecast - by Type
- 7. North America Pre Workout Supplements Industry Analysis, Insights and Forecast, 2020-2032
- 7.1. Market Analysis, Insights and Forecast - by Type
- 7.1.1. Powder
- 7.1.2. Capsule/ Tablet
- 7.1.3. Drinks
- 7.1.4. Other Types
- 7.2. Market Analysis, Insights and Forecast - by Distribution Channel
- 7.2.1. Hypermarket/Supermarket
- 7.2.2. Specialty Stores
- 7.2.3. Online Retail Stores
- 7.2.4. Other Distribution Channels
- 7.1. Market Analysis, Insights and Forecast - by Type
- 8. Europe Pre Workout Supplements Industry Analysis, Insights and Forecast, 2020-2032
- 8.1. Market Analysis, Insights and Forecast - by Type
- 8.1.1. Powder
- 8.1.2. Capsule/ Tablet
- 8.1.3. Drinks
- 8.1.4. Other Types
- 8.2. Market Analysis, Insights and Forecast - by Distribution Channel
- 8.2.1. Hypermarket/Supermarket
- 8.2.2. Specialty Stores
- 8.2.3. Online Retail Stores
- 8.2.4. Other Distribution Channels
- 8.1. Market Analysis, Insights and Forecast - by Type
- 9. Asia Pacific Pre Workout Supplements Industry Analysis, Insights and Forecast, 2020-2032
- 9.1. Market Analysis, Insights and Forecast - by Type
- 9.1.1. Powder
- 9.1.2. Capsule/ Tablet
- 9.1.3. Drinks
- 9.1.4. Other Types
- 9.2. Market Analysis, Insights and Forecast - by Distribution Channel
- 9.2.1. Hypermarket/Supermarket
- 9.2.2. Specialty Stores
- 9.2.3. Online Retail Stores
- 9.2.4. Other Distribution Channels
- 9.1. Market Analysis, Insights and Forecast - by Type
- 10. South America Pre Workout Supplements Industry Analysis, Insights and Forecast, 2020-2032
- 10.1. Market Analysis, Insights and Forecast - by Type
- 10.1.1. Powder
- 10.1.2. Capsule/ Tablet
- 10.1.3. Drinks
- 10.1.4. Other Types
- 10.2. Market Analysis, Insights and Forecast - by Distribution Channel
- 10.2.1. Hypermarket/Supermarket
- 10.2.2. Specialty Stores
- 10.2.3. Online Retail Stores
- 10.2.4. Other Distribution Channels
- 10.1. Market Analysis, Insights and Forecast - by Type
- 11. Middle East and Africa Pre Workout Supplements Industry Analysis, Insights and Forecast, 2020-2032
- 11.1. Market Analysis, Insights and Forecast - by Type
- 11.1.1. Powder
- 11.1.2. Capsule/ Tablet
- 11.1.3. Drinks
- 11.1.4. Other Types
- 11.2. Market Analysis, Insights and Forecast - by Distribution Channel
- 11.2.1. Hypermarket/Supermarket
- 11.2.2. Specialty Stores
- 11.2.3. Online Retail Stores
- 11.2.4. Other Distribution Channels
- 11.1. Market Analysis, Insights and Forecast - by Type
- 12. Competitive Analysis
- 12.1. Company Profiles
- 12.1.1 BioTech USA Kft
- 12.1.1.1. Company Overview
- 12.1.1.2. Products
- 12.1.1.3. Company Financials
- 12.1.1.4. SWOT Analysis
- 12.1.2 Herbalife Nutrition Ltd
- 12.1.2.1. Company Overview
- 12.1.2.2. Products
- 12.1.2.3. Company Financials
- 12.1.2.4. SWOT Analysis
- 12.1.3 Amway Corporation
- 12.1.3.1. Company Overview
- 12.1.3.2. Products
- 12.1.3.3. Company Financials
- 12.1.3.4. SWOT Analysis
- 12.1.4 Abbott Laboratories
- 12.1.4.1. Company Overview
- 12.1.4.2. Products
- 12.1.4.3. Company Financials
- 12.1.4.4. SWOT Analysis
- 12.1.5 Glanbia PLC
- 12.1.5.1. Company Overview
- 12.1.5.2. Products
- 12.1.5.3. Company Financials
- 12.1.5.4. SWOT Analysis
- 12.1.6 Nutrex Research Inc *List Not Exhaustive
- 12.1.6.1. Company Overview
- 12.1.6.2. Products
- 12.1.6.3. Company Financials
- 12.1.6.4. SWOT Analysis
- 12.1.7 MusclePharm Corporation
- 12.1.7.1. Company Overview
- 12.1.7.2. Products
- 12.1.7.3. Company Financials
- 12.1.7.4. SWOT Analysis
- 12.1.8 QNT SA
- 12.1.8.1. Company Overview
- 12.1.8.2. Products
- 12.1.8.3. Company Financials
- 12.1.8.4. SWOT Analysis
- 12.1.9 Bulk
- 12.1.9.1. Company Overview
- 12.1.9.2. Products
- 12.1.9.3. Company Financials
- 12.1.9.4. SWOT Analysis
- 12.1.10 Nutrabolt
- 12.1.10.1. Company Overview
- 12.1.10.2. Products
- 12.1.10.3. Company Financials
- 12.1.10.4. SWOT Analysis
- 12.1.1 BioTech USA Kft
- 12.2. Market Entropy
- 12.2.1 Company's Key Areas Served
- 12.2.2 Recent Developments
- 12.3. Company Market Share Analysis 2025
- 12.3.1 Top 5 Companies Market Share Analysis
- 12.3.2 Top 3 Companies Market Share Analysis
- 12.4. List of Potential Customers
- 13. Research Methodology
List of Figures
- Figure 1: Global Pre Workout Supplements Industry Revenue Breakdown (Million, %) by Region 2025 & 2033
- Figure 2: North America Pre Workout Supplements Industry Revenue (Million), by Type 2025 & 2033
- Figure 3: North America Pre Workout Supplements Industry Revenue Share (%), by Type 2025 & 2033
- Figure 4: North America Pre Workout Supplements Industry Revenue (Million), by Distribution Channel 2025 & 2033
- Figure 5: North America Pre Workout Supplements Industry Revenue Share (%), by Distribution Channel 2025 & 2033
- Figure 6: North America Pre Workout Supplements Industry Revenue (Million), by Country 2025 & 2033
- Figure 7: North America Pre Workout Supplements Industry Revenue Share (%), by Country 2025 & 2033
- Figure 8: Europe Pre Workout Supplements Industry Revenue (Million), by Type 2025 & 2033
- Figure 9: Europe Pre Workout Supplements Industry Revenue Share (%), by Type 2025 & 2033
- Figure 10: Europe Pre Workout Supplements Industry Revenue (Million), by Distribution Channel 2025 & 2033
- Figure 11: Europe Pre Workout Supplements Industry Revenue Share (%), by Distribution Channel 2025 & 2033
- Figure 12: Europe Pre Workout Supplements Industry Revenue (Million), by Country 2025 & 2033
- Figure 13: Europe Pre Workout Supplements Industry Revenue Share (%), by Country 2025 & 2033
- Figure 14: Asia Pacific Pre Workout Supplements Industry Revenue (Million), by Type 2025 & 2033
- Figure 15: Asia Pacific Pre Workout Supplements Industry Revenue Share (%), by Type 2025 & 2033
- Figure 16: Asia Pacific Pre Workout Supplements Industry Revenue (Million), by Distribution Channel 2025 & 2033
- Figure 17: Asia Pacific Pre Workout Supplements Industry Revenue Share (%), by Distribution Channel 2025 & 2033
- Figure 18: Asia Pacific Pre Workout Supplements Industry Revenue (Million), by Country 2025 & 2033
- Figure 19: Asia Pacific Pre Workout Supplements Industry Revenue Share (%), by Country 2025 & 2033
- Figure 20: South America Pre Workout Supplements Industry Revenue (Million), by Type 2025 & 2033
- Figure 21: South America Pre Workout Supplements Industry Revenue Share (%), by Type 2025 & 2033
- Figure 22: South America Pre Workout Supplements Industry Revenue (Million), by Distribution Channel 2025 & 2033
- Figure 23: South America Pre Workout Supplements Industry Revenue Share (%), by Distribution Channel 2025 & 2033
- Figure 24: South America Pre Workout Supplements Industry Revenue (Million), by Country 2025 & 2033
- Figure 25: South America Pre Workout Supplements Industry Revenue Share (%), by Country 2025 & 2033
- Figure 26: Middle East and Africa Pre Workout Supplements Industry Revenue (Million), by Type 2025 & 2033
- Figure 27: Middle East and Africa Pre Workout Supplements Industry Revenue Share (%), by Type 2025 & 2033
- Figure 28: Middle East and Africa Pre Workout Supplements Industry Revenue (Million), by Distribution Channel 2025 & 2033
- Figure 29: Middle East and Africa Pre Workout Supplements Industry Revenue Share (%), by Distribution Channel 2025 & 2033
- Figure 30: Middle East and Africa Pre Workout Supplements Industry Revenue (Million), by Country 2025 & 2033
- Figure 31: Middle East and Africa Pre Workout Supplements Industry Revenue Share (%), by Country 2025 & 2033
List of Tables
- Table 1: Global Pre Workout Supplements Industry Revenue Million Forecast, by Type 2020 & 2033
- Table 2: Global Pre Workout Supplements Industry Revenue Million Forecast, by Distribution Channel 2020 & 2033
- Table 3: Global Pre Workout Supplements Industry Revenue Million Forecast, by Region 2020 & 2033
- Table 4: Global Pre Workout Supplements Industry Revenue Million Forecast, by Type 2020 & 2033
- Table 5: Global Pre Workout Supplements Industry Revenue Million Forecast, by Distribution Channel 2020 & 2033
- Table 6: Global Pre Workout Supplements Industry Revenue Million Forecast, by Country 2020 & 2033
- Table 7: United States Pre Workout Supplements Industry Revenue (Million) Forecast, by Application 2020 & 2033
- Table 8: Canada Pre Workout Supplements Industry Revenue (Million) Forecast, by Application 2020 & 2033
- Table 9: Mexico Pre Workout Supplements Industry Revenue (Million) Forecast, by Application 2020 & 2033
- Table 10: Rest of North America Pre Workout Supplements Industry Revenue (Million) Forecast, by Application 2020 & 2033
- Table 11: Global Pre Workout Supplements Industry Revenue Million Forecast, by Type 2020 & 2033
- Table 12: Global Pre Workout Supplements Industry Revenue Million Forecast, by Distribution Channel 2020 & 2033
- Table 13: Global Pre Workout Supplements Industry Revenue Million Forecast, by Country 2020 & 2033
- Table 14: Spain Pre Workout Supplements Industry Revenue (Million) Forecast, by Application 2020 & 2033
- Table 15: United Kingdom Pre Workout Supplements Industry Revenue (Million) Forecast, by Application 2020 & 2033
- Table 16: Germany Pre Workout Supplements Industry Revenue (Million) Forecast, by Application 2020 & 2033
- Table 17: France Pre Workout Supplements Industry Revenue (Million) Forecast, by Application 2020 & 2033
- Table 18: Italy Pre Workout Supplements Industry Revenue (Million) Forecast, by Application 2020 & 2033
- Table 19: Russia Pre Workout Supplements Industry Revenue (Million) Forecast, by Application 2020 & 2033
- Table 20: Rest of Europe Pre Workout Supplements Industry Revenue (Million) Forecast, by Application 2020 & 2033
- Table 21: Global Pre Workout Supplements Industry Revenue Million Forecast, by Type 2020 & 2033
- Table 22: Global Pre Workout Supplements Industry Revenue Million Forecast, by Distribution Channel 2020 & 2033
- Table 23: Global Pre Workout Supplements Industry Revenue Million Forecast, by Country 2020 & 2033
- Table 24: China Pre Workout Supplements Industry Revenue (Million) Forecast, by Application 2020 & 2033
- Table 25: Japan Pre Workout Supplements Industry Revenue (Million) Forecast, by Application 2020 & 2033
- Table 26: India Pre Workout Supplements Industry Revenue (Million) Forecast, by Application 2020 & 2033
- Table 27: Australia Pre Workout Supplements Industry Revenue (Million) Forecast, by Application 2020 & 2033
- Table 28: Rest of Asia Pacific Pre Workout Supplements Industry Revenue (Million) Forecast, by Application 2020 & 2033
- Table 29: Global Pre Workout Supplements Industry Revenue Million Forecast, by Type 2020 & 2033
- Table 30: Global Pre Workout Supplements Industry Revenue Million Forecast, by Distribution Channel 2020 & 2033
- Table 31: Global Pre Workout Supplements Industry Revenue Million Forecast, by Country 2020 & 2033
- Table 32: Brazil Pre Workout Supplements Industry Revenue (Million) Forecast, by Application 2020 & 2033
- Table 33: Argentina Pre Workout Supplements Industry Revenue (Million) Forecast, by Application 2020 & 2033
- Table 34: Rest of South America Pre Workout Supplements Industry Revenue (Million) Forecast, by Application 2020 & 2033
- Table 35: Global Pre Workout Supplements Industry Revenue Million Forecast, by Type 2020 & 2033
- Table 36: Global Pre Workout Supplements Industry Revenue Million Forecast, by Distribution Channel 2020 & 2033
- Table 37: Global Pre Workout Supplements Industry Revenue Million Forecast, by Country 2020 & 2033
- Table 38: United Arab Emirates Pre Workout Supplements Industry Revenue (Million) Forecast, by Application 2020 & 2033
- Table 39: South Africa Pre Workout Supplements Industry Revenue (Million) Forecast, by Application 2020 & 2033
- Table 40: Rest of Middle East and Africa Pre Workout Supplements Industry Revenue (Million) Forecast, by Application 2020 & 2033
Frequently Asked Questions
1. What is the projected Compound Annual Growth Rate (CAGR) of the Pre Workout Supplements Industry?
The projected CAGR is approximately 4.78%.
2. Which companies are prominent players in the Pre Workout Supplements Industry?
Key companies in the market include BioTech USA Kft, Herbalife Nutrition Ltd, Amway Corporation, Abbott Laboratories, Glanbia PLC, Nutrex Research Inc *List Not Exhaustive, MusclePharm Corporation, QNT SA, Bulk, Nutrabolt.
3. What are the main segments of the Pre Workout Supplements Industry?
The market segments include Type, Distribution Channel.
4. Can you provide details about the market size?
The market size is estimated to be USD 20.05 Million as of 2022.
5. What are some drivers contributing to market growth?
Increasing Trend of Consuming Cocktails; Rising Demand for Premium Spirits.
6. What are the notable trends driving market growth?
Growing Influence of Healthy Lifestyle Trends and Rising Number of Non-Traditional Users.
7. Are there any restraints impacting market growth?
Affordability of the Product is Restraining the Market's Growth.
8. Can you provide examples of recent developments in the market?
N/A
9. What pricing options are available for accessing the report?
Pricing options include single-user, multi-user, and enterprise licenses priced at USD 4750, USD 5250, and USD 8750 respectively.
10. Is the market size provided in terms of value or volume?
The market size is provided in terms of value, measured in Million.
11. Are there any specific market keywords associated with the report?
Yes, the market keyword associated with the report is "Pre Workout Supplements Industry," which aids in identifying and referencing the specific market segment covered.
12. How do I determine which pricing option suits my needs best?
The pricing options vary based on user requirements and access needs. Individual users may opt for single-user licenses, while businesses requiring broader access may choose multi-user or enterprise licenses for cost-effective access to the report.
13. Are there any additional resources or data provided in the Pre Workout Supplements Industry report?
While the report offers comprehensive insights, it's advisable to review the specific contents or supplementary materials provided to ascertain if additional resources or data are available.
14. How can I stay updated on further developments or reports in the Pre Workout Supplements Industry?
To stay informed about further developments, trends, and reports in the Pre Workout Supplements Industry, consider subscribing to industry newsletters, following relevant companies and organizations, or regularly checking reputable industry news sources and publications.
Methodology
Step 1 - Identification of Relevant Samples Size from Population Database


Step 2 - Approaches for Defining Global Market Size (Value, Volume* & Price*)

Note*: In applicable scenarios
Step 3 - Data Sources
Primary Research
- Web Analytics
- Survey Reports
- Research Institute
- Latest Research Reports
- Opinion Leaders
Secondary Research
- Annual Reports
- White Paper
- Latest Press Release
- Industry Association
- Paid Database
- Investor Presentations

Step 4 - Data Triangulation
Involves using different sources of information in order to increase the validity of a study
These sources are likely to be stakeholders in a program - participants, other researchers, program staff, other community members, and so on.
Then we put all data in single framework & apply various statistical tools to find out the dynamic on the market.
During the analysis stage, feedback from the stakeholder groups would be compared to determine areas of agreement as well as areas of divergence