

Key Insights
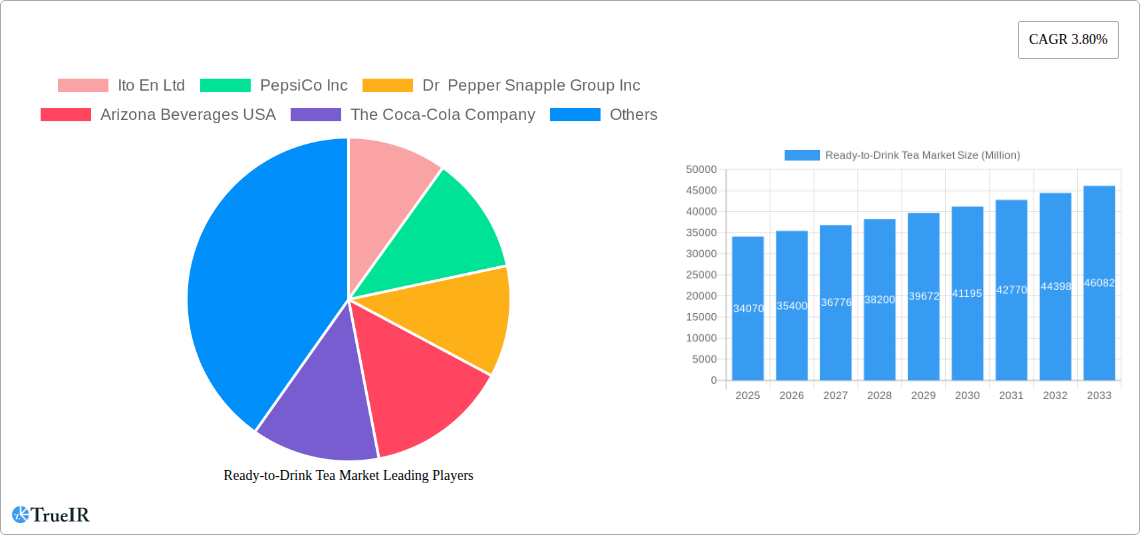
The Ready-to-Drink (RTD) tea market, valued at $34,070 million in 2025, is projected to experience steady growth, driven by several key factors. The increasing consumer preference for healthier beverage options, coupled with the convenience and portability of RTD tea, fuels market expansion. Health-conscious consumers are increasingly seeking natural and functional beverages, leading to a rise in demand for green tea and herbal tea variants. The diverse distribution channels, including supermarkets, convenience stores, and the rapidly growing online retail sector, provide ample opportunities for market penetration. Furthermore, innovative product launches featuring unique flavors, functional ingredients (e.g., added vitamins or antioxidants), and sustainable packaging contribute to market dynamism. While price fluctuations in raw materials and intense competition among established players might pose some challenges, the overall market outlook remains positive.
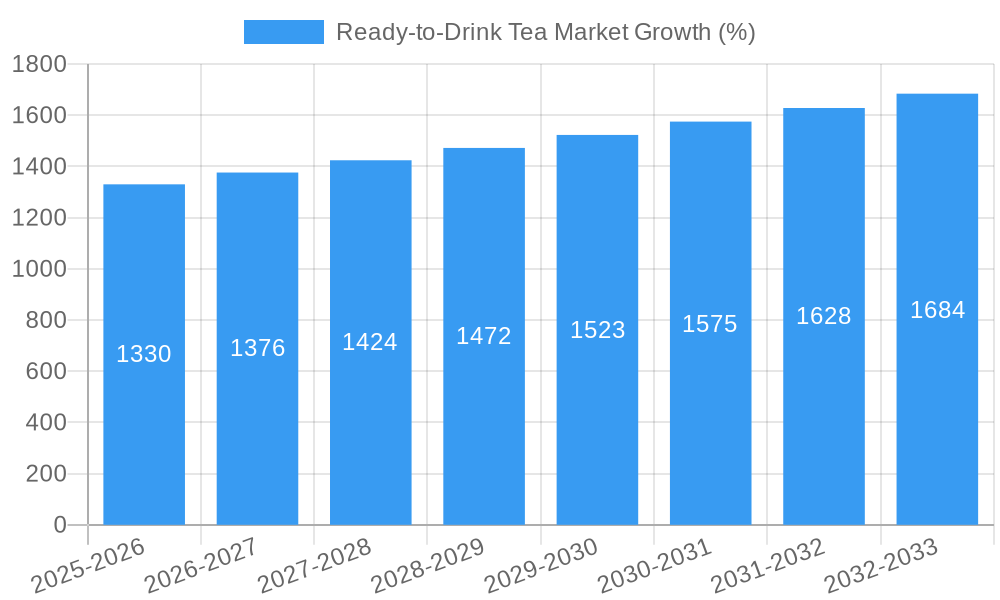
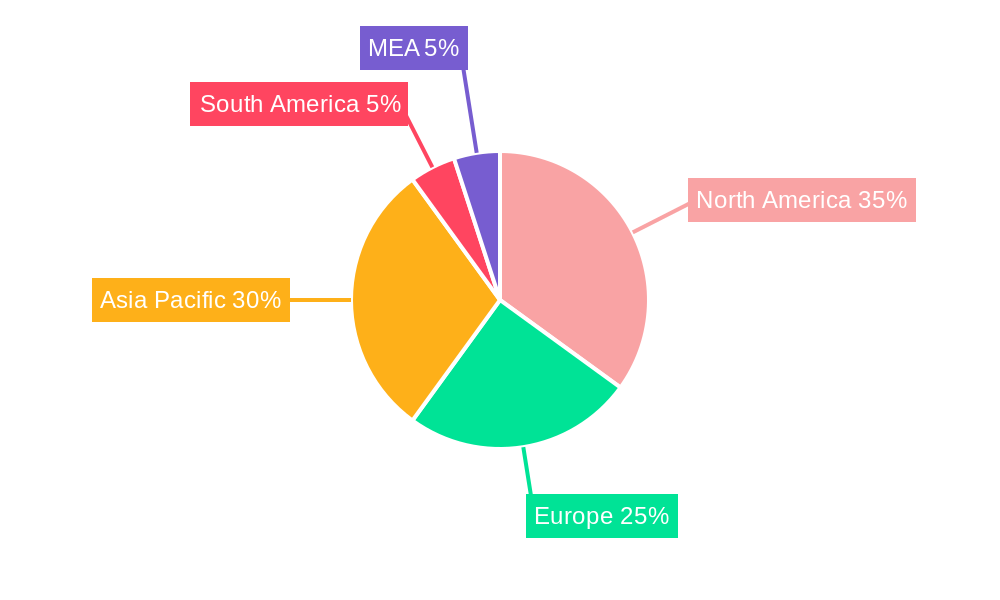
However, regional variations in growth trajectories are expected. North America, with its established tea-drinking culture and strong consumer base, is likely to maintain a significant market share. Asia Pacific, particularly China, Japan, and India, presents substantial growth potential, fueled by rising disposable incomes and changing consumer lifestyles. Europe's market is anticipated to grow at a moderate pace, driven by evolving consumer preferences and the introduction of innovative products tailored to regional tastes. Strategic partnerships, brand extensions, and targeted marketing campaigns focusing on health benefits and convenience are crucial for companies vying for market dominance. The forecast period of 2025-2033 anticipates sustained expansion, with the CAGR of 3.80% suggesting a robust and evolving market landscape. The market segmentation by type (green, herbal, others) and distribution channels further highlights opportunities for targeted marketing strategies and product diversification.
Ready-to-Drink Tea Market: A Comprehensive Market Report (2019-2033)
This dynamic report provides a comprehensive analysis of the Ready-to-Drink (RTD) Tea market, offering invaluable insights for businesses, investors, and industry stakeholders. Leveraging extensive data from 2019-2024 (historical period), the report utilizes the base year of 2025 and forecasts market trends through 2033. This detailed study covers market size, segmentation, competitive landscape, and future growth projections, providing a crucial roadmap for navigating this thriving sector. The report's SEO optimization uses high-volume keywords like "ready-to-drink tea market," "RTD tea market size," "green tea market," and "herbal tea market" to maximize visibility and engagement.
Ready-to-Drink Tea Market Structure & Competitive Landscape
The RTD tea market exhibits a moderately consolidated structure, with a handful of multinational players holding significant market share. The Herfindahl-Hirschman Index (HHI) is estimated at xx in 2025, indicating a moderately concentrated market. Key players like Ito En Ltd, PepsiCo Inc, and Coca-Cola Company exert considerable influence through brand recognition and extensive distribution networks. However, smaller regional players and emerging brands contribute significantly to market dynamism. Innovation, particularly in flavors, functional ingredients (e.g., vitamins, probiotics), and sustainable packaging, is a key driver of competition. Regulatory changes related to food safety and labeling impact market dynamics. Product substitutes, such as juice drinks and other beverages, create competitive pressure, while mergers and acquisitions (M&A) activity, like PepsiCo's acquisition of KeVita, reshape the competitive landscape. In 2025, M&A volume is projected at xx Million USD, with a growing trend towards acquisitions of smaller, specialized tea brands.
- Market Concentration: Moderately Consolidated (HHI: xx in 2025)
- Innovation Drivers: New flavors, functional ingredients, sustainable packaging.
- Regulatory Impacts: Food safety standards, labeling requirements.
- Product Substitutes: Juice drinks, other beverages.
- End-User Segmentation: Diverse, spanning various age groups and demographics.
- M&A Trends: Increasing acquisitions of smaller, specialized tea brands (xx Million USD in 2025).
Ready-to-Drink Tea Market Trends & Opportunities
The global RTD tea market is experiencing robust growth, with a Compound Annual Growth Rate (CAGR) projected at xx% during 2025-2033. This growth is fueled by several key trends. The increasing consumer preference for healthy and natural beverages is a major driver, with RTD tea positioned as a convenient and refreshing alternative to sugary drinks. Technological advancements in packaging and processing techniques improve shelf life and enhance product quality. Furthermore, expanding distribution channels, particularly online retail, broaden market access. However, intense competition among established players and the emergence of new competitors pose ongoing challenges. The market penetration rate is projected at xx% in 2025, highlighting ample opportunities for further expansion, especially in developing economies. Premiumization and functionalization of RTD tea products are also significant market trends, with consumers increasingly willing to pay more for enhanced health benefits and unique flavor profiles.
Dominant Markets & Segments in Ready-to-Drink Tea Market
The Asia-Pacific region dominates the global RTD tea market, driven by high tea consumption and a large and growing population. Within this region, countries like China and Japan are leading markets, boasting established tea cultures and strong consumer demand.
- By Type: Green tea maintains the largest market share, followed by herbal tea. "Others" category includes a diverse range of blends and flavored teas.
- By Distribution Channel: Supermarket/hypermarkets hold a substantial share, but convenience stores are experiencing rapid growth due to increased accessibility. Online stores are emerging as a significant channel.
Key Growth Drivers:
- Asia-Pacific: Strong tea culture, large population, rising disposable incomes.
- North America: Increasing health consciousness, demand for functional beverages.
- Europe: Growing preference for natural and organic products.
Ready-to-Drink Tea Market Product Analysis
Product innovation focuses on enhancing taste, functionality, and convenience. Advancements in packaging technologies, such as shelf-stable aseptic packaging, extend product shelf life and improve product quality. Formulations with added vitamins, minerals, or probiotics are gaining popularity, appealing to consumers seeking healthier beverage options. The market sees a trend towards organic and sustainably sourced tea leaves, appealing to environmentally conscious consumers. Competitive advantages stem from unique flavor profiles, convenient packaging, and strong brand recognition.
Key Drivers, Barriers & Challenges in Ready-to-Drink Tea Market
Key Drivers:
- Growing health consciousness drives demand for healthier beverage options.
- Expanding distribution networks enhance market access and convenience.
- Technological advancements improve product quality and shelf life.
Challenges and Restraints:
- Intense competition from established players and new entrants exerts pressure on profit margins.
- Fluctuations in raw material prices impact production costs.
- Regulatory changes concerning labeling and food safety add complexity. These factors collectively lead to an estimated xx Million USD reduction in projected revenue in 2026.
Growth Drivers in the Ready-to-Drink Tea Market Market
Health and wellness trends, increasing consumer demand for convenient beverages, and expansion of distribution channels are key drivers. Technological innovations, such as improved packaging and processing methods, boost market growth. Government support for the beverage industry and favourable regulatory environments in certain regions also positively impact the market.
Challenges Impacting Ready-to-Drink Tea Market Growth
Intense competition, fluctuating raw material prices, and evolving consumer preferences present challenges. Stringent regulatory requirements related to labeling and food safety add complexity. Supply chain disruptions can impact production and distribution, and shifting consumer taste preferences require brands to continually innovate.
Key Players Shaping the Ready-to-Drink Tea Market Market
- Ito En Ltd
- PepsiCo Inc
- Dr Pepper Snapple Group Inc
- Arizona Beverages USA
- The Coca-Cola Company
- Monster Beverage
- Nestlé SA
- Suntory Holdings Limited
- Unilever PLC
- Tata Global Beverages
Significant Ready-to-Drink Tea Market Industry Milestones
- 2022: Ito En Ltd launched a new line of ready-to-drink green teas with added vitamins and minerals.
- 2023: PepsiCo Inc acquired KeVita, a leading producer of fermented probiotic tea drinks.
- 2024: Dr Pepper Snapple Group Inc launched a new line of ready-to-drink teas made with real fruit juice.
Future Outlook for Ready-to-Drink Tea Market Market
The RTD tea market is poised for continued growth, driven by sustained demand for healthy beverages, product innovation, and expanding distribution channels. Opportunities exist in premiumization, functionalization, and sustainable packaging. Strategic partnerships and mergers & acquisitions will continue to reshape the market landscape, leading to further consolidation and innovation. The market is expected to reach xx Million USD by 2033, presenting significant potential for both established players and new entrants.
Ready-to-Drink Tea Market Segmentation
-
1. Type
- 1.1. Green Tea
- 1.2. Herbal Tea
- 1.3. Others
-
2. Distribution Channel
- 2.1. Supermarket/Hypermarket
- 2.2. Convenience Stores
- 2.3. Online Stores
- 2.4. Others
-
3. Geography
- 3.1. Brazil
- 3.2. Argentina
- 3.3. Rest of South America
Ready-to-Drink Tea Market Segmentation By Geography
- 1. Brazil
- 2. Argentina
- 3. Rest of South America
Ready-to-Drink Tea Market REPORT HIGHLIGHTS
| Aspects | Details |
|---|---|
| Study Period | 2019-2033 |
| Base Year | 2024 |
| Estimated Year | 2025 |
| Forecast Period | 2025-2033 |
| Historical Period | 2019-2024 |
| Growth Rate | CAGR of 3.80% from 2019-2033 |
| Segmentation |
|
Table of Contents
- 1. Introduction
- 1.1. Research Scope
- 1.2. Market Segmentation
- 1.3. Research Methodology
- 1.4. Definitions and Assumptions
- 2. Executive Summary
- 2.1. Introduction
- 3. Market Dynamics
- 3.1. Introduction
- 3.2. Market Drivers
- 3.2.1. Increasing demand for meat alternatives
- 3.3. Market Restrains
- 3.3.1. Presence of numerous alternatives in the plant proteins
- 3.4. Market Trends
- 3.4.1. Supermarket/ Hypermarket is the Most Preferred Sales Channel
- 4. Market Factor Analysis
- 4.1. Porters Five Forces
- 4.2. Supply/Value Chain
- 4.3. PESTEL analysis
- 4.4. Market Entropy
- 4.5. Patent/Trademark Analysis
- 5. Global Ready-to-Drink Tea Market Analysis, Insights and Forecast, 2019-2031
- 5.1. Market Analysis, Insights and Forecast - by Type
- 5.1.1. Green Tea
- 5.1.2. Herbal Tea
- 5.1.3. Others
- 5.2. Market Analysis, Insights and Forecast - by Distribution Channel
- 5.2.1. Supermarket/Hypermarket
- 5.2.2. Convenience Stores
- 5.2.3. Online Stores
- 5.2.4. Others
- 5.3. Market Analysis, Insights and Forecast - by Geography
- 5.3.1. Brazil
- 5.3.2. Argentina
- 5.3.3. Rest of South America
- 5.4. Market Analysis, Insights and Forecast - by Region
- 5.4.1. Brazil
- 5.4.2. Argentina
- 5.4.3. Rest of South America
- 5.1. Market Analysis, Insights and Forecast - by Type
- 6. Brazil Ready-to-Drink Tea Market Analysis, Insights and Forecast, 2019-2031
- 6.1. Market Analysis, Insights and Forecast - by Type
- 6.1.1. Green Tea
- 6.1.2. Herbal Tea
- 6.1.3. Others
- 6.2. Market Analysis, Insights and Forecast - by Distribution Channel
- 6.2.1. Supermarket/Hypermarket
- 6.2.2. Convenience Stores
- 6.2.3. Online Stores
- 6.2.4. Others
- 6.3. Market Analysis, Insights and Forecast - by Geography
- 6.3.1. Brazil
- 6.3.2. Argentina
- 6.3.3. Rest of South America
- 6.1. Market Analysis, Insights and Forecast - by Type
- 7. Argentina Ready-to-Drink Tea Market Analysis, Insights and Forecast, 2019-2031
- 7.1. Market Analysis, Insights and Forecast - by Type
- 7.1.1. Green Tea
- 7.1.2. Herbal Tea
- 7.1.3. Others
- 7.2. Market Analysis, Insights and Forecast - by Distribution Channel
- 7.2.1. Supermarket/Hypermarket
- 7.2.2. Convenience Stores
- 7.2.3. Online Stores
- 7.2.4. Others
- 7.3. Market Analysis, Insights and Forecast - by Geography
- 7.3.1. Brazil
- 7.3.2. Argentina
- 7.3.3. Rest of South America
- 7.1. Market Analysis, Insights and Forecast - by Type
- 8. Rest of South America Ready-to-Drink Tea Market Analysis, Insights and Forecast, 2019-2031
- 8.1. Market Analysis, Insights and Forecast - by Type
- 8.1.1. Green Tea
- 8.1.2. Herbal Tea
- 8.1.3. Others
- 8.2. Market Analysis, Insights and Forecast - by Distribution Channel
- 8.2.1. Supermarket/Hypermarket
- 8.2.2. Convenience Stores
- 8.2.3. Online Stores
- 8.2.4. Others
- 8.3. Market Analysis, Insights and Forecast - by Geography
- 8.3.1. Brazil
- 8.3.2. Argentina
- 8.3.3. Rest of South America
- 8.1. Market Analysis, Insights and Forecast - by Type
- 9. North America Ready-to-Drink Tea Market Analysis, Insights and Forecast, 2019-2031
- 9.1. Market Analysis, Insights and Forecast - By Country/Sub-region
- 9.1.1 United States
- 9.1.2 Canada
- 9.1.3 Mexico
- 10. Europe Ready-to-Drink Tea Market Analysis, Insights and Forecast, 2019-2031
- 10.1. Market Analysis, Insights and Forecast - By Country/Sub-region
- 10.1.1 Germany
- 10.1.2 United Kingdom
- 10.1.3 France
- 10.1.4 Spain
- 10.1.5 Italy
- 10.1.6 Spain
- 10.1.7 Belgium
- 10.1.8 Netherland
- 10.1.9 Nordics
- 10.1.10 Rest of Europe
- 11. Asia Pacific Ready-to-Drink Tea Market Analysis, Insights and Forecast, 2019-2031
- 11.1. Market Analysis, Insights and Forecast - By Country/Sub-region
- 11.1.1 China
- 11.1.2 Japan
- 11.1.3 India
- 11.1.4 South Korea
- 11.1.5 Southeast Asia
- 11.1.6 Australia
- 11.1.7 Indonesia
- 11.1.8 Phillipes
- 11.1.9 Singapore
- 11.1.10 Thailandc
- 11.1.11 Rest of Asia Pacific
- 12. South America Ready-to-Drink Tea Market Analysis, Insights and Forecast, 2019-2031
- 12.1. Market Analysis, Insights and Forecast - By Country/Sub-region
- 12.1.1 Brazil
- 12.1.2 Argentina
- 12.1.3 Peru
- 12.1.4 Chile
- 12.1.5 Colombia
- 12.1.6 Ecuador
- 12.1.7 Venezuela
- 12.1.8 Rest of South America
- 13. North America Ready-to-Drink Tea Market Analysis, Insights and Forecast, 2019-2031
- 13.1. Market Analysis, Insights and Forecast - By Country/Sub-region
- 13.1.1 United States
- 13.1.2 Canada
- 13.1.3 Mexico
- 14. MEA Ready-to-Drink Tea Market Analysis, Insights and Forecast, 2019-2031
- 14.1. Market Analysis, Insights and Forecast - By Country/Sub-region
- 14.1.1 United Arab Emirates
- 14.1.2 Saudi Arabia
- 14.1.3 South Africa
- 14.1.4 Rest of Middle East and Africa
- 15. Competitive Analysis
- 15.1. Global Market Share Analysis 2024
- 15.2. Company Profiles
- 15.2.1 Ito En Ltd
- 15.2.1.1. Overview
- 15.2.1.2. Products
- 15.2.1.3. SWOT Analysis
- 15.2.1.4. Recent Developments
- 15.2.1.5. Financials (Based on Availability)
- 15.2.2 PepsiCo Inc
- 15.2.2.1. Overview
- 15.2.2.2. Products
- 15.2.2.3. SWOT Analysis
- 15.2.2.4. Recent Developments
- 15.2.2.5. Financials (Based on Availability)
- 15.2.3 Dr Pepper Snapple Group Inc
- 15.2.3.1. Overview
- 15.2.3.2. Products
- 15.2.3.3. SWOT Analysis
- 15.2.3.4. Recent Developments
- 15.2.3.5. Financials (Based on Availability)
- 15.2.4 Arizona Beverages USA
- 15.2.4.1. Overview
- 15.2.4.2. Products
- 15.2.4.3. SWOT Analysis
- 15.2.4.4. Recent Developments
- 15.2.4.5. Financials (Based on Availability)
- 15.2.5 The Coca-Cola Company
- 15.2.5.1. Overview
- 15.2.5.2. Products
- 15.2.5.3. SWOT Analysis
- 15.2.5.4. Recent Developments
- 15.2.5.5. Financials (Based on Availability)
- 15.2.6 Monster Beverage*List Not Exhaustive
- 15.2.6.1. Overview
- 15.2.6.2. Products
- 15.2.6.3. SWOT Analysis
- 15.2.6.4. Recent Developments
- 15.2.6.5. Financials (Based on Availability)
- 15.2.7 Nestlé SA
- 15.2.7.1. Overview
- 15.2.7.2. Products
- 15.2.7.3. SWOT Analysis
- 15.2.7.4. Recent Developments
- 15.2.7.5. Financials (Based on Availability)
- 15.2.8 Suntory Holdings Limited
- 15.2.8.1. Overview
- 15.2.8.2. Products
- 15.2.8.3. SWOT Analysis
- 15.2.8.4. Recent Developments
- 15.2.8.5. Financials (Based on Availability)
- 15.2.9 Unilever PLC
- 15.2.9.1. Overview
- 15.2.9.2. Products
- 15.2.9.3. SWOT Analysis
- 15.2.9.4. Recent Developments
- 15.2.9.5. Financials (Based on Availability)
- 15.2.10 Tata Global Beverages
- 15.2.10.1. Overview
- 15.2.10.2. Products
- 15.2.10.3. SWOT Analysis
- 15.2.10.4. Recent Developments
- 15.2.10.5. Financials (Based on Availability)
- 15.2.1 Ito En Ltd
List of Figures
- Figure 1: Global Ready-to-Drink Tea Market Revenue Breakdown (Million, %) by Region 2024 & 2032
- Figure 2: Global Ready-to-Drink Tea Market Volume Breakdown (K Tons, %) by Region 2024 & 2032
- Figure 3: North America Ready-to-Drink Tea Market Revenue (Million), by Country 2024 & 2032
- Figure 4: North America Ready-to-Drink Tea Market Volume (K Tons), by Country 2024 & 2032
- Figure 5: North America Ready-to-Drink Tea Market Revenue Share (%), by Country 2024 & 2032
- Figure 6: North America Ready-to-Drink Tea Market Volume Share (%), by Country 2024 & 2032
- Figure 7: Europe Ready-to-Drink Tea Market Revenue (Million), by Country 2024 & 2032
- Figure 8: Europe Ready-to-Drink Tea Market Volume (K Tons), by Country 2024 & 2032
- Figure 9: Europe Ready-to-Drink Tea Market Revenue Share (%), by Country 2024 & 2032
- Figure 10: Europe Ready-to-Drink Tea Market Volume Share (%), by Country 2024 & 2032
- Figure 11: Asia Pacific Ready-to-Drink Tea Market Revenue (Million), by Country 2024 & 2032
- Figure 12: Asia Pacific Ready-to-Drink Tea Market Volume (K Tons), by Country 2024 & 2032
- Figure 13: Asia Pacific Ready-to-Drink Tea Market Revenue Share (%), by Country 2024 & 2032
- Figure 14: Asia Pacific Ready-to-Drink Tea Market Volume Share (%), by Country 2024 & 2032
- Figure 15: South America Ready-to-Drink Tea Market Revenue (Million), by Country 2024 & 2032
- Figure 16: South America Ready-to-Drink Tea Market Volume (K Tons), by Country 2024 & 2032
- Figure 17: South America Ready-to-Drink Tea Market Revenue Share (%), by Country 2024 & 2032
- Figure 18: South America Ready-to-Drink Tea Market Volume Share (%), by Country 2024 & 2032
- Figure 19: North America Ready-to-Drink Tea Market Revenue (Million), by Country 2024 & 2032
- Figure 20: North America Ready-to-Drink Tea Market Volume (K Tons), by Country 2024 & 2032
- Figure 21: North America Ready-to-Drink Tea Market Revenue Share (%), by Country 2024 & 2032
- Figure 22: North America Ready-to-Drink Tea Market Volume Share (%), by Country 2024 & 2032
- Figure 23: MEA Ready-to-Drink Tea Market Revenue (Million), by Country 2024 & 2032
- Figure 24: MEA Ready-to-Drink Tea Market Volume (K Tons), by Country 2024 & 2032
- Figure 25: MEA Ready-to-Drink Tea Market Revenue Share (%), by Country 2024 & 2032
- Figure 26: MEA Ready-to-Drink Tea Market Volume Share (%), by Country 2024 & 2032
- Figure 27: Brazil Ready-to-Drink Tea Market Revenue (Million), by Type 2024 & 2032
- Figure 28: Brazil Ready-to-Drink Tea Market Volume (K Tons), by Type 2024 & 2032
- Figure 29: Brazil Ready-to-Drink Tea Market Revenue Share (%), by Type 2024 & 2032
- Figure 30: Brazil Ready-to-Drink Tea Market Volume Share (%), by Type 2024 & 2032
- Figure 31: Brazil Ready-to-Drink Tea Market Revenue (Million), by Distribution Channel 2024 & 2032
- Figure 32: Brazil Ready-to-Drink Tea Market Volume (K Tons), by Distribution Channel 2024 & 2032
- Figure 33: Brazil Ready-to-Drink Tea Market Revenue Share (%), by Distribution Channel 2024 & 2032
- Figure 34: Brazil Ready-to-Drink Tea Market Volume Share (%), by Distribution Channel 2024 & 2032
- Figure 35: Brazil Ready-to-Drink Tea Market Revenue (Million), by Geography 2024 & 2032
- Figure 36: Brazil Ready-to-Drink Tea Market Volume (K Tons), by Geography 2024 & 2032
- Figure 37: Brazil Ready-to-Drink Tea Market Revenue Share (%), by Geography 2024 & 2032
- Figure 38: Brazil Ready-to-Drink Tea Market Volume Share (%), by Geography 2024 & 2032
- Figure 39: Brazil Ready-to-Drink Tea Market Revenue (Million), by Country 2024 & 2032
- Figure 40: Brazil Ready-to-Drink Tea Market Volume (K Tons), by Country 2024 & 2032
- Figure 41: Brazil Ready-to-Drink Tea Market Revenue Share (%), by Country 2024 & 2032
- Figure 42: Brazil Ready-to-Drink Tea Market Volume Share (%), by Country 2024 & 2032
- Figure 43: Argentina Ready-to-Drink Tea Market Revenue (Million), by Type 2024 & 2032
- Figure 44: Argentina Ready-to-Drink Tea Market Volume (K Tons), by Type 2024 & 2032
- Figure 45: Argentina Ready-to-Drink Tea Market Revenue Share (%), by Type 2024 & 2032
- Figure 46: Argentina Ready-to-Drink Tea Market Volume Share (%), by Type 2024 & 2032
- Figure 47: Argentina Ready-to-Drink Tea Market Revenue (Million), by Distribution Channel 2024 & 2032
- Figure 48: Argentina Ready-to-Drink Tea Market Volume (K Tons), by Distribution Channel 2024 & 2032
- Figure 49: Argentina Ready-to-Drink Tea Market Revenue Share (%), by Distribution Channel 2024 & 2032
- Figure 50: Argentina Ready-to-Drink Tea Market Volume Share (%), by Distribution Channel 2024 & 2032
- Figure 51: Argentina Ready-to-Drink Tea Market Revenue (Million), by Geography 2024 & 2032
- Figure 52: Argentina Ready-to-Drink Tea Market Volume (K Tons), by Geography 2024 & 2032
- Figure 53: Argentina Ready-to-Drink Tea Market Revenue Share (%), by Geography 2024 & 2032
- Figure 54: Argentina Ready-to-Drink Tea Market Volume Share (%), by Geography 2024 & 2032
- Figure 55: Argentina Ready-to-Drink Tea Market Revenue (Million), by Country 2024 & 2032
- Figure 56: Argentina Ready-to-Drink Tea Market Volume (K Tons), by Country 2024 & 2032
- Figure 57: Argentina Ready-to-Drink Tea Market Revenue Share (%), by Country 2024 & 2032
- Figure 58: Argentina Ready-to-Drink Tea Market Volume Share (%), by Country 2024 & 2032
- Figure 59: Rest of South America Ready-to-Drink Tea Market Revenue (Million), by Type 2024 & 2032
- Figure 60: Rest of South America Ready-to-Drink Tea Market Volume (K Tons), by Type 2024 & 2032
- Figure 61: Rest of South America Ready-to-Drink Tea Market Revenue Share (%), by Type 2024 & 2032
- Figure 62: Rest of South America Ready-to-Drink Tea Market Volume Share (%), by Type 2024 & 2032
- Figure 63: Rest of South America Ready-to-Drink Tea Market Revenue (Million), by Distribution Channel 2024 & 2032
- Figure 64: Rest of South America Ready-to-Drink Tea Market Volume (K Tons), by Distribution Channel 2024 & 2032
- Figure 65: Rest of South America Ready-to-Drink Tea Market Revenue Share (%), by Distribution Channel 2024 & 2032
- Figure 66: Rest of South America Ready-to-Drink Tea Market Volume Share (%), by Distribution Channel 2024 & 2032
- Figure 67: Rest of South America Ready-to-Drink Tea Market Revenue (Million), by Geography 2024 & 2032
- Figure 68: Rest of South America Ready-to-Drink Tea Market Volume (K Tons), by Geography 2024 & 2032
- Figure 69: Rest of South America Ready-to-Drink Tea Market Revenue Share (%), by Geography 2024 & 2032
- Figure 70: Rest of South America Ready-to-Drink Tea Market Volume Share (%), by Geography 2024 & 2032
- Figure 71: Rest of South America Ready-to-Drink Tea Market Revenue (Million), by Country 2024 & 2032
- Figure 72: Rest of South America Ready-to-Drink Tea Market Volume (K Tons), by Country 2024 & 2032
- Figure 73: Rest of South America Ready-to-Drink Tea Market Revenue Share (%), by Country 2024 & 2032
- Figure 74: Rest of South America Ready-to-Drink Tea Market Volume Share (%), by Country 2024 & 2032
List of Tables
- Table 1: Global Ready-to-Drink Tea Market Revenue Million Forecast, by Region 2019 & 2032
- Table 2: Global Ready-to-Drink Tea Market Volume K Tons Forecast, by Region 2019 & 2032
- Table 3: Global Ready-to-Drink Tea Market Revenue Million Forecast, by Type 2019 & 2032
- Table 4: Global Ready-to-Drink Tea Market Volume K Tons Forecast, by Type 2019 & 2032
- Table 5: Global Ready-to-Drink Tea Market Revenue Million Forecast, by Distribution Channel 2019 & 2032
- Table 6: Global Ready-to-Drink Tea Market Volume K Tons Forecast, by Distribution Channel 2019 & 2032
- Table 7: Global Ready-to-Drink Tea Market Revenue Million Forecast, by Geography 2019 & 2032
- Table 8: Global Ready-to-Drink Tea Market Volume K Tons Forecast, by Geography 2019 & 2032
- Table 9: Global Ready-to-Drink Tea Market Revenue Million Forecast, by Region 2019 & 2032
- Table 10: Global Ready-to-Drink Tea Market Volume K Tons Forecast, by Region 2019 & 2032
- Table 11: Global Ready-to-Drink Tea Market Revenue Million Forecast, by Country 2019 & 2032
- Table 12: Global Ready-to-Drink Tea Market Volume K Tons Forecast, by Country 2019 & 2032
- Table 13: United States Ready-to-Drink Tea Market Revenue (Million) Forecast, by Application 2019 & 2032
- Table 14: United States Ready-to-Drink Tea Market Volume (K Tons) Forecast, by Application 2019 & 2032
- Table 15: Canada Ready-to-Drink Tea Market Revenue (Million) Forecast, by Application 2019 & 2032
- Table 16: Canada Ready-to-Drink Tea Market Volume (K Tons) Forecast, by Application 2019 & 2032
- Table 17: Mexico Ready-to-Drink Tea Market Revenue (Million) Forecast, by Application 2019 & 2032
- Table 18: Mexico Ready-to-Drink Tea Market Volume (K Tons) Forecast, by Application 2019 & 2032
- Table 19: Global Ready-to-Drink Tea Market Revenue Million Forecast, by Country 2019 & 2032
- Table 20: Global Ready-to-Drink Tea Market Volume K Tons Forecast, by Country 2019 & 2032
- Table 21: Germany Ready-to-Drink Tea Market Revenue (Million) Forecast, by Application 2019 & 2032
- Table 22: Germany Ready-to-Drink Tea Market Volume (K Tons) Forecast, by Application 2019 & 2032
- Table 23: United Kingdom Ready-to-Drink Tea Market Revenue (Million) Forecast, by Application 2019 & 2032
- Table 24: United Kingdom Ready-to-Drink Tea Market Volume (K Tons) Forecast, by Application 2019 & 2032
- Table 25: France Ready-to-Drink Tea Market Revenue (Million) Forecast, by Application 2019 & 2032
- Table 26: France Ready-to-Drink Tea Market Volume (K Tons) Forecast, by Application 2019 & 2032
- Table 27: Spain Ready-to-Drink Tea Market Revenue (Million) Forecast, by Application 2019 & 2032
- Table 28: Spain Ready-to-Drink Tea Market Volume (K Tons) Forecast, by Application 2019 & 2032
- Table 29: Italy Ready-to-Drink Tea Market Revenue (Million) Forecast, by Application 2019 & 2032
- Table 30: Italy Ready-to-Drink Tea Market Volume (K Tons) Forecast, by Application 2019 & 2032
- Table 31: Spain Ready-to-Drink Tea Market Revenue (Million) Forecast, by Application 2019 & 2032
- Table 32: Spain Ready-to-Drink Tea Market Volume (K Tons) Forecast, by Application 2019 & 2032
- Table 33: Belgium Ready-to-Drink Tea Market Revenue (Million) Forecast, by Application 2019 & 2032
- Table 34: Belgium Ready-to-Drink Tea Market Volume (K Tons) Forecast, by Application 2019 & 2032
- Table 35: Netherland Ready-to-Drink Tea Market Revenue (Million) Forecast, by Application 2019 & 2032
- Table 36: Netherland Ready-to-Drink Tea Market Volume (K Tons) Forecast, by Application 2019 & 2032
- Table 37: Nordics Ready-to-Drink Tea Market Revenue (Million) Forecast, by Application 2019 & 2032
- Table 38: Nordics Ready-to-Drink Tea Market Volume (K Tons) Forecast, by Application 2019 & 2032
- Table 39: Rest of Europe Ready-to-Drink Tea Market Revenue (Million) Forecast, by Application 2019 & 2032
- Table 40: Rest of Europe Ready-to-Drink Tea Market Volume (K Tons) Forecast, by Application 2019 & 2032
- Table 41: Global Ready-to-Drink Tea Market Revenue Million Forecast, by Country 2019 & 2032
- Table 42: Global Ready-to-Drink Tea Market Volume K Tons Forecast, by Country 2019 & 2032
- Table 43: China Ready-to-Drink Tea Market Revenue (Million) Forecast, by Application 2019 & 2032
- Table 44: China Ready-to-Drink Tea Market Volume (K Tons) Forecast, by Application 2019 & 2032
- Table 45: Japan Ready-to-Drink Tea Market Revenue (Million) Forecast, by Application 2019 & 2032
- Table 46: Japan Ready-to-Drink Tea Market Volume (K Tons) Forecast, by Application 2019 & 2032
- Table 47: India Ready-to-Drink Tea Market Revenue (Million) Forecast, by Application 2019 & 2032
- Table 48: India Ready-to-Drink Tea Market Volume (K Tons) Forecast, by Application 2019 & 2032
- Table 49: South Korea Ready-to-Drink Tea Market Revenue (Million) Forecast, by Application 2019 & 2032
- Table 50: South Korea Ready-to-Drink Tea Market Volume (K Tons) Forecast, by Application 2019 & 2032
- Table 51: Southeast Asia Ready-to-Drink Tea Market Revenue (Million) Forecast, by Application 2019 & 2032
- Table 52: Southeast Asia Ready-to-Drink Tea Market Volume (K Tons) Forecast, by Application 2019 & 2032
- Table 53: Australia Ready-to-Drink Tea Market Revenue (Million) Forecast, by Application 2019 & 2032
- Table 54: Australia Ready-to-Drink Tea Market Volume (K Tons) Forecast, by Application 2019 & 2032
- Table 55: Indonesia Ready-to-Drink Tea Market Revenue (Million) Forecast, by Application 2019 & 2032
- Table 56: Indonesia Ready-to-Drink Tea Market Volume (K Tons) Forecast, by Application 2019 & 2032
- Table 57: Phillipes Ready-to-Drink Tea Market Revenue (Million) Forecast, by Application 2019 & 2032
- Table 58: Phillipes Ready-to-Drink Tea Market Volume (K Tons) Forecast, by Application 2019 & 2032
- Table 59: Singapore Ready-to-Drink Tea Market Revenue (Million) Forecast, by Application 2019 & 2032
- Table 60: Singapore Ready-to-Drink Tea Market Volume (K Tons) Forecast, by Application 2019 & 2032
- Table 61: Thailandc Ready-to-Drink Tea Market Revenue (Million) Forecast, by Application 2019 & 2032
- Table 62: Thailandc Ready-to-Drink Tea Market Volume (K Tons) Forecast, by Application 2019 & 2032
- Table 63: Rest of Asia Pacific Ready-to-Drink Tea Market Revenue (Million) Forecast, by Application 2019 & 2032
- Table 64: Rest of Asia Pacific Ready-to-Drink Tea Market Volume (K Tons) Forecast, by Application 2019 & 2032
- Table 65: Global Ready-to-Drink Tea Market Revenue Million Forecast, by Country 2019 & 2032
- Table 66: Global Ready-to-Drink Tea Market Volume K Tons Forecast, by Country 2019 & 2032
- Table 67: Brazil Ready-to-Drink Tea Market Revenue (Million) Forecast, by Application 2019 & 2032
- Table 68: Brazil Ready-to-Drink Tea Market Volume (K Tons) Forecast, by Application 2019 & 2032
- Table 69: Argentina Ready-to-Drink Tea Market Revenue (Million) Forecast, by Application 2019 & 2032
- Table 70: Argentina Ready-to-Drink Tea Market Volume (K Tons) Forecast, by Application 2019 & 2032
- Table 71: Peru Ready-to-Drink Tea Market Revenue (Million) Forecast, by Application 2019 & 2032
- Table 72: Peru Ready-to-Drink Tea Market Volume (K Tons) Forecast, by Application 2019 & 2032
- Table 73: Chile Ready-to-Drink Tea Market Revenue (Million) Forecast, by Application 2019 & 2032
- Table 74: Chile Ready-to-Drink Tea Market Volume (K Tons) Forecast, by Application 2019 & 2032
- Table 75: Colombia Ready-to-Drink Tea Market Revenue (Million) Forecast, by Application 2019 & 2032
- Table 76: Colombia Ready-to-Drink Tea Market Volume (K Tons) Forecast, by Application 2019 & 2032
- Table 77: Ecuador Ready-to-Drink Tea Market Revenue (Million) Forecast, by Application 2019 & 2032
- Table 78: Ecuador Ready-to-Drink Tea Market Volume (K Tons) Forecast, by Application 2019 & 2032
- Table 79: Venezuela Ready-to-Drink Tea Market Revenue (Million) Forecast, by Application 2019 & 2032
- Table 80: Venezuela Ready-to-Drink Tea Market Volume (K Tons) Forecast, by Application 2019 & 2032
- Table 81: Rest of South America Ready-to-Drink Tea Market Revenue (Million) Forecast, by Application 2019 & 2032
- Table 82: Rest of South America Ready-to-Drink Tea Market Volume (K Tons) Forecast, by Application 2019 & 2032
- Table 83: Global Ready-to-Drink Tea Market Revenue Million Forecast, by Country 2019 & 2032
- Table 84: Global Ready-to-Drink Tea Market Volume K Tons Forecast, by Country 2019 & 2032
- Table 85: United States Ready-to-Drink Tea Market Revenue (Million) Forecast, by Application 2019 & 2032
- Table 86: United States Ready-to-Drink Tea Market Volume (K Tons) Forecast, by Application 2019 & 2032
- Table 87: Canada Ready-to-Drink Tea Market Revenue (Million) Forecast, by Application 2019 & 2032
- Table 88: Canada Ready-to-Drink Tea Market Volume (K Tons) Forecast, by Application 2019 & 2032
- Table 89: Mexico Ready-to-Drink Tea Market Revenue (Million) Forecast, by Application 2019 & 2032
- Table 90: Mexico Ready-to-Drink Tea Market Volume (K Tons) Forecast, by Application 2019 & 2032
- Table 91: Global Ready-to-Drink Tea Market Revenue Million Forecast, by Country 2019 & 2032
- Table 92: Global Ready-to-Drink Tea Market Volume K Tons Forecast, by Country 2019 & 2032
- Table 93: United Arab Emirates Ready-to-Drink Tea Market Revenue (Million) Forecast, by Application 2019 & 2032
- Table 94: United Arab Emirates Ready-to-Drink Tea Market Volume (K Tons) Forecast, by Application 2019 & 2032
- Table 95: Saudi Arabia Ready-to-Drink Tea Market Revenue (Million) Forecast, by Application 2019 & 2032
- Table 96: Saudi Arabia Ready-to-Drink Tea Market Volume (K Tons) Forecast, by Application 2019 & 2032
- Table 97: South Africa Ready-to-Drink Tea Market Revenue (Million) Forecast, by Application 2019 & 2032
- Table 98: South Africa Ready-to-Drink Tea Market Volume (K Tons) Forecast, by Application 2019 & 2032
- Table 99: Rest of Middle East and Africa Ready-to-Drink Tea Market Revenue (Million) Forecast, by Application 2019 & 2032
- Table 100: Rest of Middle East and Africa Ready-to-Drink Tea Market Volume (K Tons) Forecast, by Application 2019 & 2032
- Table 101: Global Ready-to-Drink Tea Market Revenue Million Forecast, by Type 2019 & 2032
- Table 102: Global Ready-to-Drink Tea Market Volume K Tons Forecast, by Type 2019 & 2032
- Table 103: Global Ready-to-Drink Tea Market Revenue Million Forecast, by Distribution Channel 2019 & 2032
- Table 104: Global Ready-to-Drink Tea Market Volume K Tons Forecast, by Distribution Channel 2019 & 2032
- Table 105: Global Ready-to-Drink Tea Market Revenue Million Forecast, by Geography 2019 & 2032
- Table 106: Global Ready-to-Drink Tea Market Volume K Tons Forecast, by Geography 2019 & 2032
- Table 107: Global Ready-to-Drink Tea Market Revenue Million Forecast, by Country 2019 & 2032
- Table 108: Global Ready-to-Drink Tea Market Volume K Tons Forecast, by Country 2019 & 2032
- Table 109: Global Ready-to-Drink Tea Market Revenue Million Forecast, by Type 2019 & 2032
- Table 110: Global Ready-to-Drink Tea Market Volume K Tons Forecast, by Type 2019 & 2032
- Table 111: Global Ready-to-Drink Tea Market Revenue Million Forecast, by Distribution Channel 2019 & 2032
- Table 112: Global Ready-to-Drink Tea Market Volume K Tons Forecast, by Distribution Channel 2019 & 2032
- Table 113: Global Ready-to-Drink Tea Market Revenue Million Forecast, by Geography 2019 & 2032
- Table 114: Global Ready-to-Drink Tea Market Volume K Tons Forecast, by Geography 2019 & 2032
- Table 115: Global Ready-to-Drink Tea Market Revenue Million Forecast, by Country 2019 & 2032
- Table 116: Global Ready-to-Drink Tea Market Volume K Tons Forecast, by Country 2019 & 2032
- Table 117: Global Ready-to-Drink Tea Market Revenue Million Forecast, by Type 2019 & 2032
- Table 118: Global Ready-to-Drink Tea Market Volume K Tons Forecast, by Type 2019 & 2032
- Table 119: Global Ready-to-Drink Tea Market Revenue Million Forecast, by Distribution Channel 2019 & 2032
- Table 120: Global Ready-to-Drink Tea Market Volume K Tons Forecast, by Distribution Channel 2019 & 2032
- Table 121: Global Ready-to-Drink Tea Market Revenue Million Forecast, by Geography 2019 & 2032
- Table 122: Global Ready-to-Drink Tea Market Volume K Tons Forecast, by Geography 2019 & 2032
- Table 123: Global Ready-to-Drink Tea Market Revenue Million Forecast, by Country 2019 & 2032
- Table 124: Global Ready-to-Drink Tea Market Volume K Tons Forecast, by Country 2019 & 2032
Frequently Asked Questions
1. What is the projected Compound Annual Growth Rate (CAGR) of the Ready-to-Drink Tea Market?
The projected CAGR is approximately 3.80%.
2. Which companies are prominent players in the Ready-to-Drink Tea Market?
Key companies in the market include Ito En Ltd, PepsiCo Inc, Dr Pepper Snapple Group Inc, Arizona Beverages USA, The Coca-Cola Company, Monster Beverage*List Not Exhaustive, Nestlé SA , Suntory Holdings Limited , Unilever PLC , Tata Global Beverages.
3. What are the main segments of the Ready-to-Drink Tea Market?
The market segments include Type, Distribution Channel, Geography.
4. Can you provide details about the market size?
The market size is estimated to be USD 34070 Million as of 2022.
5. What are some drivers contributing to market growth?
Increasing demand for meat alternatives.
6. What are the notable trends driving market growth?
Supermarket/ Hypermarket is the Most Preferred Sales Channel.
7. Are there any restraints impacting market growth?
Presence of numerous alternatives in the plant proteins.
8. Can you provide examples of recent developments in the market?
In 2022, Ito En Ltd launched a new line of ready-to-drink green teas with added vitamins and minerals.
9. What pricing options are available for accessing the report?
Pricing options include single-user, multi-user, and enterprise licenses priced at USD 4750, USD 5250, and USD 8750 respectively.
10. Is the market size provided in terms of value or volume?
The market size is provided in terms of value, measured in Million and volume, measured in K Tons.
11. Are there any specific market keywords associated with the report?
Yes, the market keyword associated with the report is "Ready-to-Drink Tea Market," which aids in identifying and referencing the specific market segment covered.
12. How do I determine which pricing option suits my needs best?
The pricing options vary based on user requirements and access needs. Individual users may opt for single-user licenses, while businesses requiring broader access may choose multi-user or enterprise licenses for cost-effective access to the report.
13. Are there any additional resources or data provided in the Ready-to-Drink Tea Market report?
While the report offers comprehensive insights, it's advisable to review the specific contents or supplementary materials provided to ascertain if additional resources or data are available.
14. How can I stay updated on further developments or reports in the Ready-to-Drink Tea Market?
To stay informed about further developments, trends, and reports in the Ready-to-Drink Tea Market, consider subscribing to industry newsletters, following relevant companies and organizations, or regularly checking reputable industry news sources and publications.
Methodology
Step 1 - Identification of Relevant Samples Size from Population Database


Step 2 - Approaches for Defining Global Market Size (Value, Volume* & Price*)

Note*: In applicable scenarios
Step 3 - Data Sources
Primary Research
- Web Analytics
- Survey Reports
- Research Institute
- Latest Research Reports
- Opinion Leaders
Secondary Research
- Annual Reports
- White Paper
- Latest Press Release
- Industry Association
- Paid Database
- Investor Presentations

Step 4 - Data Triangulation
Involves using different sources of information in order to increase the validity of a study
These sources are likely to be stakeholders in a program - participants, other researchers, program staff, other community members, and so on.
Then we put all data in single framework & apply various statistical tools to find out the dynamic on the market.
During the analysis stage, feedback from the stakeholder groups would be compared to determine areas of agreement as well as areas of divergence
