

Key Insights
The US energy drink market is poised for significant expansion from 2025 to 2033. The market size is estimated at $50.33 billion in the base year 2025, with a projected Compound Annual Growth Rate (CAGR) of 2.33%. This growth is fueled by increasing demand from young adults and professionals seeking convenient energy solutions. Emerging health-conscious trends, particularly the rise of natural, organic, sugar-free, and low-calorie options, are key market drivers. Energy shots also contribute significantly by offering rapid energy delivery. However, growing concerns about sugar and caffeine intake present a challenge, prompting manufacturers to focus on healthier formulations and transparent labeling. Intense competition among established brands like Red Bull and Monster Beverage, alongside innovative niche players, defines the market's dynamic landscape. Both on-trade and off-trade distribution channels, as well as expanding e-commerce, are crucial for market reach and growth.
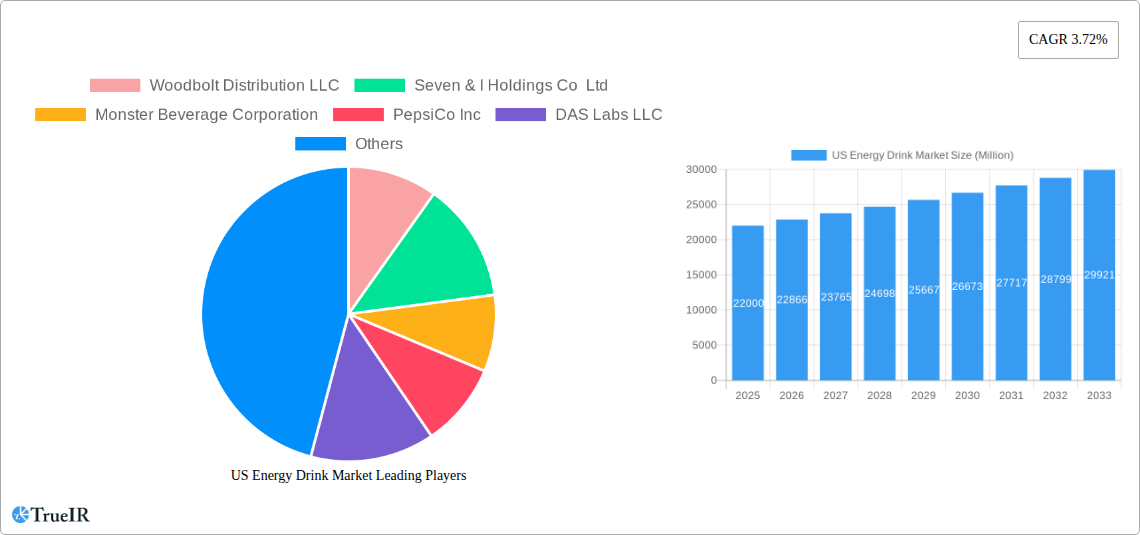
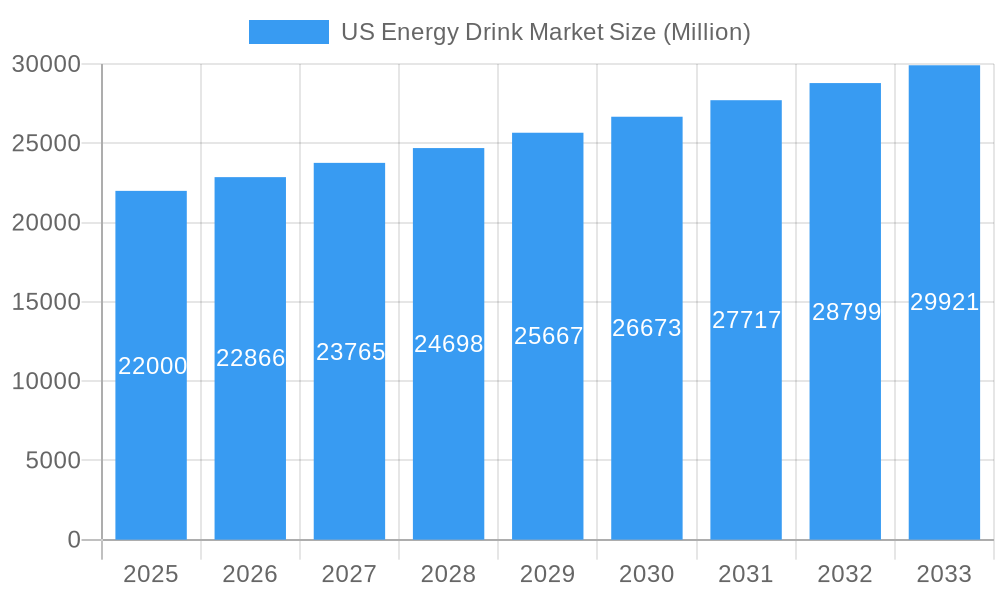
US Energy Drink Market Market Size (In Billion)
By 2033, the US energy drink market is expected to continue its upward trajectory, though potentially at a more measured pace due to market saturation and increased regulatory attention. Ongoing innovation in flavors, functional ingredients, and packaging will sustain growth. Market success will depend on companies' adaptability to consumer preferences, effective management of health concerns, and robust distribution strategies. Market segmentation across packaging types (glass bottles, metal cans, PET bottles), distribution channels (on-trade, off-trade), and product categories remains a critical factor for strategic planning. The US market offers substantial opportunities for companies that can effectively address evolving consumer needs.
US Energy Drink Market Company Market Share
US Energy Drink Market Report: 2019-2033
This comprehensive report provides a detailed analysis of the US energy drink market, offering invaluable insights for industry stakeholders. Covering the period from 2019 to 2033, with a focus on 2025, this report examines market size, segment performance, competitive dynamics, and future growth potential. It leverages extensive data analysis and expert insights to provide a clear and actionable understanding of this dynamic sector.
US Energy Drink Market Market Structure & Competitive Landscape
The US energy drink market is characterized by a highly competitive landscape dominated by a few key players, alongside a growing number of smaller, niche brands. Market concentration is relatively high, with the top five companies accounting for approximately xx% of total market share in 2024 (estimated). This concentration is driven by significant brand recognition, extensive distribution networks, and substantial marketing budgets. However, ongoing innovation and the emergence of new entrants are gradually reshaping the market.
- Market Concentration: The Herfindahl-Hirschman Index (HHI) for the US energy drink market in 2024 is estimated at xx, indicating a moderately concentrated market.
- Innovation Drivers: Consumer demand for healthier, more functional energy drinks, coupled with advancements in natural ingredients and flavor profiles, are key innovation drivers.
- Regulatory Impacts: FDA regulations regarding ingredients, labeling, and marketing claims significantly influence product development and market access.
- Product Substitutes: Other functional beverages like sports drinks, coffee, and tea pose a competitive threat, especially within the low-calorie and natural/organic segments.
- End-User Segmentation: The market caters to a broad range of consumers, from athletes and fitness enthusiasts to students and professionals seeking a boost in energy and focus. Demographic trends, particularly within younger age groups, are significant factors influencing market growth.
- M&A Trends: The recent acquisition of Bang Energy by Monster Beverage Corporation demonstrates the ongoing consolidation within the sector, reflecting the strategic importance of market share expansion and brand portfolio diversification. The volume of M&A activity in the period 2019-2024 is estimated at xx deals.
US Energy Drink Market Market Trends & Opportunities
The US energy drink market is experiencing robust growth, fueled by increasing consumer demand for convenient and effective energy boosts. The market size, valued at approximately $xx Million in 2024, is projected to reach $xx Million by 2033, exhibiting a Compound Annual Growth Rate (CAGR) of xx% during the forecast period (2025-2033). This growth is attributed to several factors:
- Shifting Consumer Preferences: A growing preference for healthier options, including sugar-free and natural/organic energy drinks, is driving innovation and creating new market segments. The increasing awareness of health and wellness is significantly impacting consumer choices.
- Technological Advancements: Innovations in packaging, formulation, and production processes are enhancing product quality, shelf life, and sustainability.
- Competitive Dynamics: Intense competition among established players and new entrants is leading to increased product differentiation, improved pricing strategies, and aggressive marketing campaigns.
- Market Penetration: The market penetration rate of energy drinks is xx% in 2024, with further growth projected, particularly within underpenetrated demographics and geographical regions. Expansion into new distribution channels and retail formats contributes significantly to penetration rate growth.
Dominant Markets & Segments in US Energy Drink Market
The US energy drink market is geographically diverse, with strong growth across various regions. However, the largest market share is held by xx region. Within the segment analysis, we observe the following dominance trends:
- Packaging Type: Metal cans remain the dominant packaging type due to their established market presence, cost-effectiveness, and ease of transportation. However, PET bottles are witnessing significant growth, driven by convenience and sustainability considerations.
- Distribution Channel: Off-trade channels (convenience stores, supermarkets) dominate the market due to broad reach and accessibility. However, the on-trade channel (bars, restaurants) is gaining traction with the increasing popularity of energy drink mixes and cocktails.
- Soft Drink Type: Traditional energy drinks remain the largest segment, yet sugar-free/low-calorie and natural/organic energy drinks are experiencing exponential growth, driven by health-conscious consumer preferences.
- Key Growth Drivers: Growth is driven by factors including increasing disposable income, changing lifestyles, and the growing popularity of fitness and wellness activities. Government regulations also significantly impact segment growth and can create barriers or opportunities.
US Energy Drink Market Product Analysis
Product innovation in the US energy drink market is centered on providing functional benefits and catering to diverse consumer needs. The focus is on healthier ingredients, improved taste profiles, and functional additives to meet fitness goals and improve daily performance. This involves a shift towards natural sweeteners, herbal extracts, and vitamins. Brands are emphasizing transparency in their ingredient lists and marketing strategies, building trust with health-conscious consumers. Companies are also constantly improving packaging to enhance sustainability and convenience.
Key Drivers, Barriers & Challenges in US Energy Drink Market
Key Drivers: The primary drivers of market growth include rising disposable incomes, increasing health awareness (leading to demand for healthier options), and the growing popularity of fitness and wellness activities. Technological advancements in product formulations and packaging also contribute significantly.
Challenges: Significant challenges include intense competition, regulatory hurdles related to ingredient labeling and marketing claims, and maintaining a sustainable supply chain. Fluctuations in raw material prices and potential disruptions in distribution networks can also impact profitability. Furthermore, negative publicity associated with high sugar content and health concerns remain significant barriers.
Growth Drivers in the US Energy Drink Market Market
The US energy drink market's growth is primarily driven by increasing consumer demand for convenient energy boosts. The rising prevalence of hectic lifestyles and demanding work schedules fuel the need for quick energy fixes. Furthermore, heightened health consciousness among consumers is pushing for innovative, healthier energy drink options, with a focus on natural ingredients and reduced sugar content. These factors, coupled with robust marketing and brand building strategies, propel market expansion.
Challenges Impacting US Energy Drink Market Growth
Challenges impacting growth include stringent regulations around ingredient labeling and health claims, fluctuating commodity prices impacting production costs, and the ever-present competitive pressure from both established giants and emerging brands. Supply chain complexities, particularly relating to sourcing natural ingredients, also contribute to challenges in scaling production and maintaining consistent supply.
Key Players Shaping the US Energy Drink Market Market
- Monster Beverage Corporation
- PepsiCo Inc
- Red Bull GmbH
- The Coca-Cola Company
- Woodbolt Distribution LLC
- Seven & I Holdings Co Ltd
- DAS Labs LLC
- Living Essentials LLC
- Zevia LL
- N V E Pharmaceuticals
- Congo Brands
Significant US Energy Drink Market Industry Milestones
- July 2023: Monster Beverage Corporation acquired Bang Energy for approximately USD 362 Million, significantly altering the market landscape and expanding Monster's portfolio.
- July 2023: WWE and Nutrabolt launched a co-branded energy drink, leveraging the WWE brand's popularity to reach a wider audience and potentially boosting sales for both companies.
- July 2023: Zevia LLC explored new distribution channels to expand its reach into convenience stores, indicating a shift in distribution strategy and aiming for increased market penetration within a new segment.
Future Outlook for US Energy Drink Market Market
The future of the US energy drink market appears bright, with continued growth driven by evolving consumer preferences, innovative product development, and strategic market expansion. Opportunities exist in developing healthier, functional energy drinks catering to the growing demand for natural ingredients and low-calorie options. Strategic partnerships and acquisitions will likely continue to shape the competitive landscape, while increasing focus on sustainability in packaging and sourcing will become even more critical. The market is poised for significant expansion, with further growth predicted across all segments.
US Energy Drink Market Segmentation
-
1. Soft Drink Type
- 1.1. Energy Shots
- 1.2. Natural/Organic Energy Drinks
- 1.3. Sugar-free or Low-calories Energy Drinks
- 1.4. Traditional Energy Drinks
- 1.5. Other Energy Drinks
-
2. Packaging Type
- 2.1. Glass Bottles
- 2.2. Metal Can
- 2.3. PET Bottles
-
3. Distribution Channel
-
3.1. Off-trade
- 3.1.1. Convenience Stores
- 3.1.2. Online Retail
- 3.1.3. Supermarket/Hypermarket
- 3.1.4. Others
- 3.2. On-trade
-
3.1. Off-trade
US Energy Drink Market Segmentation By Geography
-
1. North America
- 1.1. United States
- 1.2. Canada
- 1.3. Mexico
-
2. South America
- 2.1. Brazil
- 2.2. Argentina
- 2.3. Rest of South America
-
3. Europe
- 3.1. United Kingdom
- 3.2. Germany
- 3.3. France
- 3.4. Italy
- 3.5. Spain
- 3.6. Russia
- 3.7. Benelux
- 3.8. Nordics
- 3.9. Rest of Europe
-
4. Middle East & Africa
- 4.1. Turkey
- 4.2. Israel
- 4.3. GCC
- 4.4. North Africa
- 4.5. South Africa
- 4.6. Rest of Middle East & Africa
-
5. Asia Pacific
- 5.1. China
- 5.2. India
- 5.3. Japan
- 5.4. South Korea
- 5.5. ASEAN
- 5.6. Oceania
- 5.7. Rest of Asia Pacific
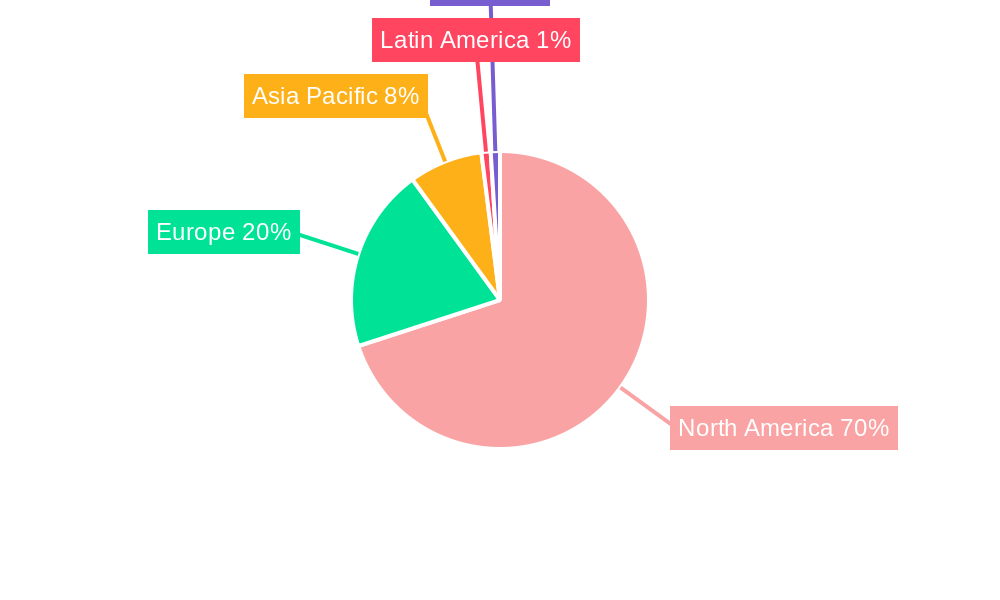
US Energy Drink Market Regional Market Share
Geographic Coverage of US Energy Drink Market
US Energy Drink Market REPORT HIGHLIGHTS
| Aspects | Details |
|---|---|
| Study Period | 2020-2034 |
| Base Year | 2025 |
| Estimated Year | 2026 |
| Forecast Period | 2026-2034 |
| Historical Period | 2020-2025 |
| Growth Rate | CAGR of 2.33% from 2020-2034 |
| Segmentation |
|
Table of Contents
- 1. Introduction
- 1.1. Research Scope
- 1.2. Market Segmentation
- 1.3. Research Objective
- 1.4. Definitions and Assumptions
- 2. Executive Summary
- 2.1. Market Snapshot
- 3. Market Dynamics
- 3.1. Market Drivers
- 3.2. Market Restrains
- 3.3. Market Trends
- 3.4. Market Opportunities
- 4. Market Factor Analysis
- 4.1. Porters Five Forces
- 4.1.1. Bargaining Power of Suppliers
- 4.1.2. Bargaining Power of Buyers
- 4.1.3. Threat of New Entrants
- 4.1.4. Threat of Substitutes
- 4.1.5. Competitive Rivalry
- 4.2. PESTEL analysis
- 4.3. BCG Analysis
- 4.3.1. Stars (High Growth, High Market Share)
- 4.3.2. Cash Cows (Low Growth, High Market Share)
- 4.3.3. Question Mark (High Growth, Low Market Share)
- 4.3.4. Dogs (Low Growth, Low Market Share)
- 4.4. Ansoff Matrix Analysis
- 4.5. Supply Chain Analysis
- 4.6. Regulatory Landscape
- 4.7. Current Market Potential and Opportunity Assessment (TAM–SAM–SOM Framework)
- 4.8. TIR Analyst Note
- 4.1. Porters Five Forces
- 5. Market Analysis, Insights and Forecast 2021-2033
- 5.1. Market Analysis, Insights and Forecast - by Soft Drink Type
- 5.1.1. Energy Shots
- 5.1.2. Natural/Organic Energy Drinks
- 5.1.3. Sugar-free or Low-calories Energy Drinks
- 5.1.4. Traditional Energy Drinks
- 5.1.5. Other Energy Drinks
- 5.2. Market Analysis, Insights and Forecast - by Packaging Type
- 5.2.1. Glass Bottles
- 5.2.2. Metal Can
- 5.2.3. PET Bottles
- 5.3. Market Analysis, Insights and Forecast - by Distribution Channel
- 5.3.1. Off-trade
- 5.3.1.1. Convenience Stores
- 5.3.1.2. Online Retail
- 5.3.1.3. Supermarket/Hypermarket
- 5.3.1.4. Others
- 5.3.2. On-trade
- 5.3.1. Off-trade
- 5.4. Market Analysis, Insights and Forecast - by Region
- 5.4.1. North America
- 5.4.2. South America
- 5.4.3. Europe
- 5.4.4. Middle East & Africa
- 5.4.5. Asia Pacific
- 5.1. Market Analysis, Insights and Forecast - by Soft Drink Type
- 6. Global US Energy Drink Market Analysis, Insights and Forecast, 2021-2033
- 6.1. Market Analysis, Insights and Forecast - by Soft Drink Type
- 6.1.1. Energy Shots
- 6.1.2. Natural/Organic Energy Drinks
- 6.1.3. Sugar-free or Low-calories Energy Drinks
- 6.1.4. Traditional Energy Drinks
- 6.1.5. Other Energy Drinks
- 6.2. Market Analysis, Insights and Forecast - by Packaging Type
- 6.2.1. Glass Bottles
- 6.2.2. Metal Can
- 6.2.3. PET Bottles
- 6.3. Market Analysis, Insights and Forecast - by Distribution Channel
- 6.3.1. Off-trade
- 6.3.1.1. Convenience Stores
- 6.3.1.2. Online Retail
- 6.3.1.3. Supermarket/Hypermarket
- 6.3.1.4. Others
- 6.3.2. On-trade
- 6.3.1. Off-trade
- 6.1. Market Analysis, Insights and Forecast - by Soft Drink Type
- 7. North America US Energy Drink Market Analysis, Insights and Forecast, 2020-2032
- 7.1. Market Analysis, Insights and Forecast - by Soft Drink Type
- 7.1.1. Energy Shots
- 7.1.2. Natural/Organic Energy Drinks
- 7.1.3. Sugar-free or Low-calories Energy Drinks
- 7.1.4. Traditional Energy Drinks
- 7.1.5. Other Energy Drinks
- 7.2. Market Analysis, Insights and Forecast - by Packaging Type
- 7.2.1. Glass Bottles
- 7.2.2. Metal Can
- 7.2.3. PET Bottles
- 7.3. Market Analysis, Insights and Forecast - by Distribution Channel
- 7.3.1. Off-trade
- 7.3.1.1. Convenience Stores
- 7.3.1.2. Online Retail
- 7.3.1.3. Supermarket/Hypermarket
- 7.3.1.4. Others
- 7.3.2. On-trade
- 7.3.1. Off-trade
- 7.1. Market Analysis, Insights and Forecast - by Soft Drink Type
- 8. South America US Energy Drink Market Analysis, Insights and Forecast, 2020-2032
- 8.1. Market Analysis, Insights and Forecast - by Soft Drink Type
- 8.1.1. Energy Shots
- 8.1.2. Natural/Organic Energy Drinks
- 8.1.3. Sugar-free or Low-calories Energy Drinks
- 8.1.4. Traditional Energy Drinks
- 8.1.5. Other Energy Drinks
- 8.2. Market Analysis, Insights and Forecast - by Packaging Type
- 8.2.1. Glass Bottles
- 8.2.2. Metal Can
- 8.2.3. PET Bottles
- 8.3. Market Analysis, Insights and Forecast - by Distribution Channel
- 8.3.1. Off-trade
- 8.3.1.1. Convenience Stores
- 8.3.1.2. Online Retail
- 8.3.1.3. Supermarket/Hypermarket
- 8.3.1.4. Others
- 8.3.2. On-trade
- 8.3.1. Off-trade
- 8.1. Market Analysis, Insights and Forecast - by Soft Drink Type
- 9. Europe US Energy Drink Market Analysis, Insights and Forecast, 2020-2032
- 9.1. Market Analysis, Insights and Forecast - by Soft Drink Type
- 9.1.1. Energy Shots
- 9.1.2. Natural/Organic Energy Drinks
- 9.1.3. Sugar-free or Low-calories Energy Drinks
- 9.1.4. Traditional Energy Drinks
- 9.1.5. Other Energy Drinks
- 9.2. Market Analysis, Insights and Forecast - by Packaging Type
- 9.2.1. Glass Bottles
- 9.2.2. Metal Can
- 9.2.3. PET Bottles
- 9.3. Market Analysis, Insights and Forecast - by Distribution Channel
- 9.3.1. Off-trade
- 9.3.1.1. Convenience Stores
- 9.3.1.2. Online Retail
- 9.3.1.3. Supermarket/Hypermarket
- 9.3.1.4. Others
- 9.3.2. On-trade
- 9.3.1. Off-trade
- 9.1. Market Analysis, Insights and Forecast - by Soft Drink Type
- 10. Middle East & Africa US Energy Drink Market Analysis, Insights and Forecast, 2020-2032
- 10.1. Market Analysis, Insights and Forecast - by Soft Drink Type
- 10.1.1. Energy Shots
- 10.1.2. Natural/Organic Energy Drinks
- 10.1.3. Sugar-free or Low-calories Energy Drinks
- 10.1.4. Traditional Energy Drinks
- 10.1.5. Other Energy Drinks
- 10.2. Market Analysis, Insights and Forecast - by Packaging Type
- 10.2.1. Glass Bottles
- 10.2.2. Metal Can
- 10.2.3. PET Bottles
- 10.3. Market Analysis, Insights and Forecast - by Distribution Channel
- 10.3.1. Off-trade
- 10.3.1.1. Convenience Stores
- 10.3.1.2. Online Retail
- 10.3.1.3. Supermarket/Hypermarket
- 10.3.1.4. Others
- 10.3.2. On-trade
- 10.3.1. Off-trade
- 10.1. Market Analysis, Insights and Forecast - by Soft Drink Type
- 11. Asia Pacific US Energy Drink Market Analysis, Insights and Forecast, 2020-2032
- 11.1. Market Analysis, Insights and Forecast - by Soft Drink Type
- 11.1.1. Energy Shots
- 11.1.2. Natural/Organic Energy Drinks
- 11.1.3. Sugar-free or Low-calories Energy Drinks
- 11.1.4. Traditional Energy Drinks
- 11.1.5. Other Energy Drinks
- 11.2. Market Analysis, Insights and Forecast - by Packaging Type
- 11.2.1. Glass Bottles
- 11.2.2. Metal Can
- 11.2.3. PET Bottles
- 11.3. Market Analysis, Insights and Forecast - by Distribution Channel
- 11.3.1. Off-trade
- 11.3.1.1. Convenience Stores
- 11.3.1.2. Online Retail
- 11.3.1.3. Supermarket/Hypermarket
- 11.3.1.4. Others
- 11.3.2. On-trade
- 11.3.1. Off-trade
- 11.1. Market Analysis, Insights and Forecast - by Soft Drink Type
- 12. Competitive Analysis
- 12.1. Company Profiles
- 12.1.1 Woodbolt Distribution LLC
- 12.1.1.1. Company Overview
- 12.1.1.2. Products
- 12.1.1.3. Company Financials
- 12.1.1.4. SWOT Analysis
- 12.1.2 Seven & I Holdings Co Ltd
- 12.1.2.1. Company Overview
- 12.1.2.2. Products
- 12.1.2.3. Company Financials
- 12.1.2.4. SWOT Analysis
- 12.1.3 Monster Beverage Corporation
- 12.1.3.1. Company Overview
- 12.1.3.2. Products
- 12.1.3.3. Company Financials
- 12.1.3.4. SWOT Analysis
- 12.1.4 PepsiCo Inc
- 12.1.4.1. Company Overview
- 12.1.4.2. Products
- 12.1.4.3. Company Financials
- 12.1.4.4. SWOT Analysis
- 12.1.5 DAS Labs LLC
- 12.1.5.1. Company Overview
- 12.1.5.2. Products
- 12.1.5.3. Company Financials
- 12.1.5.4. SWOT Analysis
- 12.1.6 Red Bull GmbH
- 12.1.6.1. Company Overview
- 12.1.6.2. Products
- 12.1.6.3. Company Financials
- 12.1.6.4. SWOT Analysis
- 12.1.7 Living Essentials LLC
- 12.1.7.1. Company Overview
- 12.1.7.2. Products
- 12.1.7.3. Company Financials
- 12.1.7.4. SWOT Analysis
- 12.1.8 Zevia LL
- 12.1.8.1. Company Overview
- 12.1.8.2. Products
- 12.1.8.3. Company Financials
- 12.1.8.4. SWOT Analysis
- 12.1.9 The Coca-Cola Company
- 12.1.9.1. Company Overview
- 12.1.9.2. Products
- 12.1.9.3. Company Financials
- 12.1.9.4. SWOT Analysis
- 12.1.10 N V E Pharmaceuticals
- 12.1.10.1. Company Overview
- 12.1.10.2. Products
- 12.1.10.3. Company Financials
- 12.1.10.4. SWOT Analysis
- 12.1.11 Congo Brands
- 12.1.11.1. Company Overview
- 12.1.11.2. Products
- 12.1.11.3. Company Financials
- 12.1.11.4. SWOT Analysis
- 12.1.1 Woodbolt Distribution LLC
- 12.2. Market Entropy
- 12.2.1 Company's Key Areas Served
- 12.2.2 Recent Developments
- 12.3. Company Market Share Analysis 2025
- 12.3.1 Top 5 Companies Market Share Analysis
- 12.3.2 Top 3 Companies Market Share Analysis
- 12.4. List of Potential Customers
- 13. Research Methodology
List of Figures
- Figure 1: Global US Energy Drink Market Revenue Breakdown (billion, %) by Region 2025 & 2033
- Figure 2: North America US Energy Drink Market Revenue (billion), by Soft Drink Type 2025 & 2033
- Figure 3: North America US Energy Drink Market Revenue Share (%), by Soft Drink Type 2025 & 2033
- Figure 4: North America US Energy Drink Market Revenue (billion), by Packaging Type 2025 & 2033
- Figure 5: North America US Energy Drink Market Revenue Share (%), by Packaging Type 2025 & 2033
- Figure 6: North America US Energy Drink Market Revenue (billion), by Distribution Channel 2025 & 2033
- Figure 7: North America US Energy Drink Market Revenue Share (%), by Distribution Channel 2025 & 2033
- Figure 8: North America US Energy Drink Market Revenue (billion), by Country 2025 & 2033
- Figure 9: North America US Energy Drink Market Revenue Share (%), by Country 2025 & 2033
- Figure 10: South America US Energy Drink Market Revenue (billion), by Soft Drink Type 2025 & 2033
- Figure 11: South America US Energy Drink Market Revenue Share (%), by Soft Drink Type 2025 & 2033
- Figure 12: South America US Energy Drink Market Revenue (billion), by Packaging Type 2025 & 2033
- Figure 13: South America US Energy Drink Market Revenue Share (%), by Packaging Type 2025 & 2033
- Figure 14: South America US Energy Drink Market Revenue (billion), by Distribution Channel 2025 & 2033
- Figure 15: South America US Energy Drink Market Revenue Share (%), by Distribution Channel 2025 & 2033
- Figure 16: South America US Energy Drink Market Revenue (billion), by Country 2025 & 2033
- Figure 17: South America US Energy Drink Market Revenue Share (%), by Country 2025 & 2033
- Figure 18: Europe US Energy Drink Market Revenue (billion), by Soft Drink Type 2025 & 2033
- Figure 19: Europe US Energy Drink Market Revenue Share (%), by Soft Drink Type 2025 & 2033
- Figure 20: Europe US Energy Drink Market Revenue (billion), by Packaging Type 2025 & 2033
- Figure 21: Europe US Energy Drink Market Revenue Share (%), by Packaging Type 2025 & 2033
- Figure 22: Europe US Energy Drink Market Revenue (billion), by Distribution Channel 2025 & 2033
- Figure 23: Europe US Energy Drink Market Revenue Share (%), by Distribution Channel 2025 & 2033
- Figure 24: Europe US Energy Drink Market Revenue (billion), by Country 2025 & 2033
- Figure 25: Europe US Energy Drink Market Revenue Share (%), by Country 2025 & 2033
- Figure 26: Middle East & Africa US Energy Drink Market Revenue (billion), by Soft Drink Type 2025 & 2033
- Figure 27: Middle East & Africa US Energy Drink Market Revenue Share (%), by Soft Drink Type 2025 & 2033
- Figure 28: Middle East & Africa US Energy Drink Market Revenue (billion), by Packaging Type 2025 & 2033
- Figure 29: Middle East & Africa US Energy Drink Market Revenue Share (%), by Packaging Type 2025 & 2033
- Figure 30: Middle East & Africa US Energy Drink Market Revenue (billion), by Distribution Channel 2025 & 2033
- Figure 31: Middle East & Africa US Energy Drink Market Revenue Share (%), by Distribution Channel 2025 & 2033
- Figure 32: Middle East & Africa US Energy Drink Market Revenue (billion), by Country 2025 & 2033
- Figure 33: Middle East & Africa US Energy Drink Market Revenue Share (%), by Country 2025 & 2033
- Figure 34: Asia Pacific US Energy Drink Market Revenue (billion), by Soft Drink Type 2025 & 2033
- Figure 35: Asia Pacific US Energy Drink Market Revenue Share (%), by Soft Drink Type 2025 & 2033
- Figure 36: Asia Pacific US Energy Drink Market Revenue (billion), by Packaging Type 2025 & 2033
- Figure 37: Asia Pacific US Energy Drink Market Revenue Share (%), by Packaging Type 2025 & 2033
- Figure 38: Asia Pacific US Energy Drink Market Revenue (billion), by Distribution Channel 2025 & 2033
- Figure 39: Asia Pacific US Energy Drink Market Revenue Share (%), by Distribution Channel 2025 & 2033
- Figure 40: Asia Pacific US Energy Drink Market Revenue (billion), by Country 2025 & 2033
- Figure 41: Asia Pacific US Energy Drink Market Revenue Share (%), by Country 2025 & 2033
List of Tables
- Table 1: Global US Energy Drink Market Revenue billion Forecast, by Soft Drink Type 2020 & 2033
- Table 2: Global US Energy Drink Market Revenue billion Forecast, by Packaging Type 2020 & 2033
- Table 3: Global US Energy Drink Market Revenue billion Forecast, by Distribution Channel 2020 & 2033
- Table 4: Global US Energy Drink Market Revenue billion Forecast, by Region 2020 & 2033
- Table 5: Global US Energy Drink Market Revenue billion Forecast, by Soft Drink Type 2020 & 2033
- Table 6: Global US Energy Drink Market Revenue billion Forecast, by Packaging Type 2020 & 2033
- Table 7: Global US Energy Drink Market Revenue billion Forecast, by Distribution Channel 2020 & 2033
- Table 8: Global US Energy Drink Market Revenue billion Forecast, by Country 2020 & 2033
- Table 9: United States US Energy Drink Market Revenue (billion) Forecast, by Application 2020 & 2033
- Table 10: Canada US Energy Drink Market Revenue (billion) Forecast, by Application 2020 & 2033
- Table 11: Mexico US Energy Drink Market Revenue (billion) Forecast, by Application 2020 & 2033
- Table 12: Global US Energy Drink Market Revenue billion Forecast, by Soft Drink Type 2020 & 2033
- Table 13: Global US Energy Drink Market Revenue billion Forecast, by Packaging Type 2020 & 2033
- Table 14: Global US Energy Drink Market Revenue billion Forecast, by Distribution Channel 2020 & 2033
- Table 15: Global US Energy Drink Market Revenue billion Forecast, by Country 2020 & 2033
- Table 16: Brazil US Energy Drink Market Revenue (billion) Forecast, by Application 2020 & 2033
- Table 17: Argentina US Energy Drink Market Revenue (billion) Forecast, by Application 2020 & 2033
- Table 18: Rest of South America US Energy Drink Market Revenue (billion) Forecast, by Application 2020 & 2033
- Table 19: Global US Energy Drink Market Revenue billion Forecast, by Soft Drink Type 2020 & 2033
- Table 20: Global US Energy Drink Market Revenue billion Forecast, by Packaging Type 2020 & 2033
- Table 21: Global US Energy Drink Market Revenue billion Forecast, by Distribution Channel 2020 & 2033
- Table 22: Global US Energy Drink Market Revenue billion Forecast, by Country 2020 & 2033
- Table 23: United Kingdom US Energy Drink Market Revenue (billion) Forecast, by Application 2020 & 2033
- Table 24: Germany US Energy Drink Market Revenue (billion) Forecast, by Application 2020 & 2033
- Table 25: France US Energy Drink Market Revenue (billion) Forecast, by Application 2020 & 2033
- Table 26: Italy US Energy Drink Market Revenue (billion) Forecast, by Application 2020 & 2033
- Table 27: Spain US Energy Drink Market Revenue (billion) Forecast, by Application 2020 & 2033
- Table 28: Russia US Energy Drink Market Revenue (billion) Forecast, by Application 2020 & 2033
- Table 29: Benelux US Energy Drink Market Revenue (billion) Forecast, by Application 2020 & 2033
- Table 30: Nordics US Energy Drink Market Revenue (billion) Forecast, by Application 2020 & 2033
- Table 31: Rest of Europe US Energy Drink Market Revenue (billion) Forecast, by Application 2020 & 2033
- Table 32: Global US Energy Drink Market Revenue billion Forecast, by Soft Drink Type 2020 & 2033
- Table 33: Global US Energy Drink Market Revenue billion Forecast, by Packaging Type 2020 & 2033
- Table 34: Global US Energy Drink Market Revenue billion Forecast, by Distribution Channel 2020 & 2033
- Table 35: Global US Energy Drink Market Revenue billion Forecast, by Country 2020 & 2033
- Table 36: Turkey US Energy Drink Market Revenue (billion) Forecast, by Application 2020 & 2033
- Table 37: Israel US Energy Drink Market Revenue (billion) Forecast, by Application 2020 & 2033
- Table 38: GCC US Energy Drink Market Revenue (billion) Forecast, by Application 2020 & 2033
- Table 39: North Africa US Energy Drink Market Revenue (billion) Forecast, by Application 2020 & 2033
- Table 40: South Africa US Energy Drink Market Revenue (billion) Forecast, by Application 2020 & 2033
- Table 41: Rest of Middle East & Africa US Energy Drink Market Revenue (billion) Forecast, by Application 2020 & 2033
- Table 42: Global US Energy Drink Market Revenue billion Forecast, by Soft Drink Type 2020 & 2033
- Table 43: Global US Energy Drink Market Revenue billion Forecast, by Packaging Type 2020 & 2033
- Table 44: Global US Energy Drink Market Revenue billion Forecast, by Distribution Channel 2020 & 2033
- Table 45: Global US Energy Drink Market Revenue billion Forecast, by Country 2020 & 2033
- Table 46: China US Energy Drink Market Revenue (billion) Forecast, by Application 2020 & 2033
- Table 47: India US Energy Drink Market Revenue (billion) Forecast, by Application 2020 & 2033
- Table 48: Japan US Energy Drink Market Revenue (billion) Forecast, by Application 2020 & 2033
- Table 49: South Korea US Energy Drink Market Revenue (billion) Forecast, by Application 2020 & 2033
- Table 50: ASEAN US Energy Drink Market Revenue (billion) Forecast, by Application 2020 & 2033
- Table 51: Oceania US Energy Drink Market Revenue (billion) Forecast, by Application 2020 & 2033
- Table 52: Rest of Asia Pacific US Energy Drink Market Revenue (billion) Forecast, by Application 2020 & 2033
Frequently Asked Questions
1. What is the projected Compound Annual Growth Rate (CAGR) of the US Energy Drink Market?
The projected CAGR is approximately 2.33%.
2. Which companies are prominent players in the US Energy Drink Market?
Key companies in the market include Woodbolt Distribution LLC, Seven & I Holdings Co Ltd, Monster Beverage Corporation, PepsiCo Inc, DAS Labs LLC, Red Bull GmbH, Living Essentials LLC, Zevia LL, The Coca-Cola Company, N V E Pharmaceuticals, Congo Brands.
3. What are the main segments of the US Energy Drink Market?
The market segments include Soft Drink Type, Packaging Type, Distribution Channel.
4. Can you provide details about the market size?
The market size is estimated to be USD 50.33 billion as of 2022.
5. What are some drivers contributing to market growth?
Rising Consumer Awareness about Health and Fitness; Increasing the Use of Casein and Caseinate in Food and Beverage Industry.
6. What are the notable trends driving market growth?
OTHER KEY INDUSTRY TRENDS COVERED IN THE REPORT.
7. Are there any restraints impacting market growth?
High Competition From Alternative Protein Sources.
8. Can you provide examples of recent developments in the market?
July 2023: Monster Beverage Corporation announced that its subsidiary, Blast Asset Acquisition LLC, completed its acquisition of substantially all of the assets of Vital Pharmaceuticals, Inc. and certain of its affiliates (collectively, “Bang Energy”) for approximately USD 362 million. The acquired assets include Bang Energy beverages and a beverage production facility in Phoenix, Arizona.July 2023: WWE and Nutrabolt, owner of the C4 brand, announced an expansion to their multi-year partnership with the launch of their first-ever co-branded product collaboration: WWE-inspired flavors of C4 Ultimate Pre-Workout Powder and C4 Ultimate Energy Drink.July 2023: The Los Angeles-based company Zevia LLC is considering getting a new distribution partner to expand its base business from selling multi-packs in grocery stores to selling single-serve cold beverages in c-stores.
9. What pricing options are available for accessing the report?
Pricing options include single-user, multi-user, and enterprise licenses priced at USD 3800, USD 4500, and USD 5800 respectively.
10. Is the market size provided in terms of value or volume?
The market size is provided in terms of value, measured in billion.
11. Are there any specific market keywords associated with the report?
Yes, the market keyword associated with the report is "US Energy Drink Market," which aids in identifying and referencing the specific market segment covered.
12. How do I determine which pricing option suits my needs best?
The pricing options vary based on user requirements and access needs. Individual users may opt for single-user licenses, while businesses requiring broader access may choose multi-user or enterprise licenses for cost-effective access to the report.
13. Are there any additional resources or data provided in the US Energy Drink Market report?
While the report offers comprehensive insights, it's advisable to review the specific contents or supplementary materials provided to ascertain if additional resources or data are available.
14. How can I stay updated on further developments or reports in the US Energy Drink Market?
To stay informed about further developments, trends, and reports in the US Energy Drink Market, consider subscribing to industry newsletters, following relevant companies and organizations, or regularly checking reputable industry news sources and publications.
Methodology
Step 1 - Identification of Relevant Samples Size from Population Database


Step 2 - Approaches for Defining Global Market Size (Value, Volume* & Price*)

Note*: In applicable scenarios
Step 3 - Data Sources
Primary Research
- Web Analytics
- Survey Reports
- Research Institute
- Latest Research Reports
- Opinion Leaders
Secondary Research
- Annual Reports
- White Paper
- Latest Press Release
- Industry Association
- Paid Database
- Investor Presentations

Step 4 - Data Triangulation
Involves using different sources of information in order to increase the validity of a study
These sources are likely to be stakeholders in a program - participants, other researchers, program staff, other community members, and so on.
Then we put all data in single framework & apply various statistical tools to find out the dynamic on the market.
During the analysis stage, feedback from the stakeholder groups would be compared to determine areas of agreement as well as areas of divergence