
Key Insights
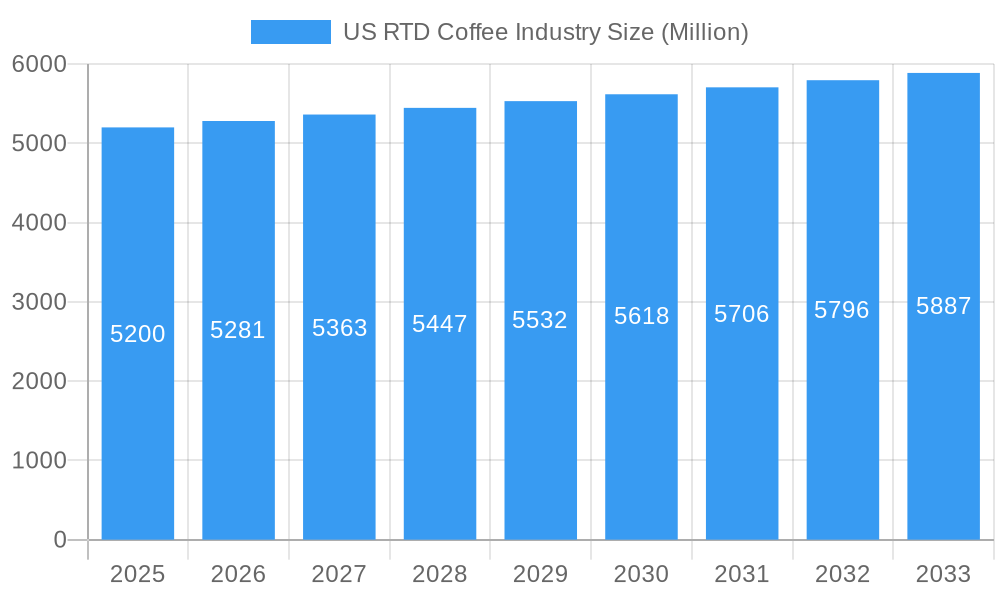
The U.S. Ready-to-Drink (RTD) coffee market, valued at $5.4 billion in 2025, is poised for sustained growth. Key drivers include the escalating consumer demand for convenient, on-the-go beverage solutions and a significant preference for healthier options like cold brew and iced coffee. Innovative packaging, encompassing aseptic, glass, metal, and PET formats, enhances market penetration by catering to diverse consumer needs. Expanded distribution through off-trade and on-trade channels further broadens market reach. Leading companies like Nestle, PepsiCo, and Coca-Cola are actively influencing the market through strategic product launches and acquisitions, underscoring a competitive environment. The market's Compound Annual Growth Rate (CAGR) is projected at 4.4%, suggesting mature but consistent expansion, driven by incremental product improvements and niche innovations. Higher consumption rates are anticipated in densely populated regions, particularly the Northeast and West.
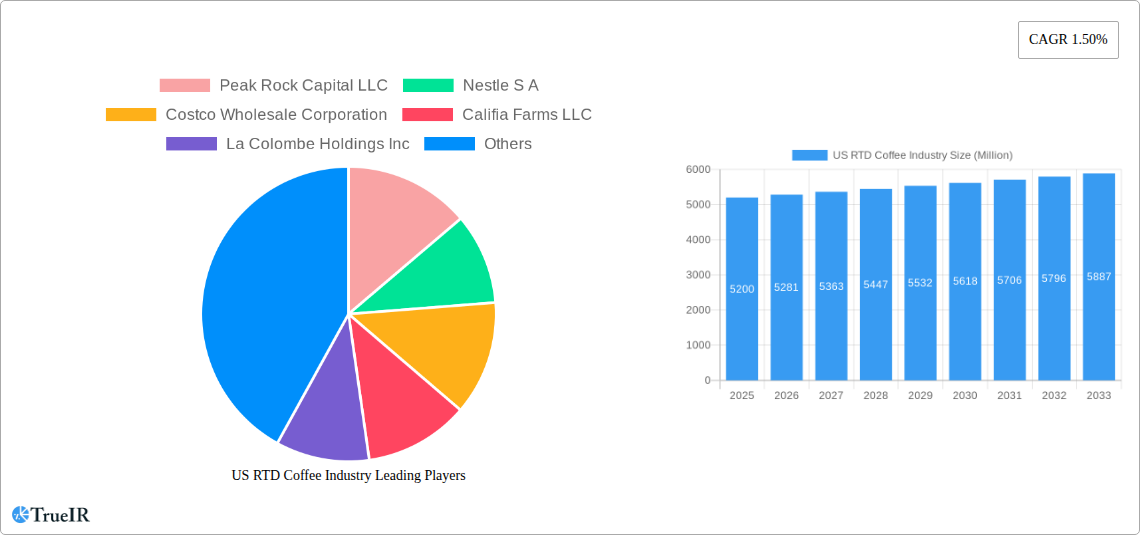
US RTD Coffee Industry Market Size (In Billion)
The U.S. RTD coffee market's projected trajectory indicates moderate expansion driven by continuous product innovation, including functional blends and novel flavors, alongside the growth of online delivery services and targeted marketing emphasizing convenience and health benefits. While challenges such as fluctuating coffee bean prices and intense competition persist, the market outlook remains positive, fueled by evolving consumer preferences and ongoing diversification.
US RTD Coffee Industry Company Market Share
This comprehensive report offers in-depth analysis of the U.S. RTD coffee industry, providing critical insights into market dynamics, competitive landscapes, and future growth potential. Spanning a study period from 2019 to 2033, with a base year of 2025 and a forecast period of 2025-2033, this report is an essential resource for industry professionals, investors, and strategic decision-makers, utilizing extensive data analysis, including CAGR and market penetration rates, for precise and actionable information.
US RTD Coffee Industry Market Structure & Competitive Landscape
The US RTD coffee market is characterized by a dynamic interplay of established giants and emerging players. Market concentration is moderate, with a few dominant players holding significant market share, but a substantial number of smaller companies contributing to innovation and competition. The industry is driven by continuous product innovation, focusing on flavors, functional benefits, and sustainable packaging. Regulatory changes impacting labeling, ingredients, and sustainability are ongoing influencing market strategies. Product substitutes, primarily other beverages like tea, juice, and energy drinks, exert competitive pressure. The market is segmented by distribution channels (off-trade and on-trade), soft drink type (cold brew coffee, iced coffee, other RTD coffee), and packaging type (aseptic packages, glass bottles, metal cans, PET bottles). Mergers and acquisitions (M&A) activity is relatively high, reflecting industry consolidation and expansion efforts. For example, the estimated M&A volume in 2024 was approximately $xx Million.
US RTD Coffee Industry Market Trends & Opportunities
The US RTD coffee market exhibits strong growth, with an estimated market size of $xx Million in 2025. This growth is driven by several key trends, including the increasing popularity of convenient beverage options, shifting consumer preferences towards healthier and premium choices, and technological advancements in packaging and production. The CAGR for the period 2025-2033 is projected to be xx%. Market penetration rates vary significantly across segments, with cold brew coffee experiencing the highest growth. Technological shifts, such as the adoption of sustainable packaging and innovative brewing methods, are shaping the industry landscape. The premiumization of RTD coffee is also notable, with consumers increasingly willing to pay more for high-quality, specialty coffee drinks. Competitive dynamics are intense, with established players investing heavily in R&D and marketing to maintain their market share while smaller players leverage niche offerings and direct-to-consumer strategies.
Dominant Markets & Segments in US RTD Coffee Industry
The off-trade distribution channel dominates the US RTD coffee market, accounting for approximately xx% of total sales in 2025. Key growth drivers in this segment include the expansion of retail channels, growing online grocery sales, and convenient packaging options.
- Off-Trade Channel Growth Drivers: Increased retail footprint, e-commerce penetration, convenient packaging formats.
- On-Trade Channel Growth Drivers: Reopening of food service establishments, increasing consumer spending, premium product offerings.
- Cold Brew Coffee Dominance: Growing consumer preference for smoother, less bitter taste profiles.
The iced coffee segment shows significant growth potential, fueled by consumer demand for refreshing, customizable coffee beverages. Metal cans are the preferred packaging type, due to their durability, recyclability, and aesthetic appeal. The leading region in the US RTD coffee market is the Western US, driven by high consumer disposable incomes and demand for premium coffee products.
US RTD Coffee Industry Product Analysis
Product innovation in the US RTD coffee industry is rapidly evolving, with new products such as plant-based cold brew lattes and functional coffee drinks hitting the market. Companies are focusing on incorporating organic, fair-trade, and sustainable ingredients, and are exploring new flavors and formats to meet evolving consumer demands. Technological advancements in brewing and packaging are resulting in improved product quality, shelf life, and convenience. The key competitive advantage lies in developing unique and high-quality products that cater to specific consumer needs and preferences, supported by robust branding and marketing campaigns.
Key Drivers, Barriers & Challenges in US RTD Coffee Industry
Key Drivers:
- Rising disposable incomes and increased consumer spending on premium beverages.
- Growing popularity of convenient and on-the-go consumption patterns.
- Technological advancements leading to improved product quality and shelf life.
- Increasing demand for healthy and functional beverages.
Challenges:
- Intense competition from established players and emerging brands.
- Fluctuations in raw material prices (e.g., coffee beans, milk).
- Supply chain disruptions caused by external factors (e.g., geopolitical events).
- Regulatory scrutiny relating to labeling, ingredients, and sustainability. This creates an estimated $xx Million annual impact on industry margins.
Growth Drivers in the US RTD Coffee Industry Market
The US RTD coffee market's growth is propelled by increased consumer demand for convenient, premium, and healthy beverages. Technological advancements in brewing and packaging contribute significantly to product innovation and market expansion. Favorable regulatory environments supporting sustainable practices further enhance growth. Specifically, growing consumer interest in organic and plant-based options fuels market expansion.
Challenges Impacting US RTD Coffee Industry Growth
The industry faces challenges such as intense competition, rising raw material costs, supply chain disruptions, and regulatory changes. The complexity of complying with evolving food and beverage regulations creates significant hurdles for many companies. Maintaining consistent supply chain operations amidst potential disruptions is another critical challenge that affects production and distribution capacity. These factors impact profitability and overall market growth.
Key Players Shaping the US RTD Coffee Industry Market
- Peak Rock Capital LLC
- Nestle S A
- Costco Wholesale Corporation
- Califia Farms LLC
- La Colombe Holdings Inc
- BRC Inc
- PepsiCo Inc
- The Coca-Cola Company
- The Central America Bottling Corporation
- Luigi Lavazza S p A
- Keurig Dr Pepper Inc
- Danone S A
- Chamberlain Coffee Inc
Significant US RTD Coffee Industry Milestones
- July 2023: Keurig Dr. Pepper Inc. announced a strategic partnership with La Colombe, signifying a significant shift in market consolidation and distribution.
- April 2023: Chamberlain Coffee's plant-based cold brew latte launch with Walmart expanded market reach and addressed growing consumer preferences.
- February 2023: Danone's planned $65 Million investment signaled a strong commitment to the RTD coffee and creamer market, indicating robust future growth.
Future Outlook for US RTD Coffee Industry Market
The US RTD coffee market is poised for continued strong growth, driven by innovation, consumer preference shifts, and strategic partnerships. Opportunities abound in developing sustainable and functional products, expanding into new distribution channels, and catering to evolving consumer preferences for premium and personalized experiences. The market's dynamic nature and continuous innovation promise exciting developments in the coming years.
US RTD Coffee Industry Segmentation
-
1. Soft Drink Type
- 1.1. Cold Brew Coffee
- 1.2. Iced coffee
- 1.3. Other RTD Coffee
-
2. Packaging Type
- 2.1. Aseptic packages
- 2.2. Glass Bottles
- 2.3. Metal Can
- 2.4. PET Bottles
-
3. Distribution Channel
-
3.1. Off-trade
- 3.1.1. Convenience Stores
- 3.1.2. Online Retail
- 3.1.3. Specialty Stores
- 3.1.4. Supermarket/Hypermarket
- 3.1.5. Others
- 3.2. On-trade
-
3.1. Off-trade
US RTD Coffee Industry Segmentation By Geography
-
1. North America
- 1.1. United States
- 1.2. Canada
- 1.3. Mexico
-
2. South America
- 2.1. Brazil
- 2.2. Argentina
- 2.3. Rest of South America
-
3. Europe
- 3.1. United Kingdom
- 3.2. Germany
- 3.3. France
- 3.4. Italy
- 3.5. Spain
- 3.6. Russia
- 3.7. Benelux
- 3.8. Nordics
- 3.9. Rest of Europe
-
4. Middle East & Africa
- 4.1. Turkey
- 4.2. Israel
- 4.3. GCC
- 4.4. North Africa
- 4.5. South Africa
- 4.6. Rest of Middle East & Africa
-
5. Asia Pacific
- 5.1. China
- 5.2. India
- 5.3. Japan
- 5.4. South Korea
- 5.5. ASEAN
- 5.6. Oceania
- 5.7. Rest of Asia Pacific
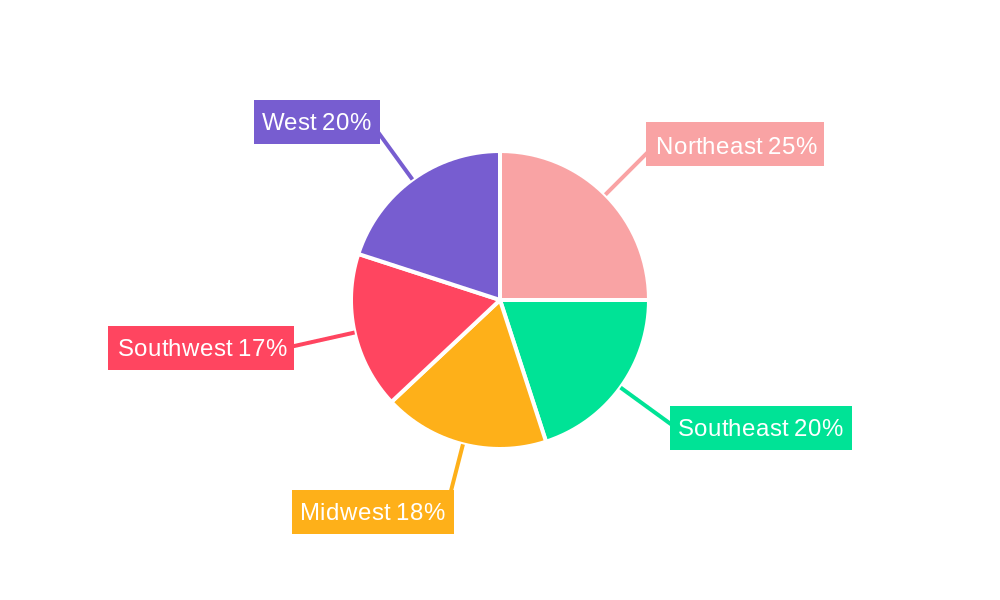
US RTD Coffee Industry Regional Market Share
Geographic Coverage of US RTD Coffee Industry
US RTD Coffee Industry REPORT HIGHLIGHTS
| Aspects | Details |
|---|---|
| Study Period | 2020-2034 |
| Base Year | 2025 |
| Estimated Year | 2026 |
| Forecast Period | 2026-2034 |
| Historical Period | 2020-2025 |
| Growth Rate | CAGR of 4.4% from 2020-2034 |
| Segmentation |
|
Table of Contents
- 1. Introduction
- 1.1. Research Scope
- 1.2. Market Segmentation
- 1.3. Research Methodology
- 1.4. Definitions and Assumptions
- 2. Executive Summary
- 2.1. Introduction
- 3. Market Dynamics
- 3.1. Introduction
- 3.2. Market Drivers
- 3.2.1. Increasing demand for meat alternatives
- 3.3. Market Restrains
- 3.3.1. Presence of numerous alternatives in the plant proteins
- 3.4. Market Trends
- 3.4.1. OTHER KEY INDUSTRY TRENDS COVERED IN THE REPORT
- 4. Market Factor Analysis
- 4.1. Porters Five Forces
- 4.2. Supply/Value Chain
- 4.3. PESTEL analysis
- 4.4. Market Entropy
- 4.5. Patent/Trademark Analysis
- 5. Global US RTD Coffee Industry Analysis, Insights and Forecast, 2020-2032
- 5.1. Market Analysis, Insights and Forecast - by Soft Drink Type
- 5.1.1. Cold Brew Coffee
- 5.1.2. Iced coffee
- 5.1.3. Other RTD Coffee
- 5.2. Market Analysis, Insights and Forecast - by Packaging Type
- 5.2.1. Aseptic packages
- 5.2.2. Glass Bottles
- 5.2.3. Metal Can
- 5.2.4. PET Bottles
- 5.3. Market Analysis, Insights and Forecast - by Distribution Channel
- 5.3.1. Off-trade
- 5.3.1.1. Convenience Stores
- 5.3.1.2. Online Retail
- 5.3.1.3. Specialty Stores
- 5.3.1.4. Supermarket/Hypermarket
- 5.3.1.5. Others
- 5.3.2. On-trade
- 5.3.1. Off-trade
- 5.4. Market Analysis, Insights and Forecast - by Region
- 5.4.1. North America
- 5.4.2. South America
- 5.4.3. Europe
- 5.4.4. Middle East & Africa
- 5.4.5. Asia Pacific
- 5.1. Market Analysis, Insights and Forecast - by Soft Drink Type
- 6. North America US RTD Coffee Industry Analysis, Insights and Forecast, 2020-2032
- 6.1. Market Analysis, Insights and Forecast - by Soft Drink Type
- 6.1.1. Cold Brew Coffee
- 6.1.2. Iced coffee
- 6.1.3. Other RTD Coffee
- 6.2. Market Analysis, Insights and Forecast - by Packaging Type
- 6.2.1. Aseptic packages
- 6.2.2. Glass Bottles
- 6.2.3. Metal Can
- 6.2.4. PET Bottles
- 6.3. Market Analysis, Insights and Forecast - by Distribution Channel
- 6.3.1. Off-trade
- 6.3.1.1. Convenience Stores
- 6.3.1.2. Online Retail
- 6.3.1.3. Specialty Stores
- 6.3.1.4. Supermarket/Hypermarket
- 6.3.1.5. Others
- 6.3.2. On-trade
- 6.3.1. Off-trade
- 6.1. Market Analysis, Insights and Forecast - by Soft Drink Type
- 7. South America US RTD Coffee Industry Analysis, Insights and Forecast, 2020-2032
- 7.1. Market Analysis, Insights and Forecast - by Soft Drink Type
- 7.1.1. Cold Brew Coffee
- 7.1.2. Iced coffee
- 7.1.3. Other RTD Coffee
- 7.2. Market Analysis, Insights and Forecast - by Packaging Type
- 7.2.1. Aseptic packages
- 7.2.2. Glass Bottles
- 7.2.3. Metal Can
- 7.2.4. PET Bottles
- 7.3. Market Analysis, Insights and Forecast - by Distribution Channel
- 7.3.1. Off-trade
- 7.3.1.1. Convenience Stores
- 7.3.1.2. Online Retail
- 7.3.1.3. Specialty Stores
- 7.3.1.4. Supermarket/Hypermarket
- 7.3.1.5. Others
- 7.3.2. On-trade
- 7.3.1. Off-trade
- 7.1. Market Analysis, Insights and Forecast - by Soft Drink Type
- 8. Europe US RTD Coffee Industry Analysis, Insights and Forecast, 2020-2032
- 8.1. Market Analysis, Insights and Forecast - by Soft Drink Type
- 8.1.1. Cold Brew Coffee
- 8.1.2. Iced coffee
- 8.1.3. Other RTD Coffee
- 8.2. Market Analysis, Insights and Forecast - by Packaging Type
- 8.2.1. Aseptic packages
- 8.2.2. Glass Bottles
- 8.2.3. Metal Can
- 8.2.4. PET Bottles
- 8.3. Market Analysis, Insights and Forecast - by Distribution Channel
- 8.3.1. Off-trade
- 8.3.1.1. Convenience Stores
- 8.3.1.2. Online Retail
- 8.3.1.3. Specialty Stores
- 8.3.1.4. Supermarket/Hypermarket
- 8.3.1.5. Others
- 8.3.2. On-trade
- 8.3.1. Off-trade
- 8.1. Market Analysis, Insights and Forecast - by Soft Drink Type
- 9. Middle East & Africa US RTD Coffee Industry Analysis, Insights and Forecast, 2020-2032
- 9.1. Market Analysis, Insights and Forecast - by Soft Drink Type
- 9.1.1. Cold Brew Coffee
- 9.1.2. Iced coffee
- 9.1.3. Other RTD Coffee
- 9.2. Market Analysis, Insights and Forecast - by Packaging Type
- 9.2.1. Aseptic packages
- 9.2.2. Glass Bottles
- 9.2.3. Metal Can
- 9.2.4. PET Bottles
- 9.3. Market Analysis, Insights and Forecast - by Distribution Channel
- 9.3.1. Off-trade
- 9.3.1.1. Convenience Stores
- 9.3.1.2. Online Retail
- 9.3.1.3. Specialty Stores
- 9.3.1.4. Supermarket/Hypermarket
- 9.3.1.5. Others
- 9.3.2. On-trade
- 9.3.1. Off-trade
- 9.1. Market Analysis, Insights and Forecast - by Soft Drink Type
- 10. Asia Pacific US RTD Coffee Industry Analysis, Insights and Forecast, 2020-2032
- 10.1. Market Analysis, Insights and Forecast - by Soft Drink Type
- 10.1.1. Cold Brew Coffee
- 10.1.2. Iced coffee
- 10.1.3. Other RTD Coffee
- 10.2. Market Analysis, Insights and Forecast - by Packaging Type
- 10.2.1. Aseptic packages
- 10.2.2. Glass Bottles
- 10.2.3. Metal Can
- 10.2.4. PET Bottles
- 10.3. Market Analysis, Insights and Forecast - by Distribution Channel
- 10.3.1. Off-trade
- 10.3.1.1. Convenience Stores
- 10.3.1.2. Online Retail
- 10.3.1.3. Specialty Stores
- 10.3.1.4. Supermarket/Hypermarket
- 10.3.1.5. Others
- 10.3.2. On-trade
- 10.3.1. Off-trade
- 10.1. Market Analysis, Insights and Forecast - by Soft Drink Type
- 11. Northeast US RTD Coffee Industry Analysis, Insights and Forecast, 2020-2032
- 12. Southeast US RTD Coffee Industry Analysis, Insights and Forecast, 2020-2032
- 13. Midwest US RTD Coffee Industry Analysis, Insights and Forecast, 2020-2032
- 14. Southwest US RTD Coffee Industry Analysis, Insights and Forecast, 2020-2032
- 15. West US RTD Coffee Industry Analysis, Insights and Forecast, 2020-2032
- 16. Competitive Analysis
- 16.1. Global Market Share Analysis 2025
- 16.2. Company Profiles
- 16.2.1 Peak Rock Capital LLC
- 16.2.1.1. Overview
- 16.2.1.2. Products
- 16.2.1.3. SWOT Analysis
- 16.2.1.4. Recent Developments
- 16.2.1.5. Financials (Based on Availability)
- 16.2.2 Nestle S A
- 16.2.2.1. Overview
- 16.2.2.2. Products
- 16.2.2.3. SWOT Analysis
- 16.2.2.4. Recent Developments
- 16.2.2.5. Financials (Based on Availability)
- 16.2.3 Costco Wholesale Corporation
- 16.2.3.1. Overview
- 16.2.3.2. Products
- 16.2.3.3. SWOT Analysis
- 16.2.3.4. Recent Developments
- 16.2.3.5. Financials (Based on Availability)
- 16.2.4 Califia Farms LLC
- 16.2.4.1. Overview
- 16.2.4.2. Products
- 16.2.4.3. SWOT Analysis
- 16.2.4.4. Recent Developments
- 16.2.4.5. Financials (Based on Availability)
- 16.2.5 La Colombe Holdings Inc
- 16.2.5.1. Overview
- 16.2.5.2. Products
- 16.2.5.3. SWOT Analysis
- 16.2.5.4. Recent Developments
- 16.2.5.5. Financials (Based on Availability)
- 16.2.6 BRC Inc
- 16.2.6.1. Overview
- 16.2.6.2. Products
- 16.2.6.3. SWOT Analysis
- 16.2.6.4. Recent Developments
- 16.2.6.5. Financials (Based on Availability)
- 16.2.7 PepsiCo Inc
- 16.2.7.1. Overview
- 16.2.7.2. Products
- 16.2.7.3. SWOT Analysis
- 16.2.7.4. Recent Developments
- 16.2.7.5. Financials (Based on Availability)
- 16.2.8 The Coca-Cola Compan
- 16.2.8.1. Overview
- 16.2.8.2. Products
- 16.2.8.3. SWOT Analysis
- 16.2.8.4. Recent Developments
- 16.2.8.5. Financials (Based on Availability)
- 16.2.9 The Central America Bottling Corporation
- 16.2.9.1. Overview
- 16.2.9.2. Products
- 16.2.9.3. SWOT Analysis
- 16.2.9.4. Recent Developments
- 16.2.9.5. Financials (Based on Availability)
- 16.2.10 Luigi Lavazza S p A
- 16.2.10.1. Overview
- 16.2.10.2. Products
- 16.2.10.3. SWOT Analysis
- 16.2.10.4. Recent Developments
- 16.2.10.5. Financials (Based on Availability)
- 16.2.11 Keurig Dr Pepper Inc
- 16.2.11.1. Overview
- 16.2.11.2. Products
- 16.2.11.3. SWOT Analysis
- 16.2.11.4. Recent Developments
- 16.2.11.5. Financials (Based on Availability)
- 16.2.12 Danone S A
- 16.2.12.1. Overview
- 16.2.12.2. Products
- 16.2.12.3. SWOT Analysis
- 16.2.12.4. Recent Developments
- 16.2.12.5. Financials (Based on Availability)
- 16.2.13 Chamberlain Coffee Inc
- 16.2.13.1. Overview
- 16.2.13.2. Products
- 16.2.13.3. SWOT Analysis
- 16.2.13.4. Recent Developments
- 16.2.13.5. Financials (Based on Availability)
- 16.2.1 Peak Rock Capital LLC
List of Figures
- Figure 1: Global US RTD Coffee Industry Revenue Breakdown (billion, %) by Region 2025 & 2033
- Figure 2: Global US RTD Coffee Industry Volume Breakdown (K Tons, %) by Region 2025 & 2033
- Figure 3: United states US RTD Coffee Industry Revenue (billion), by Country 2025 & 2033
- Figure 4: United states US RTD Coffee Industry Volume (K Tons), by Country 2025 & 2033
- Figure 5: United states US RTD Coffee Industry Revenue Share (%), by Country 2025 & 2033
- Figure 6: United states US RTD Coffee Industry Volume Share (%), by Country 2025 & 2033
- Figure 7: North America US RTD Coffee Industry Revenue (billion), by Soft Drink Type 2025 & 2033
- Figure 8: North America US RTD Coffee Industry Volume (K Tons), by Soft Drink Type 2025 & 2033
- Figure 9: North America US RTD Coffee Industry Revenue Share (%), by Soft Drink Type 2025 & 2033
- Figure 10: North America US RTD Coffee Industry Volume Share (%), by Soft Drink Type 2025 & 2033
- Figure 11: North America US RTD Coffee Industry Revenue (billion), by Packaging Type 2025 & 2033
- Figure 12: North America US RTD Coffee Industry Volume (K Tons), by Packaging Type 2025 & 2033
- Figure 13: North America US RTD Coffee Industry Revenue Share (%), by Packaging Type 2025 & 2033
- Figure 14: North America US RTD Coffee Industry Volume Share (%), by Packaging Type 2025 & 2033
- Figure 15: North America US RTD Coffee Industry Revenue (billion), by Distribution Channel 2025 & 2033
- Figure 16: North America US RTD Coffee Industry Volume (K Tons), by Distribution Channel 2025 & 2033
- Figure 17: North America US RTD Coffee Industry Revenue Share (%), by Distribution Channel 2025 & 2033
- Figure 18: North America US RTD Coffee Industry Volume Share (%), by Distribution Channel 2025 & 2033
- Figure 19: North America US RTD Coffee Industry Revenue (billion), by Country 2025 & 2033
- Figure 20: North America US RTD Coffee Industry Volume (K Tons), by Country 2025 & 2033
- Figure 21: North America US RTD Coffee Industry Revenue Share (%), by Country 2025 & 2033
- Figure 22: North America US RTD Coffee Industry Volume Share (%), by Country 2025 & 2033
- Figure 23: South America US RTD Coffee Industry Revenue (billion), by Soft Drink Type 2025 & 2033
- Figure 24: South America US RTD Coffee Industry Volume (K Tons), by Soft Drink Type 2025 & 2033
- Figure 25: South America US RTD Coffee Industry Revenue Share (%), by Soft Drink Type 2025 & 2033
- Figure 26: South America US RTD Coffee Industry Volume Share (%), by Soft Drink Type 2025 & 2033
- Figure 27: South America US RTD Coffee Industry Revenue (billion), by Packaging Type 2025 & 2033
- Figure 28: South America US RTD Coffee Industry Volume (K Tons), by Packaging Type 2025 & 2033
- Figure 29: South America US RTD Coffee Industry Revenue Share (%), by Packaging Type 2025 & 2033
- Figure 30: South America US RTD Coffee Industry Volume Share (%), by Packaging Type 2025 & 2033
- Figure 31: South America US RTD Coffee Industry Revenue (billion), by Distribution Channel 2025 & 2033
- Figure 32: South America US RTD Coffee Industry Volume (K Tons), by Distribution Channel 2025 & 2033
- Figure 33: South America US RTD Coffee Industry Revenue Share (%), by Distribution Channel 2025 & 2033
- Figure 34: South America US RTD Coffee Industry Volume Share (%), by Distribution Channel 2025 & 2033
- Figure 35: South America US RTD Coffee Industry Revenue (billion), by Country 2025 & 2033
- Figure 36: South America US RTD Coffee Industry Volume (K Tons), by Country 2025 & 2033
- Figure 37: South America US RTD Coffee Industry Revenue Share (%), by Country 2025 & 2033
- Figure 38: South America US RTD Coffee Industry Volume Share (%), by Country 2025 & 2033
- Figure 39: Europe US RTD Coffee Industry Revenue (billion), by Soft Drink Type 2025 & 2033
- Figure 40: Europe US RTD Coffee Industry Volume (K Tons), by Soft Drink Type 2025 & 2033
- Figure 41: Europe US RTD Coffee Industry Revenue Share (%), by Soft Drink Type 2025 & 2033
- Figure 42: Europe US RTD Coffee Industry Volume Share (%), by Soft Drink Type 2025 & 2033
- Figure 43: Europe US RTD Coffee Industry Revenue (billion), by Packaging Type 2025 & 2033
- Figure 44: Europe US RTD Coffee Industry Volume (K Tons), by Packaging Type 2025 & 2033
- Figure 45: Europe US RTD Coffee Industry Revenue Share (%), by Packaging Type 2025 & 2033
- Figure 46: Europe US RTD Coffee Industry Volume Share (%), by Packaging Type 2025 & 2033
- Figure 47: Europe US RTD Coffee Industry Revenue (billion), by Distribution Channel 2025 & 2033
- Figure 48: Europe US RTD Coffee Industry Volume (K Tons), by Distribution Channel 2025 & 2033
- Figure 49: Europe US RTD Coffee Industry Revenue Share (%), by Distribution Channel 2025 & 2033
- Figure 50: Europe US RTD Coffee Industry Volume Share (%), by Distribution Channel 2025 & 2033
- Figure 51: Europe US RTD Coffee Industry Revenue (billion), by Country 2025 & 2033
- Figure 52: Europe US RTD Coffee Industry Volume (K Tons), by Country 2025 & 2033
- Figure 53: Europe US RTD Coffee Industry Revenue Share (%), by Country 2025 & 2033
- Figure 54: Europe US RTD Coffee Industry Volume Share (%), by Country 2025 & 2033
- Figure 55: Middle East & Africa US RTD Coffee Industry Revenue (billion), by Soft Drink Type 2025 & 2033
- Figure 56: Middle East & Africa US RTD Coffee Industry Volume (K Tons), by Soft Drink Type 2025 & 2033
- Figure 57: Middle East & Africa US RTD Coffee Industry Revenue Share (%), by Soft Drink Type 2025 & 2033
- Figure 58: Middle East & Africa US RTD Coffee Industry Volume Share (%), by Soft Drink Type 2025 & 2033
- Figure 59: Middle East & Africa US RTD Coffee Industry Revenue (billion), by Packaging Type 2025 & 2033
- Figure 60: Middle East & Africa US RTD Coffee Industry Volume (K Tons), by Packaging Type 2025 & 2033
- Figure 61: Middle East & Africa US RTD Coffee Industry Revenue Share (%), by Packaging Type 2025 & 2033
- Figure 62: Middle East & Africa US RTD Coffee Industry Volume Share (%), by Packaging Type 2025 & 2033
- Figure 63: Middle East & Africa US RTD Coffee Industry Revenue (billion), by Distribution Channel 2025 & 2033
- Figure 64: Middle East & Africa US RTD Coffee Industry Volume (K Tons), by Distribution Channel 2025 & 2033
- Figure 65: Middle East & Africa US RTD Coffee Industry Revenue Share (%), by Distribution Channel 2025 & 2033
- Figure 66: Middle East & Africa US RTD Coffee Industry Volume Share (%), by Distribution Channel 2025 & 2033
- Figure 67: Middle East & Africa US RTD Coffee Industry Revenue (billion), by Country 2025 & 2033
- Figure 68: Middle East & Africa US RTD Coffee Industry Volume (K Tons), by Country 2025 & 2033
- Figure 69: Middle East & Africa US RTD Coffee Industry Revenue Share (%), by Country 2025 & 2033
- Figure 70: Middle East & Africa US RTD Coffee Industry Volume Share (%), by Country 2025 & 2033
- Figure 71: Asia Pacific US RTD Coffee Industry Revenue (billion), by Soft Drink Type 2025 & 2033
- Figure 72: Asia Pacific US RTD Coffee Industry Volume (K Tons), by Soft Drink Type 2025 & 2033
- Figure 73: Asia Pacific US RTD Coffee Industry Revenue Share (%), by Soft Drink Type 2025 & 2033
- Figure 74: Asia Pacific US RTD Coffee Industry Volume Share (%), by Soft Drink Type 2025 & 2033
- Figure 75: Asia Pacific US RTD Coffee Industry Revenue (billion), by Packaging Type 2025 & 2033
- Figure 76: Asia Pacific US RTD Coffee Industry Volume (K Tons), by Packaging Type 2025 & 2033
- Figure 77: Asia Pacific US RTD Coffee Industry Revenue Share (%), by Packaging Type 2025 & 2033
- Figure 78: Asia Pacific US RTD Coffee Industry Volume Share (%), by Packaging Type 2025 & 2033
- Figure 79: Asia Pacific US RTD Coffee Industry Revenue (billion), by Distribution Channel 2025 & 2033
- Figure 80: Asia Pacific US RTD Coffee Industry Volume (K Tons), by Distribution Channel 2025 & 2033
- Figure 81: Asia Pacific US RTD Coffee Industry Revenue Share (%), by Distribution Channel 2025 & 2033
- Figure 82: Asia Pacific US RTD Coffee Industry Volume Share (%), by Distribution Channel 2025 & 2033
- Figure 83: Asia Pacific US RTD Coffee Industry Revenue (billion), by Country 2025 & 2033
- Figure 84: Asia Pacific US RTD Coffee Industry Volume (K Tons), by Country 2025 & 2033
- Figure 85: Asia Pacific US RTD Coffee Industry Revenue Share (%), by Country 2025 & 2033
- Figure 86: Asia Pacific US RTD Coffee Industry Volume Share (%), by Country 2025 & 2033
List of Tables
- Table 1: Global US RTD Coffee Industry Revenue billion Forecast, by Region 2020 & 2033
- Table 2: Global US RTD Coffee Industry Volume K Tons Forecast, by Region 2020 & 2033
- Table 3: Global US RTD Coffee Industry Revenue billion Forecast, by Soft Drink Type 2020 & 2033
- Table 4: Global US RTD Coffee Industry Volume K Tons Forecast, by Soft Drink Type 2020 & 2033
- Table 5: Global US RTD Coffee Industry Revenue billion Forecast, by Packaging Type 2020 & 2033
- Table 6: Global US RTD Coffee Industry Volume K Tons Forecast, by Packaging Type 2020 & 2033
- Table 7: Global US RTD Coffee Industry Revenue billion Forecast, by Distribution Channel 2020 & 2033
- Table 8: Global US RTD Coffee Industry Volume K Tons Forecast, by Distribution Channel 2020 & 2033
- Table 9: Global US RTD Coffee Industry Revenue billion Forecast, by Region 2020 & 2033
- Table 10: Global US RTD Coffee Industry Volume K Tons Forecast, by Region 2020 & 2033
- Table 11: Global US RTD Coffee Industry Revenue billion Forecast, by Country 2020 & 2033
- Table 12: Global US RTD Coffee Industry Volume K Tons Forecast, by Country 2020 & 2033
- Table 13: Northeast US RTD Coffee Industry Revenue (billion) Forecast, by Application 2020 & 2033
- Table 14: Northeast US RTD Coffee Industry Volume (K Tons) Forecast, by Application 2020 & 2033
- Table 15: Southeast US RTD Coffee Industry Revenue (billion) Forecast, by Application 2020 & 2033
- Table 16: Southeast US RTD Coffee Industry Volume (K Tons) Forecast, by Application 2020 & 2033
- Table 17: Midwest US RTD Coffee Industry Revenue (billion) Forecast, by Application 2020 & 2033
- Table 18: Midwest US RTD Coffee Industry Volume (K Tons) Forecast, by Application 2020 & 2033
- Table 19: Southwest US RTD Coffee Industry Revenue (billion) Forecast, by Application 2020 & 2033
- Table 20: Southwest US RTD Coffee Industry Volume (K Tons) Forecast, by Application 2020 & 2033
- Table 21: West US RTD Coffee Industry Revenue (billion) Forecast, by Application 2020 & 2033
- Table 22: West US RTD Coffee Industry Volume (K Tons) Forecast, by Application 2020 & 2033
- Table 23: Global US RTD Coffee Industry Revenue billion Forecast, by Soft Drink Type 2020 & 2033
- Table 24: Global US RTD Coffee Industry Volume K Tons Forecast, by Soft Drink Type 2020 & 2033
- Table 25: Global US RTD Coffee Industry Revenue billion Forecast, by Packaging Type 2020 & 2033
- Table 26: Global US RTD Coffee Industry Volume K Tons Forecast, by Packaging Type 2020 & 2033
- Table 27: Global US RTD Coffee Industry Revenue billion Forecast, by Distribution Channel 2020 & 2033
- Table 28: Global US RTD Coffee Industry Volume K Tons Forecast, by Distribution Channel 2020 & 2033
- Table 29: Global US RTD Coffee Industry Revenue billion Forecast, by Country 2020 & 2033
- Table 30: Global US RTD Coffee Industry Volume K Tons Forecast, by Country 2020 & 2033
- Table 31: United States US RTD Coffee Industry Revenue (billion) Forecast, by Application 2020 & 2033
- Table 32: United States US RTD Coffee Industry Volume (K Tons) Forecast, by Application 2020 & 2033
- Table 33: Canada US RTD Coffee Industry Revenue (billion) Forecast, by Application 2020 & 2033
- Table 34: Canada US RTD Coffee Industry Volume (K Tons) Forecast, by Application 2020 & 2033
- Table 35: Mexico US RTD Coffee Industry Revenue (billion) Forecast, by Application 2020 & 2033
- Table 36: Mexico US RTD Coffee Industry Volume (K Tons) Forecast, by Application 2020 & 2033
- Table 37: Global US RTD Coffee Industry Revenue billion Forecast, by Soft Drink Type 2020 & 2033
- Table 38: Global US RTD Coffee Industry Volume K Tons Forecast, by Soft Drink Type 2020 & 2033
- Table 39: Global US RTD Coffee Industry Revenue billion Forecast, by Packaging Type 2020 & 2033
- Table 40: Global US RTD Coffee Industry Volume K Tons Forecast, by Packaging Type 2020 & 2033
- Table 41: Global US RTD Coffee Industry Revenue billion Forecast, by Distribution Channel 2020 & 2033
- Table 42: Global US RTD Coffee Industry Volume K Tons Forecast, by Distribution Channel 2020 & 2033
- Table 43: Global US RTD Coffee Industry Revenue billion Forecast, by Country 2020 & 2033
- Table 44: Global US RTD Coffee Industry Volume K Tons Forecast, by Country 2020 & 2033
- Table 45: Brazil US RTD Coffee Industry Revenue (billion) Forecast, by Application 2020 & 2033
- Table 46: Brazil US RTD Coffee Industry Volume (K Tons) Forecast, by Application 2020 & 2033
- Table 47: Argentina US RTD Coffee Industry Revenue (billion) Forecast, by Application 2020 & 2033
- Table 48: Argentina US RTD Coffee Industry Volume (K Tons) Forecast, by Application 2020 & 2033
- Table 49: Rest of South America US RTD Coffee Industry Revenue (billion) Forecast, by Application 2020 & 2033
- Table 50: Rest of South America US RTD Coffee Industry Volume (K Tons) Forecast, by Application 2020 & 2033
- Table 51: Global US RTD Coffee Industry Revenue billion Forecast, by Soft Drink Type 2020 & 2033
- Table 52: Global US RTD Coffee Industry Volume K Tons Forecast, by Soft Drink Type 2020 & 2033
- Table 53: Global US RTD Coffee Industry Revenue billion Forecast, by Packaging Type 2020 & 2033
- Table 54: Global US RTD Coffee Industry Volume K Tons Forecast, by Packaging Type 2020 & 2033
- Table 55: Global US RTD Coffee Industry Revenue billion Forecast, by Distribution Channel 2020 & 2033
- Table 56: Global US RTD Coffee Industry Volume K Tons Forecast, by Distribution Channel 2020 & 2033
- Table 57: Global US RTD Coffee Industry Revenue billion Forecast, by Country 2020 & 2033
- Table 58: Global US RTD Coffee Industry Volume K Tons Forecast, by Country 2020 & 2033
- Table 59: United Kingdom US RTD Coffee Industry Revenue (billion) Forecast, by Application 2020 & 2033
- Table 60: United Kingdom US RTD Coffee Industry Volume (K Tons) Forecast, by Application 2020 & 2033
- Table 61: Germany US RTD Coffee Industry Revenue (billion) Forecast, by Application 2020 & 2033
- Table 62: Germany US RTD Coffee Industry Volume (K Tons) Forecast, by Application 2020 & 2033
- Table 63: France US RTD Coffee Industry Revenue (billion) Forecast, by Application 2020 & 2033
- Table 64: France US RTD Coffee Industry Volume (K Tons) Forecast, by Application 2020 & 2033
- Table 65: Italy US RTD Coffee Industry Revenue (billion) Forecast, by Application 2020 & 2033
- Table 66: Italy US RTD Coffee Industry Volume (K Tons) Forecast, by Application 2020 & 2033
- Table 67: Spain US RTD Coffee Industry Revenue (billion) Forecast, by Application 2020 & 2033
- Table 68: Spain US RTD Coffee Industry Volume (K Tons) Forecast, by Application 2020 & 2033
- Table 69: Russia US RTD Coffee Industry Revenue (billion) Forecast, by Application 2020 & 2033
- Table 70: Russia US RTD Coffee Industry Volume (K Tons) Forecast, by Application 2020 & 2033
- Table 71: Benelux US RTD Coffee Industry Revenue (billion) Forecast, by Application 2020 & 2033
- Table 72: Benelux US RTD Coffee Industry Volume (K Tons) Forecast, by Application 2020 & 2033
- Table 73: Nordics US RTD Coffee Industry Revenue (billion) Forecast, by Application 2020 & 2033
- Table 74: Nordics US RTD Coffee Industry Volume (K Tons) Forecast, by Application 2020 & 2033
- Table 75: Rest of Europe US RTD Coffee Industry Revenue (billion) Forecast, by Application 2020 & 2033
- Table 76: Rest of Europe US RTD Coffee Industry Volume (K Tons) Forecast, by Application 2020 & 2033
- Table 77: Global US RTD Coffee Industry Revenue billion Forecast, by Soft Drink Type 2020 & 2033
- Table 78: Global US RTD Coffee Industry Volume K Tons Forecast, by Soft Drink Type 2020 & 2033
- Table 79: Global US RTD Coffee Industry Revenue billion Forecast, by Packaging Type 2020 & 2033
- Table 80: Global US RTD Coffee Industry Volume K Tons Forecast, by Packaging Type 2020 & 2033
- Table 81: Global US RTD Coffee Industry Revenue billion Forecast, by Distribution Channel 2020 & 2033
- Table 82: Global US RTD Coffee Industry Volume K Tons Forecast, by Distribution Channel 2020 & 2033
- Table 83: Global US RTD Coffee Industry Revenue billion Forecast, by Country 2020 & 2033
- Table 84: Global US RTD Coffee Industry Volume K Tons Forecast, by Country 2020 & 2033
- Table 85: Turkey US RTD Coffee Industry Revenue (billion) Forecast, by Application 2020 & 2033
- Table 86: Turkey US RTD Coffee Industry Volume (K Tons) Forecast, by Application 2020 & 2033
- Table 87: Israel US RTD Coffee Industry Revenue (billion) Forecast, by Application 2020 & 2033
- Table 88: Israel US RTD Coffee Industry Volume (K Tons) Forecast, by Application 2020 & 2033
- Table 89: GCC US RTD Coffee Industry Revenue (billion) Forecast, by Application 2020 & 2033
- Table 90: GCC US RTD Coffee Industry Volume (K Tons) Forecast, by Application 2020 & 2033
- Table 91: North Africa US RTD Coffee Industry Revenue (billion) Forecast, by Application 2020 & 2033
- Table 92: North Africa US RTD Coffee Industry Volume (K Tons) Forecast, by Application 2020 & 2033
- Table 93: South Africa US RTD Coffee Industry Revenue (billion) Forecast, by Application 2020 & 2033
- Table 94: South Africa US RTD Coffee Industry Volume (K Tons) Forecast, by Application 2020 & 2033
- Table 95: Rest of Middle East & Africa US RTD Coffee Industry Revenue (billion) Forecast, by Application 2020 & 2033
- Table 96: Rest of Middle East & Africa US RTD Coffee Industry Volume (K Tons) Forecast, by Application 2020 & 2033
- Table 97: Global US RTD Coffee Industry Revenue billion Forecast, by Soft Drink Type 2020 & 2033
- Table 98: Global US RTD Coffee Industry Volume K Tons Forecast, by Soft Drink Type 2020 & 2033
- Table 99: Global US RTD Coffee Industry Revenue billion Forecast, by Packaging Type 2020 & 2033
- Table 100: Global US RTD Coffee Industry Volume K Tons Forecast, by Packaging Type 2020 & 2033
- Table 101: Global US RTD Coffee Industry Revenue billion Forecast, by Distribution Channel 2020 & 2033
- Table 102: Global US RTD Coffee Industry Volume K Tons Forecast, by Distribution Channel 2020 & 2033
- Table 103: Global US RTD Coffee Industry Revenue billion Forecast, by Country 2020 & 2033
- Table 104: Global US RTD Coffee Industry Volume K Tons Forecast, by Country 2020 & 2033
- Table 105: China US RTD Coffee Industry Revenue (billion) Forecast, by Application 2020 & 2033
- Table 106: China US RTD Coffee Industry Volume (K Tons) Forecast, by Application 2020 & 2033
- Table 107: India US RTD Coffee Industry Revenue (billion) Forecast, by Application 2020 & 2033
- Table 108: India US RTD Coffee Industry Volume (K Tons) Forecast, by Application 2020 & 2033
- Table 109: Japan US RTD Coffee Industry Revenue (billion) Forecast, by Application 2020 & 2033
- Table 110: Japan US RTD Coffee Industry Volume (K Tons) Forecast, by Application 2020 & 2033
- Table 111: South Korea US RTD Coffee Industry Revenue (billion) Forecast, by Application 2020 & 2033
- Table 112: South Korea US RTD Coffee Industry Volume (K Tons) Forecast, by Application 2020 & 2033
- Table 113: ASEAN US RTD Coffee Industry Revenue (billion) Forecast, by Application 2020 & 2033
- Table 114: ASEAN US RTD Coffee Industry Volume (K Tons) Forecast, by Application 2020 & 2033
- Table 115: Oceania US RTD Coffee Industry Revenue (billion) Forecast, by Application 2020 & 2033
- Table 116: Oceania US RTD Coffee Industry Volume (K Tons) Forecast, by Application 2020 & 2033
- Table 117: Rest of Asia Pacific US RTD Coffee Industry Revenue (billion) Forecast, by Application 2020 & 2033
- Table 118: Rest of Asia Pacific US RTD Coffee Industry Volume (K Tons) Forecast, by Application 2020 & 2033
Frequently Asked Questions
1. What is the projected Compound Annual Growth Rate (CAGR) of the US RTD Coffee Industry?
The projected CAGR is approximately 4.4%.
2. Which companies are prominent players in the US RTD Coffee Industry?
Key companies in the market include Peak Rock Capital LLC, Nestle S A, Costco Wholesale Corporation, Califia Farms LLC, La Colombe Holdings Inc, BRC Inc, PepsiCo Inc, The Coca-Cola Compan, The Central America Bottling Corporation, Luigi Lavazza S p A, Keurig Dr Pepper Inc, Danone S A, Chamberlain Coffee Inc.
3. What are the main segments of the US RTD Coffee Industry?
The market segments include Soft Drink Type, Packaging Type, Distribution Channel.
4. Can you provide details about the market size?
The market size is estimated to be USD 5.4 billion as of 2022.
5. What are some drivers contributing to market growth?
Increasing demand for meat alternatives.
6. What are the notable trends driving market growth?
OTHER KEY INDUSTRY TRENDS COVERED IN THE REPORT.
7. Are there any restraints impacting market growth?
Presence of numerous alternatives in the plant proteins.
8. Can you provide examples of recent developments in the market?
July 2023: Keurig Dr. Pepper Inc. announced a strategic partnership with La Colombe, including a long-term sales and distribution agreement for La Colombe's ready-to-drink coffee. Keurig Dr Pepper will also make an equity investment in La Colombe, enabling KDP to participate in the value creation upside expected from the partnership.April 2023: Chamberlain Coffee, in collaboration with Walmart, rolled out a new line of plant-based cold brew lattes, ready to drink (RTD) and conveniently available at Walmart stores.February 2023: Danone North America planned to invest up to USD 65 million over the next two years to increase ready-to-drink (RTD) coffee and creamer and oat milk production in the US. The investment will cover several of Danone's coffee brands, including coffee creamer International Delight, oat milk brand Silk, and cold brew range SToK.
9. What pricing options are available for accessing the report?
Pricing options include single-user, multi-user, and enterprise licenses priced at USD 3800, USD 4500, and USD 5800 respectively.
10. Is the market size provided in terms of value or volume?
The market size is provided in terms of value, measured in billion and volume, measured in K Tons.
11. Are there any specific market keywords associated with the report?
Yes, the market keyword associated with the report is "US RTD Coffee Industry," which aids in identifying and referencing the specific market segment covered.
12. How do I determine which pricing option suits my needs best?
The pricing options vary based on user requirements and access needs. Individual users may opt for single-user licenses, while businesses requiring broader access may choose multi-user or enterprise licenses for cost-effective access to the report.
13. Are there any additional resources or data provided in the US RTD Coffee Industry report?
While the report offers comprehensive insights, it's advisable to review the specific contents or supplementary materials provided to ascertain if additional resources or data are available.
14. How can I stay updated on further developments or reports in the US RTD Coffee Industry?
To stay informed about further developments, trends, and reports in the US RTD Coffee Industry, consider subscribing to industry newsletters, following relevant companies and organizations, or regularly checking reputable industry news sources and publications.
Methodology
Step 1 - Identification of Relevant Samples Size from Population Database


Step 2 - Approaches for Defining Global Market Size (Value, Volume* & Price*)

Note*: In applicable scenarios
Step 3 - Data Sources
Primary Research
- Web Analytics
- Survey Reports
- Research Institute
- Latest Research Reports
- Opinion Leaders
Secondary Research
- Annual Reports
- White Paper
- Latest Press Release
- Industry Association
- Paid Database
- Investor Presentations

Step 4 - Data Triangulation
Involves using different sources of information in order to increase the validity of a study
These sources are likely to be stakeholders in a program - participants, other researchers, program staff, other community members, and so on.
Then we put all data in single framework & apply various statistical tools to find out the dynamic on the market.
During the analysis stage, feedback from the stakeholder groups would be compared to determine areas of agreement as well as areas of divergence
