

Key Insights
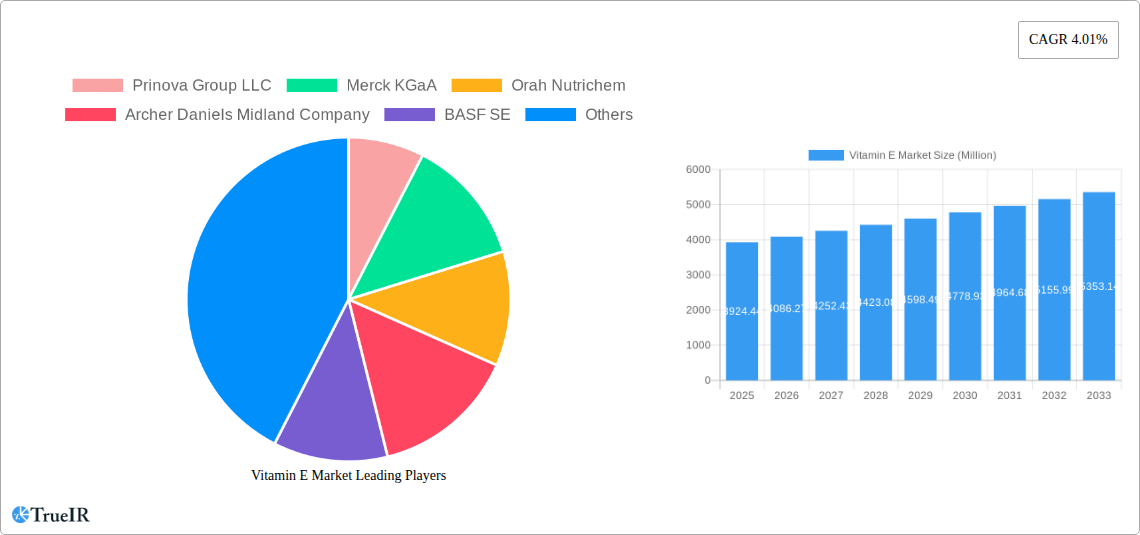
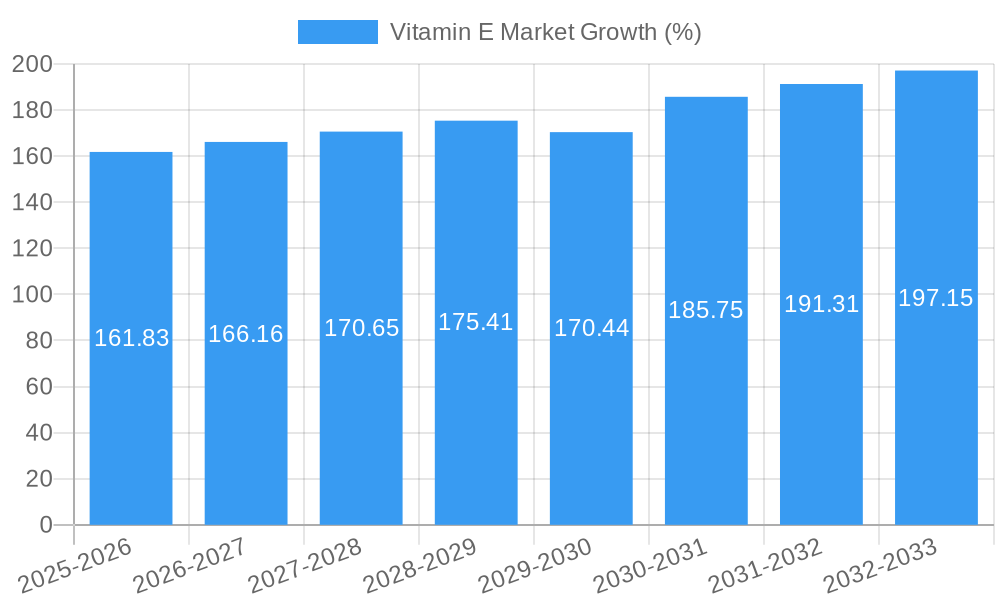
The global Vitamin E market, valued at $3924.44 million in 2025, is projected to experience robust growth, driven by increasing consumer awareness of health and wellness, rising demand for functional foods and dietary supplements, and the expanding application of Vitamin E in cosmetics and animal feed. The market's Compound Annual Growth Rate (CAGR) of 4.01% from 2019 to 2024 suggests a consistent upward trajectory, expected to continue throughout the forecast period (2025-2033). Key growth drivers include the increasing prevalence of chronic diseases like cardiovascular ailments and cancer, leading to a surge in demand for preventative supplements. Furthermore, the rising adoption of clean label products and the growing popularity of plant-based diets are fueling the demand for natural Vitamin E sources. The market segmentation highlights the significant contribution of functional foods and beverages, followed by pharmaceuticals and dietary supplements. Natural Vitamin E is expected to retain a larger market share compared to synthetic alternatives, driven by consumer preference for naturally derived ingredients. Geographic variations exist; North America and Europe currently hold significant market share, but the Asia Pacific region is predicted to show considerable growth, driven by rising disposable incomes and increased health consciousness in developing economies. Competitive dynamics are shaped by major players like Prinova Group LLC, Merck KGaA, and BASF SE, continually innovating to meet evolving consumer needs and regulatory landscapes.
The market's steady expansion is, however, tempered by certain restraints. Fluctuations in raw material prices and stringent regulatory approvals for new products can impact market growth. Moreover, the increasing availability of Vitamin E from various sources might lead to price competition. However, ongoing research and development efforts focusing on enhanced bioavailability and novel delivery systems are expected to counteract these challenges. The forecast period will see a continued focus on innovation in product formulations and delivery systems to meet the diverse needs of various consumer segments. This includes the development of targeted delivery systems to improve absorption and efficacy, as well as the incorporation of Vitamin E into innovative product formats like functional beverages and convenient supplement forms.
Vitamin E Market: A Comprehensive Report (2019-2033)
This dynamic report provides a comprehensive analysis of the Vitamin E market, encompassing market size, growth trends, competitive landscape, and future outlook. Leveraging extensive market research and data analysis from 2019-2024 (historical period), the report projects market performance through 2033 (forecast period), with 2025 serving as both the base and estimated year. The study meticulously examines key segments and driving forces, delivering crucial insights for industry stakeholders. This report is invaluable for businesses seeking to navigate the complexities and capitalize on the opportunities within this vital market.
Vitamin E Market Structure & Competitive Landscape
The Vitamin E market exhibits a moderately concentrated structure, with several major players controlling a significant portion of global production and distribution. Market concentration is estimated at xx% based on the combined market share of the top five players (Prinova Group LLC, Merck KGaA, Orah Nutrichem, Archer Daniels Midland Company, and BASF SE). However, the presence of numerous smaller players, particularly in regional markets, signifies a competitive landscape characterized by both consolidation and fragmentation.
Innovation Drivers: Significant innovation in extraction techniques (e.g., supercritical CO2 extraction for natural Vitamin E), formulation technologies (e.g., liposomal delivery systems for enhanced bioavailability), and product diversification (e.g., Vitamin E-enriched functional foods) are driving market growth.
Regulatory Impacts: Stringent regulations regarding food safety, labeling, and the use of synthetic vs. natural Vitamin E in different applications significantly shape market dynamics. Variances in regulatory frameworks across different regions pose both challenges and opportunities.
Product Substitutes: While Vitamin E has established itself as an essential nutrient, some consumers might opt for alternative antioxidants. This competitive pressure necessitates continuous innovation and differentiation strategies.
End-User Segmentation: The market is diversified across various end-use sectors, including functional food & beverages, pharmaceuticals and dietary supplements, infant nutrition, pet food and animal feed, and cosmetics. This segmentation impacts product formulations, pricing strategies, and distribution channels.
M&A Trends: The Vitamin E market has witnessed several mergers and acquisitions (M&A) activities in recent years, driven by consolidation strategies and efforts to expand market reach and product portfolios. The volume of M&A activity during the historical period (2019-2024) averaged approximately xx deals per year, reflecting a dynamic consolidation process.
Vitamin E Market Trends & Opportunities
The global Vitamin E market is experiencing robust growth, projected to reach xx Million by 2033, exhibiting a CAGR of xx% during the forecast period (2025-2033). This growth is propelled by several key factors. The rising consumer awareness of the health benefits of Vitamin E, coupled with increasing demand for functional foods and dietary supplements, drives market expansion. Technological advancements in extraction, encapsulation, and stabilization techniques offer superior product formulations, enhancing both efficacy and shelf-life. This, in turn, fuels consumer preference for high-quality, convenient, and value-added Vitamin E products. The market's competitive dynamics are shaped by ongoing innovation, brand loyalty, pricing strategies, and regulatory compliance. Growing penetration rates in emerging markets, particularly in Asia-Pacific, present significant growth opportunities. Market penetration rates in these regions are projected to increase from xx% in 2025 to xx% by 2033.
Dominant Markets & Segments in Vitamin E Market
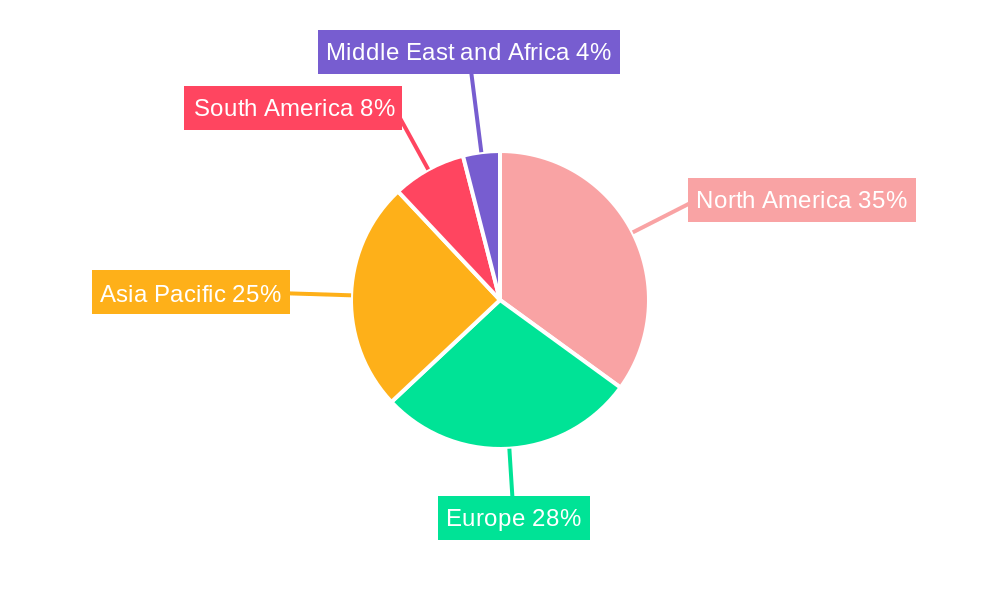
The North American region currently holds the leading position in the Vitamin E market, driven by strong consumer demand for health supplements, a well-established distribution network, and significant investments in research and development. Within product types, the natural Vitamin E segment commands a larger share than synthetic Vitamin E, reflecting the increasing consumer preference for natural ingredients.
Key Growth Drivers in North America:
- High disposable incomes
- Strong regulatory frameworks for food and dietary supplements
- Well-established health and wellness culture
Key Growth Drivers in Asia-Pacific:
- Rising disposable incomes in key emerging markets
- Growing awareness of health and wellness
- Expansion of retail channels
By application, the functional food and beverages segment is anticipated to maintain its dominant position, propelled by ongoing innovation in fortified food products and growing demand for healthier and more nutritious food options. However, the pharmaceuticals and dietary supplements segment is also expected to witness substantial growth, fueled by increasing awareness of the role of Vitamin E in health maintenance and disease prevention.
Vitamin E Market Product Analysis
The Vitamin E market features a range of products, including natural and synthetic forms, each with varying applications and competitive advantages. Advancements in extraction and encapsulation technologies have improved product quality and bioavailability, enhancing the efficacy of Vitamin E in diverse applications. Synthetic Vitamin E often offers a cost advantage, while natural Vitamin E commands a premium due to consumer preference for natural ingredients. The successful products are those that effectively address consumer needs regarding quality, purity, bioavailability, and cost-effectiveness, making them suitable for specific applications within various industry segments.
Key Drivers, Barriers & Challenges in Vitamin E Market
Key Drivers: Growing consumer awareness of the health benefits of Vitamin E, coupled with the increasing demand for fortified functional foods and dietary supplements, are the primary drivers of market expansion. Advancements in production techniques and the development of innovative delivery systems enhance product appeal and efficacy. Favorable government regulations in certain regions further accelerate market growth.
Challenges: Fluctuations in raw material prices, particularly for natural Vitamin E, can impact profitability. Stringent regulatory compliance requirements across diverse global markets present challenges for manufacturers. Competition from established and emerging players also presents a barrier to entry. Supply chain disruptions can significantly affect product availability and pricing. An estimated xx% reduction in supply was observed in 2022 due to logistical challenges.
Growth Drivers in the Vitamin E Market Market
Several factors are propelling the Vitamin E market's growth. The rising global population, coupled with increasing health consciousness, creates higher demand for vitamins and supplements. Furthermore, technological advancements in production and extraction processes are enhancing the efficiency and yield of Vitamin E production. Favorable government policies promoting healthy dietary habits and the integration of Vitamin E into various food products further stimulate market growth.
Challenges Impacting Vitamin E Market Growth
The Vitamin E market faces several challenges that could hamper its growth. Fluctuations in raw material prices and supply chain disruptions due to geopolitical factors or natural disasters can significantly affect production costs and product availability. Stringent regulatory environments, particularly in developed markets, and varying regulatory standards across different regions increase compliance costs. Intense competition from existing and new market entrants can also pressure profit margins.
Key Players Shaping the Vitamin E Market Market
- Prinova Group LLC
- Merck KGaA
- Orah Nutrichem
- Archer Daniels Midland Company
- BASF SE
- Aryan International
- Koninklijke DSM NV
- The Bountiful Company
- Jilin Beisha Pharmaceutical Co Ltd
- BTSA Biotecnologías Aplicadas SL
Significant Vitamin E Market Industry Milestones
June 2021: Prinova launched an e-commerce website, enhancing ingredient purchases and B2B vitamin distribution globally. This move boosted market accessibility and potentially increased sales.
June 2021: One Rock Capital's acquisition of BASF's specialty chemical facility in Illinois signals increased investment in natural Vitamin E production, potentially expanding market capacity and supply.
December 2021: The Kensing company's partnership with Azelis expanded the distribution of Vitamin E products in Europe, the Middle East, and Africa, increasing market reach and penetration in key regions.
Future Outlook for Vitamin E Market Market
The Vitamin E market is poised for continued growth, fueled by ongoing consumer demand for health and wellness products, advancements in product formulation and delivery systems, and expansion into new geographical markets. Strategic partnerships, acquisitions, and investments in research and development will further shape market dynamics. The market’s success will depend on manufacturers’ ability to innovate, comply with evolving regulations, and cater to diverse consumer preferences. This presents significant opportunities for established players and new entrants alike.
Vitamin E Market Segmentation
-
1. Product Type
- 1.1. Natural
- 1.2. Synthetic
-
2. Application
- 2.1. Functional Food and Beverages
- 2.2. Pharmaceuticals and Dietary Supplements
- 2.3. Infant Nutrition
- 2.4. Pet Food and Animal Feed
- 2.5. Cosmetics
Vitamin E Market Segmentation By Geography
-
1. North America
- 1.1. United States
- 1.2. Canada
- 1.3. Mexico
- 1.4. Rest of North America
-
2. Europe
- 2.1. Germany
- 2.2. United Kingdom
- 2.3. France
- 2.4. Russia
- 2.5. Spain
- 2.6. Italy
- 2.7. Rest of Europe
-
3. Asia Pacific
- 3.1. India
- 3.2. China
- 3.3. Japan
- 3.4. Australia
- 3.5. Rest of Asia Pacific
-
4. South America
- 4.1. Brazil
- 4.2. Argentina
- 4.3. Rest of South America
-
5. Middle East and Africa
- 5.1. South Africa
- 5.2. Saudi Arabia
- 5.3. Rest of Middle East and Africa
Vitamin E Market REPORT HIGHLIGHTS
| Aspects | Details |
|---|---|
| Study Period | 2019-2033 |
| Base Year | 2024 |
| Estimated Year | 2025 |
| Forecast Period | 2025-2033 |
| Historical Period | 2019-2024 |
| Growth Rate | CAGR of 4.01% from 2019-2033 |
| Segmentation |
|
Table of Contents
- 1. Introduction
- 1.1. Research Scope
- 1.2. Market Segmentation
- 1.3. Research Methodology
- 1.4. Definitions and Assumptions
- 2. Executive Summary
- 2.1. Introduction
- 3. Market Dynamics
- 3.1. Introduction
- 3.2. Market Drivers
- 3.2.1. Awareness of Health Benefits Associated with Tocotrienol; Escalating Demand for Anti-Aging Products Containing Tocotrienol
- 3.3. Market Restrains
- 3.3.1. Availability of Substitutes
- 3.4. Market Trends
- 3.4.1. Increasing Demand for Vitamin E in Various Applications
- 4. Market Factor Analysis
- 4.1. Porters Five Forces
- 4.2. Supply/Value Chain
- 4.3. PESTEL analysis
- 4.4. Market Entropy
- 4.5. Patent/Trademark Analysis
- 5. Global Vitamin E Market Analysis, Insights and Forecast, 2019-2031
- 5.1. Market Analysis, Insights and Forecast - by Product Type
- 5.1.1. Natural
- 5.1.2. Synthetic
- 5.2. Market Analysis, Insights and Forecast - by Application
- 5.2.1. Functional Food and Beverages
- 5.2.2. Pharmaceuticals and Dietary Supplements
- 5.2.3. Infant Nutrition
- 5.2.4. Pet Food and Animal Feed
- 5.2.5. Cosmetics
- 5.3. Market Analysis, Insights and Forecast - by Region
- 5.3.1. North America
- 5.3.2. Europe
- 5.3.3. Asia Pacific
- 5.3.4. South America
- 5.3.5. Middle East and Africa
- 5.1. Market Analysis, Insights and Forecast - by Product Type
- 6. North America Vitamin E Market Analysis, Insights and Forecast, 2019-2031
- 6.1. Market Analysis, Insights and Forecast - by Product Type
- 6.1.1. Natural
- 6.1.2. Synthetic
- 6.2. Market Analysis, Insights and Forecast - by Application
- 6.2.1. Functional Food and Beverages
- 6.2.2. Pharmaceuticals and Dietary Supplements
- 6.2.3. Infant Nutrition
- 6.2.4. Pet Food and Animal Feed
- 6.2.5. Cosmetics
- 6.1. Market Analysis, Insights and Forecast - by Product Type
- 7. Europe Vitamin E Market Analysis, Insights and Forecast, 2019-2031
- 7.1. Market Analysis, Insights and Forecast - by Product Type
- 7.1.1. Natural
- 7.1.2. Synthetic
- 7.2. Market Analysis, Insights and Forecast - by Application
- 7.2.1. Functional Food and Beverages
- 7.2.2. Pharmaceuticals and Dietary Supplements
- 7.2.3. Infant Nutrition
- 7.2.4. Pet Food and Animal Feed
- 7.2.5. Cosmetics
- 7.1. Market Analysis, Insights and Forecast - by Product Type
- 8. Asia Pacific Vitamin E Market Analysis, Insights and Forecast, 2019-2031
- 8.1. Market Analysis, Insights and Forecast - by Product Type
- 8.1.1. Natural
- 8.1.2. Synthetic
- 8.2. Market Analysis, Insights and Forecast - by Application
- 8.2.1. Functional Food and Beverages
- 8.2.2. Pharmaceuticals and Dietary Supplements
- 8.2.3. Infant Nutrition
- 8.2.4. Pet Food and Animal Feed
- 8.2.5. Cosmetics
- 8.1. Market Analysis, Insights and Forecast - by Product Type
- 9. South America Vitamin E Market Analysis, Insights and Forecast, 2019-2031
- 9.1. Market Analysis, Insights and Forecast - by Product Type
- 9.1.1. Natural
- 9.1.2. Synthetic
- 9.2. Market Analysis, Insights and Forecast - by Application
- 9.2.1. Functional Food and Beverages
- 9.2.2. Pharmaceuticals and Dietary Supplements
- 9.2.3. Infant Nutrition
- 9.2.4. Pet Food and Animal Feed
- 9.2.5. Cosmetics
- 9.1. Market Analysis, Insights and Forecast - by Product Type
- 10. Middle East and Africa Vitamin E Market Analysis, Insights and Forecast, 2019-2031
- 10.1. Market Analysis, Insights and Forecast - by Product Type
- 10.1.1. Natural
- 10.1.2. Synthetic
- 10.2. Market Analysis, Insights and Forecast - by Application
- 10.2.1. Functional Food and Beverages
- 10.2.2. Pharmaceuticals and Dietary Supplements
- 10.2.3. Infant Nutrition
- 10.2.4. Pet Food and Animal Feed
- 10.2.5. Cosmetics
- 10.1. Market Analysis, Insights and Forecast - by Product Type
- 11. North America Vitamin E Market Analysis, Insights and Forecast, 2019-2031
- 11.1. Market Analysis, Insights and Forecast - By Country/Sub-region
- 11.1.1 United States
- 11.1.2 Canada
- 11.1.3 Mexico
- 11.1.4 Rest of North America
- 12. Europe Vitamin E Market Analysis, Insights and Forecast, 2019-2031
- 12.1. Market Analysis, Insights and Forecast - By Country/Sub-region
- 12.1.1 Germany
- 12.1.2 United Kingdom
- 12.1.3 France
- 12.1.4 Russia
- 12.1.5 Spain
- 12.1.6 Italy
- 12.1.7 Rest of Europe
- 13. Asia Pacific Vitamin E Market Analysis, Insights and Forecast, 2019-2031
- 13.1. Market Analysis, Insights and Forecast - By Country/Sub-region
- 13.1.1 India
- 13.1.2 China
- 13.1.3 Japan
- 13.1.4 Australia
- 13.1.5 Rest of Asia Pacific
- 14. South America Vitamin E Market Analysis, Insights and Forecast, 2019-2031
- 14.1. Market Analysis, Insights and Forecast - By Country/Sub-region
- 14.1.1 Brazil
- 14.1.2 Argentina
- 14.1.3 Rest of South America
- 15. Middle East and Africa Vitamin E Market Analysis, Insights and Forecast, 2019-2031
- 15.1. Market Analysis, Insights and Forecast - By Country/Sub-region
- 15.1.1 South Africa
- 15.1.2 Saudi Arabia
- 15.1.3 Rest of Middle East and Africa
- 16. Competitive Analysis
- 16.1. Global Market Share Analysis 2024
- 16.2. Company Profiles
- 16.2.1 Prinova Group LLC
- 16.2.1.1. Overview
- 16.2.1.2. Products
- 16.2.1.3. SWOT Analysis
- 16.2.1.4. Recent Developments
- 16.2.1.5. Financials (Based on Availability)
- 16.2.2 Merck KGaA
- 16.2.2.1. Overview
- 16.2.2.2. Products
- 16.2.2.3. SWOT Analysis
- 16.2.2.4. Recent Developments
- 16.2.2.5. Financials (Based on Availability)
- 16.2.3 Orah Nutrichem
- 16.2.3.1. Overview
- 16.2.3.2. Products
- 16.2.3.3. SWOT Analysis
- 16.2.3.4. Recent Developments
- 16.2.3.5. Financials (Based on Availability)
- 16.2.4 Archer Daniels Midland Company
- 16.2.4.1. Overview
- 16.2.4.2. Products
- 16.2.4.3. SWOT Analysis
- 16.2.4.4. Recent Developments
- 16.2.4.5. Financials (Based on Availability)
- 16.2.5 BASF SE
- 16.2.5.1. Overview
- 16.2.5.2. Products
- 16.2.5.3. SWOT Analysis
- 16.2.5.4. Recent Developments
- 16.2.5.5. Financials (Based on Availability)
- 16.2.6 Aryan International
- 16.2.6.1. Overview
- 16.2.6.2. Products
- 16.2.6.3. SWOT Analysis
- 16.2.6.4. Recent Developments
- 16.2.6.5. Financials (Based on Availability)
- 16.2.7 Koninklijke DSM NV
- 16.2.7.1. Overview
- 16.2.7.2. Products
- 16.2.7.3. SWOT Analysis
- 16.2.7.4. Recent Developments
- 16.2.7.5. Financials (Based on Availability)
- 16.2.8 The Bountiful Company*List Not Exhaustive
- 16.2.8.1. Overview
- 16.2.8.2. Products
- 16.2.8.3. SWOT Analysis
- 16.2.8.4. Recent Developments
- 16.2.8.5. Financials (Based on Availability)
- 16.2.9 Jilin Beisha Pharmaceutical Co Ltd
- 16.2.9.1. Overview
- 16.2.9.2. Products
- 16.2.9.3. SWOT Analysis
- 16.2.9.4. Recent Developments
- 16.2.9.5. Financials (Based on Availability)
- 16.2.10 BTSA Biotecnologías Aplicadas SL
- 16.2.10.1. Overview
- 16.2.10.2. Products
- 16.2.10.3. SWOT Analysis
- 16.2.10.4. Recent Developments
- 16.2.10.5. Financials (Based on Availability)
- 16.2.1 Prinova Group LLC
List of Figures
- Figure 1: Global Vitamin E Market Revenue Breakdown (Million, %) by Region 2024 & 2032
- Figure 2: Global Vitamin E Market Volume Breakdown (K Tons, %) by Region 2024 & 2032
- Figure 3: North America Vitamin E Market Revenue (Million), by Country 2024 & 2032
- Figure 4: North America Vitamin E Market Volume (K Tons), by Country 2024 & 2032
- Figure 5: North America Vitamin E Market Revenue Share (%), by Country 2024 & 2032
- Figure 6: North America Vitamin E Market Volume Share (%), by Country 2024 & 2032
- Figure 7: Europe Vitamin E Market Revenue (Million), by Country 2024 & 2032
- Figure 8: Europe Vitamin E Market Volume (K Tons), by Country 2024 & 2032
- Figure 9: Europe Vitamin E Market Revenue Share (%), by Country 2024 & 2032
- Figure 10: Europe Vitamin E Market Volume Share (%), by Country 2024 & 2032
- Figure 11: Asia Pacific Vitamin E Market Revenue (Million), by Country 2024 & 2032
- Figure 12: Asia Pacific Vitamin E Market Volume (K Tons), by Country 2024 & 2032
- Figure 13: Asia Pacific Vitamin E Market Revenue Share (%), by Country 2024 & 2032
- Figure 14: Asia Pacific Vitamin E Market Volume Share (%), by Country 2024 & 2032
- Figure 15: South America Vitamin E Market Revenue (Million), by Country 2024 & 2032
- Figure 16: South America Vitamin E Market Volume (K Tons), by Country 2024 & 2032
- Figure 17: South America Vitamin E Market Revenue Share (%), by Country 2024 & 2032
- Figure 18: South America Vitamin E Market Volume Share (%), by Country 2024 & 2032
- Figure 19: Middle East and Africa Vitamin E Market Revenue (Million), by Country 2024 & 2032
- Figure 20: Middle East and Africa Vitamin E Market Volume (K Tons), by Country 2024 & 2032
- Figure 21: Middle East and Africa Vitamin E Market Revenue Share (%), by Country 2024 & 2032
- Figure 22: Middle East and Africa Vitamin E Market Volume Share (%), by Country 2024 & 2032
- Figure 23: North America Vitamin E Market Revenue (Million), by Product Type 2024 & 2032
- Figure 24: North America Vitamin E Market Volume (K Tons), by Product Type 2024 & 2032
- Figure 25: North America Vitamin E Market Revenue Share (%), by Product Type 2024 & 2032
- Figure 26: North America Vitamin E Market Volume Share (%), by Product Type 2024 & 2032
- Figure 27: North America Vitamin E Market Revenue (Million), by Application 2024 & 2032
- Figure 28: North America Vitamin E Market Volume (K Tons), by Application 2024 & 2032
- Figure 29: North America Vitamin E Market Revenue Share (%), by Application 2024 & 2032
- Figure 30: North America Vitamin E Market Volume Share (%), by Application 2024 & 2032
- Figure 31: North America Vitamin E Market Revenue (Million), by Country 2024 & 2032
- Figure 32: North America Vitamin E Market Volume (K Tons), by Country 2024 & 2032
- Figure 33: North America Vitamin E Market Revenue Share (%), by Country 2024 & 2032
- Figure 34: North America Vitamin E Market Volume Share (%), by Country 2024 & 2032
- Figure 35: Europe Vitamin E Market Revenue (Million), by Product Type 2024 & 2032
- Figure 36: Europe Vitamin E Market Volume (K Tons), by Product Type 2024 & 2032
- Figure 37: Europe Vitamin E Market Revenue Share (%), by Product Type 2024 & 2032
- Figure 38: Europe Vitamin E Market Volume Share (%), by Product Type 2024 & 2032
- Figure 39: Europe Vitamin E Market Revenue (Million), by Application 2024 & 2032
- Figure 40: Europe Vitamin E Market Volume (K Tons), by Application 2024 & 2032
- Figure 41: Europe Vitamin E Market Revenue Share (%), by Application 2024 & 2032
- Figure 42: Europe Vitamin E Market Volume Share (%), by Application 2024 & 2032
- Figure 43: Europe Vitamin E Market Revenue (Million), by Country 2024 & 2032
- Figure 44: Europe Vitamin E Market Volume (K Tons), by Country 2024 & 2032
- Figure 45: Europe Vitamin E Market Revenue Share (%), by Country 2024 & 2032
- Figure 46: Europe Vitamin E Market Volume Share (%), by Country 2024 & 2032
- Figure 47: Asia Pacific Vitamin E Market Revenue (Million), by Product Type 2024 & 2032
- Figure 48: Asia Pacific Vitamin E Market Volume (K Tons), by Product Type 2024 & 2032
- Figure 49: Asia Pacific Vitamin E Market Revenue Share (%), by Product Type 2024 & 2032
- Figure 50: Asia Pacific Vitamin E Market Volume Share (%), by Product Type 2024 & 2032
- Figure 51: Asia Pacific Vitamin E Market Revenue (Million), by Application 2024 & 2032
- Figure 52: Asia Pacific Vitamin E Market Volume (K Tons), by Application 2024 & 2032
- Figure 53: Asia Pacific Vitamin E Market Revenue Share (%), by Application 2024 & 2032
- Figure 54: Asia Pacific Vitamin E Market Volume Share (%), by Application 2024 & 2032
- Figure 55: Asia Pacific Vitamin E Market Revenue (Million), by Country 2024 & 2032
- Figure 56: Asia Pacific Vitamin E Market Volume (K Tons), by Country 2024 & 2032
- Figure 57: Asia Pacific Vitamin E Market Revenue Share (%), by Country 2024 & 2032
- Figure 58: Asia Pacific Vitamin E Market Volume Share (%), by Country 2024 & 2032
- Figure 59: South America Vitamin E Market Revenue (Million), by Product Type 2024 & 2032
- Figure 60: South America Vitamin E Market Volume (K Tons), by Product Type 2024 & 2032
- Figure 61: South America Vitamin E Market Revenue Share (%), by Product Type 2024 & 2032
- Figure 62: South America Vitamin E Market Volume Share (%), by Product Type 2024 & 2032
- Figure 63: South America Vitamin E Market Revenue (Million), by Application 2024 & 2032
- Figure 64: South America Vitamin E Market Volume (K Tons), by Application 2024 & 2032
- Figure 65: South America Vitamin E Market Revenue Share (%), by Application 2024 & 2032
- Figure 66: South America Vitamin E Market Volume Share (%), by Application 2024 & 2032
- Figure 67: South America Vitamin E Market Revenue (Million), by Country 2024 & 2032
- Figure 68: South America Vitamin E Market Volume (K Tons), by Country 2024 & 2032
- Figure 69: South America Vitamin E Market Revenue Share (%), by Country 2024 & 2032
- Figure 70: South America Vitamin E Market Volume Share (%), by Country 2024 & 2032
- Figure 71: Middle East and Africa Vitamin E Market Revenue (Million), by Product Type 2024 & 2032
- Figure 72: Middle East and Africa Vitamin E Market Volume (K Tons), by Product Type 2024 & 2032
- Figure 73: Middle East and Africa Vitamin E Market Revenue Share (%), by Product Type 2024 & 2032
- Figure 74: Middle East and Africa Vitamin E Market Volume Share (%), by Product Type 2024 & 2032
- Figure 75: Middle East and Africa Vitamin E Market Revenue (Million), by Application 2024 & 2032
- Figure 76: Middle East and Africa Vitamin E Market Volume (K Tons), by Application 2024 & 2032
- Figure 77: Middle East and Africa Vitamin E Market Revenue Share (%), by Application 2024 & 2032
- Figure 78: Middle East and Africa Vitamin E Market Volume Share (%), by Application 2024 & 2032
- Figure 79: Middle East and Africa Vitamin E Market Revenue (Million), by Country 2024 & 2032
- Figure 80: Middle East and Africa Vitamin E Market Volume (K Tons), by Country 2024 & 2032
- Figure 81: Middle East and Africa Vitamin E Market Revenue Share (%), by Country 2024 & 2032
- Figure 82: Middle East and Africa Vitamin E Market Volume Share (%), by Country 2024 & 2032
List of Tables
- Table 1: Global Vitamin E Market Revenue Million Forecast, by Region 2019 & 2032
- Table 2: Global Vitamin E Market Volume K Tons Forecast, by Region 2019 & 2032
- Table 3: Global Vitamin E Market Revenue Million Forecast, by Product Type 2019 & 2032
- Table 4: Global Vitamin E Market Volume K Tons Forecast, by Product Type 2019 & 2032
- Table 5: Global Vitamin E Market Revenue Million Forecast, by Application 2019 & 2032
- Table 6: Global Vitamin E Market Volume K Tons Forecast, by Application 2019 & 2032
- Table 7: Global Vitamin E Market Revenue Million Forecast, by Region 2019 & 2032
- Table 8: Global Vitamin E Market Volume K Tons Forecast, by Region 2019 & 2032
- Table 9: Global Vitamin E Market Revenue Million Forecast, by Country 2019 & 2032
- Table 10: Global Vitamin E Market Volume K Tons Forecast, by Country 2019 & 2032
- Table 11: United States Vitamin E Market Revenue (Million) Forecast, by Application 2019 & 2032
- Table 12: United States Vitamin E Market Volume (K Tons) Forecast, by Application 2019 & 2032
- Table 13: Canada Vitamin E Market Revenue (Million) Forecast, by Application 2019 & 2032
- Table 14: Canada Vitamin E Market Volume (K Tons) Forecast, by Application 2019 & 2032
- Table 15: Mexico Vitamin E Market Revenue (Million) Forecast, by Application 2019 & 2032
- Table 16: Mexico Vitamin E Market Volume (K Tons) Forecast, by Application 2019 & 2032
- Table 17: Rest of North America Vitamin E Market Revenue (Million) Forecast, by Application 2019 & 2032
- Table 18: Rest of North America Vitamin E Market Volume (K Tons) Forecast, by Application 2019 & 2032
- Table 19: Global Vitamin E Market Revenue Million Forecast, by Country 2019 & 2032
- Table 20: Global Vitamin E Market Volume K Tons Forecast, by Country 2019 & 2032
- Table 21: Germany Vitamin E Market Revenue (Million) Forecast, by Application 2019 & 2032
- Table 22: Germany Vitamin E Market Volume (K Tons) Forecast, by Application 2019 & 2032
- Table 23: United Kingdom Vitamin E Market Revenue (Million) Forecast, by Application 2019 & 2032
- Table 24: United Kingdom Vitamin E Market Volume (K Tons) Forecast, by Application 2019 & 2032
- Table 25: France Vitamin E Market Revenue (Million) Forecast, by Application 2019 & 2032
- Table 26: France Vitamin E Market Volume (K Tons) Forecast, by Application 2019 & 2032
- Table 27: Russia Vitamin E Market Revenue (Million) Forecast, by Application 2019 & 2032
- Table 28: Russia Vitamin E Market Volume (K Tons) Forecast, by Application 2019 & 2032
- Table 29: Spain Vitamin E Market Revenue (Million) Forecast, by Application 2019 & 2032
- Table 30: Spain Vitamin E Market Volume (K Tons) Forecast, by Application 2019 & 2032
- Table 31: Italy Vitamin E Market Revenue (Million) Forecast, by Application 2019 & 2032
- Table 32: Italy Vitamin E Market Volume (K Tons) Forecast, by Application 2019 & 2032
- Table 33: Rest of Europe Vitamin E Market Revenue (Million) Forecast, by Application 2019 & 2032
- Table 34: Rest of Europe Vitamin E Market Volume (K Tons) Forecast, by Application 2019 & 2032
- Table 35: Global Vitamin E Market Revenue Million Forecast, by Country 2019 & 2032
- Table 36: Global Vitamin E Market Volume K Tons Forecast, by Country 2019 & 2032
- Table 37: India Vitamin E Market Revenue (Million) Forecast, by Application 2019 & 2032
- Table 38: India Vitamin E Market Volume (K Tons) Forecast, by Application 2019 & 2032
- Table 39: China Vitamin E Market Revenue (Million) Forecast, by Application 2019 & 2032
- Table 40: China Vitamin E Market Volume (K Tons) Forecast, by Application 2019 & 2032
- Table 41: Japan Vitamin E Market Revenue (Million) Forecast, by Application 2019 & 2032
- Table 42: Japan Vitamin E Market Volume (K Tons) Forecast, by Application 2019 & 2032
- Table 43: Australia Vitamin E Market Revenue (Million) Forecast, by Application 2019 & 2032
- Table 44: Australia Vitamin E Market Volume (K Tons) Forecast, by Application 2019 & 2032
- Table 45: Rest of Asia Pacific Vitamin E Market Revenue (Million) Forecast, by Application 2019 & 2032
- Table 46: Rest of Asia Pacific Vitamin E Market Volume (K Tons) Forecast, by Application 2019 & 2032
- Table 47: Global Vitamin E Market Revenue Million Forecast, by Country 2019 & 2032
- Table 48: Global Vitamin E Market Volume K Tons Forecast, by Country 2019 & 2032
- Table 49: Brazil Vitamin E Market Revenue (Million) Forecast, by Application 2019 & 2032
- Table 50: Brazil Vitamin E Market Volume (K Tons) Forecast, by Application 2019 & 2032
- Table 51: Argentina Vitamin E Market Revenue (Million) Forecast, by Application 2019 & 2032
- Table 52: Argentina Vitamin E Market Volume (K Tons) Forecast, by Application 2019 & 2032
- Table 53: Rest of South America Vitamin E Market Revenue (Million) Forecast, by Application 2019 & 2032
- Table 54: Rest of South America Vitamin E Market Volume (K Tons) Forecast, by Application 2019 & 2032
- Table 55: Global Vitamin E Market Revenue Million Forecast, by Country 2019 & 2032
- Table 56: Global Vitamin E Market Volume K Tons Forecast, by Country 2019 & 2032
- Table 57: South Africa Vitamin E Market Revenue (Million) Forecast, by Application 2019 & 2032
- Table 58: South Africa Vitamin E Market Volume (K Tons) Forecast, by Application 2019 & 2032
- Table 59: Saudi Arabia Vitamin E Market Revenue (Million) Forecast, by Application 2019 & 2032
- Table 60: Saudi Arabia Vitamin E Market Volume (K Tons) Forecast, by Application 2019 & 2032
- Table 61: Rest of Middle East and Africa Vitamin E Market Revenue (Million) Forecast, by Application 2019 & 2032
- Table 62: Rest of Middle East and Africa Vitamin E Market Volume (K Tons) Forecast, by Application 2019 & 2032
- Table 63: Global Vitamin E Market Revenue Million Forecast, by Product Type 2019 & 2032
- Table 64: Global Vitamin E Market Volume K Tons Forecast, by Product Type 2019 & 2032
- Table 65: Global Vitamin E Market Revenue Million Forecast, by Application 2019 & 2032
- Table 66: Global Vitamin E Market Volume K Tons Forecast, by Application 2019 & 2032
- Table 67: Global Vitamin E Market Revenue Million Forecast, by Country 2019 & 2032
- Table 68: Global Vitamin E Market Volume K Tons Forecast, by Country 2019 & 2032
- Table 69: United States Vitamin E Market Revenue (Million) Forecast, by Application 2019 & 2032
- Table 70: United States Vitamin E Market Volume (K Tons) Forecast, by Application 2019 & 2032
- Table 71: Canada Vitamin E Market Revenue (Million) Forecast, by Application 2019 & 2032
- Table 72: Canada Vitamin E Market Volume (K Tons) Forecast, by Application 2019 & 2032
- Table 73: Mexico Vitamin E Market Revenue (Million) Forecast, by Application 2019 & 2032
- Table 74: Mexico Vitamin E Market Volume (K Tons) Forecast, by Application 2019 & 2032
- Table 75: Rest of North America Vitamin E Market Revenue (Million) Forecast, by Application 2019 & 2032
- Table 76: Rest of North America Vitamin E Market Volume (K Tons) Forecast, by Application 2019 & 2032
- Table 77: Global Vitamin E Market Revenue Million Forecast, by Product Type 2019 & 2032
- Table 78: Global Vitamin E Market Volume K Tons Forecast, by Product Type 2019 & 2032
- Table 79: Global Vitamin E Market Revenue Million Forecast, by Application 2019 & 2032
- Table 80: Global Vitamin E Market Volume K Tons Forecast, by Application 2019 & 2032
- Table 81: Global Vitamin E Market Revenue Million Forecast, by Country 2019 & 2032
- Table 82: Global Vitamin E Market Volume K Tons Forecast, by Country 2019 & 2032
- Table 83: Germany Vitamin E Market Revenue (Million) Forecast, by Application 2019 & 2032
- Table 84: Germany Vitamin E Market Volume (K Tons) Forecast, by Application 2019 & 2032
- Table 85: United Kingdom Vitamin E Market Revenue (Million) Forecast, by Application 2019 & 2032
- Table 86: United Kingdom Vitamin E Market Volume (K Tons) Forecast, by Application 2019 & 2032
- Table 87: France Vitamin E Market Revenue (Million) Forecast, by Application 2019 & 2032
- Table 88: France Vitamin E Market Volume (K Tons) Forecast, by Application 2019 & 2032
- Table 89: Russia Vitamin E Market Revenue (Million) Forecast, by Application 2019 & 2032
- Table 90: Russia Vitamin E Market Volume (K Tons) Forecast, by Application 2019 & 2032
- Table 91: Spain Vitamin E Market Revenue (Million) Forecast, by Application 2019 & 2032
- Table 92: Spain Vitamin E Market Volume (K Tons) Forecast, by Application 2019 & 2032
- Table 93: Italy Vitamin E Market Revenue (Million) Forecast, by Application 2019 & 2032
- Table 94: Italy Vitamin E Market Volume (K Tons) Forecast, by Application 2019 & 2032
- Table 95: Rest of Europe Vitamin E Market Revenue (Million) Forecast, by Application 2019 & 2032
- Table 96: Rest of Europe Vitamin E Market Volume (K Tons) Forecast, by Application 2019 & 2032
- Table 97: Global Vitamin E Market Revenue Million Forecast, by Product Type 2019 & 2032
- Table 98: Global Vitamin E Market Volume K Tons Forecast, by Product Type 2019 & 2032
- Table 99: Global Vitamin E Market Revenue Million Forecast, by Application 2019 & 2032
- Table 100: Global Vitamin E Market Volume K Tons Forecast, by Application 2019 & 2032
- Table 101: Global Vitamin E Market Revenue Million Forecast, by Country 2019 & 2032
- Table 102: Global Vitamin E Market Volume K Tons Forecast, by Country 2019 & 2032
- Table 103: India Vitamin E Market Revenue (Million) Forecast, by Application 2019 & 2032
- Table 104: India Vitamin E Market Volume (K Tons) Forecast, by Application 2019 & 2032
- Table 105: China Vitamin E Market Revenue (Million) Forecast, by Application 2019 & 2032
- Table 106: China Vitamin E Market Volume (K Tons) Forecast, by Application 2019 & 2032
- Table 107: Japan Vitamin E Market Revenue (Million) Forecast, by Application 2019 & 2032
- Table 108: Japan Vitamin E Market Volume (K Tons) Forecast, by Application 2019 & 2032
- Table 109: Australia Vitamin E Market Revenue (Million) Forecast, by Application 2019 & 2032
- Table 110: Australia Vitamin E Market Volume (K Tons) Forecast, by Application 2019 & 2032
- Table 111: Rest of Asia Pacific Vitamin E Market Revenue (Million) Forecast, by Application 2019 & 2032
- Table 112: Rest of Asia Pacific Vitamin E Market Volume (K Tons) Forecast, by Application 2019 & 2032
- Table 113: Global Vitamin E Market Revenue Million Forecast, by Product Type 2019 & 2032
- Table 114: Global Vitamin E Market Volume K Tons Forecast, by Product Type 2019 & 2032
- Table 115: Global Vitamin E Market Revenue Million Forecast, by Application 2019 & 2032
- Table 116: Global Vitamin E Market Volume K Tons Forecast, by Application 2019 & 2032
- Table 117: Global Vitamin E Market Revenue Million Forecast, by Country 2019 & 2032
- Table 118: Global Vitamin E Market Volume K Tons Forecast, by Country 2019 & 2032
- Table 119: Brazil Vitamin E Market Revenue (Million) Forecast, by Application 2019 & 2032
- Table 120: Brazil Vitamin E Market Volume (K Tons) Forecast, by Application 2019 & 2032
- Table 121: Argentina Vitamin E Market Revenue (Million) Forecast, by Application 2019 & 2032
- Table 122: Argentina Vitamin E Market Volume (K Tons) Forecast, by Application 2019 & 2032
- Table 123: Rest of South America Vitamin E Market Revenue (Million) Forecast, by Application 2019 & 2032
- Table 124: Rest of South America Vitamin E Market Volume (K Tons) Forecast, by Application 2019 & 2032
- Table 125: Global Vitamin E Market Revenue Million Forecast, by Product Type 2019 & 2032
- Table 126: Global Vitamin E Market Volume K Tons Forecast, by Product Type 2019 & 2032
- Table 127: Global Vitamin E Market Revenue Million Forecast, by Application 2019 & 2032
- Table 128: Global Vitamin E Market Volume K Tons Forecast, by Application 2019 & 2032
- Table 129: Global Vitamin E Market Revenue Million Forecast, by Country 2019 & 2032
- Table 130: Global Vitamin E Market Volume K Tons Forecast, by Country 2019 & 2032
- Table 131: South Africa Vitamin E Market Revenue (Million) Forecast, by Application 2019 & 2032
- Table 132: South Africa Vitamin E Market Volume (K Tons) Forecast, by Application 2019 & 2032
- Table 133: Saudi Arabia Vitamin E Market Revenue (Million) Forecast, by Application 2019 & 2032
- Table 134: Saudi Arabia Vitamin E Market Volume (K Tons) Forecast, by Application 2019 & 2032
- Table 135: Rest of Middle East and Africa Vitamin E Market Revenue (Million) Forecast, by Application 2019 & 2032
- Table 136: Rest of Middle East and Africa Vitamin E Market Volume (K Tons) Forecast, by Application 2019 & 2032
Frequently Asked Questions
1. What is the projected Compound Annual Growth Rate (CAGR) of the Vitamin E Market?
The projected CAGR is approximately 4.01%.
2. Which companies are prominent players in the Vitamin E Market?
Key companies in the market include Prinova Group LLC, Merck KGaA, Orah Nutrichem, Archer Daniels Midland Company, BASF SE, Aryan International, Koninklijke DSM NV, The Bountiful Company*List Not Exhaustive, Jilin Beisha Pharmaceutical Co Ltd, BTSA Biotecnologías Aplicadas SL.
3. What are the main segments of the Vitamin E Market?
The market segments include Product Type, Application.
4. Can you provide details about the market size?
The market size is estimated to be USD 3924.44 Million as of 2022.
5. What are some drivers contributing to market growth?
Awareness of Health Benefits Associated with Tocotrienol; Escalating Demand for Anti-Aging Products Containing Tocotrienol.
6. What are the notable trends driving market growth?
Increasing Demand for Vitamin E in Various Applications.
7. Are there any restraints impacting market growth?
Availability of Substitutes.
8. Can you provide examples of recent developments in the market?
December 2021: The Kensing company announced its partnership with Azelis for a better and more feasible distribution of vegetable oils, vitamins, and personal care products in Europe and the Middle East and Africa. Azelis has a strong distribution network across these regions in the B2B segment. The company mainly aims to distribute its mainstream products Covi-ox, Covitol, Copherol, and Generol.
9. What pricing options are available for accessing the report?
Pricing options include single-user, multi-user, and enterprise licenses priced at USD 4750, USD 5250, and USD 8750 respectively.
10. Is the market size provided in terms of value or volume?
The market size is provided in terms of value, measured in Million and volume, measured in K Tons.
11. Are there any specific market keywords associated with the report?
Yes, the market keyword associated with the report is "Vitamin E Market," which aids in identifying and referencing the specific market segment covered.
12. How do I determine which pricing option suits my needs best?
The pricing options vary based on user requirements and access needs. Individual users may opt for single-user licenses, while businesses requiring broader access may choose multi-user or enterprise licenses for cost-effective access to the report.
13. Are there any additional resources or data provided in the Vitamin E Market report?
While the report offers comprehensive insights, it's advisable to review the specific contents or supplementary materials provided to ascertain if additional resources or data are available.
14. How can I stay updated on further developments or reports in the Vitamin E Market?
To stay informed about further developments, trends, and reports in the Vitamin E Market, consider subscribing to industry newsletters, following relevant companies and organizations, or regularly checking reputable industry news sources and publications.
Methodology
Step 1 - Identification of Relevant Samples Size from Population Database


Step 2 - Approaches for Defining Global Market Size (Value, Volume* & Price*)

Note*: In applicable scenarios
Step 3 - Data Sources
Primary Research
- Web Analytics
- Survey Reports
- Research Institute
- Latest Research Reports
- Opinion Leaders
Secondary Research
- Annual Reports
- White Paper
- Latest Press Release
- Industry Association
- Paid Database
- Investor Presentations

Step 4 - Data Triangulation
Involves using different sources of information in order to increase the validity of a study
These sources are likely to be stakeholders in a program - participants, other researchers, program staff, other community members, and so on.
Then we put all data in single framework & apply various statistical tools to find out the dynamic on the market.
During the analysis stage, feedback from the stakeholder groups would be compared to determine areas of agreement as well as areas of divergence
