

Key Insights
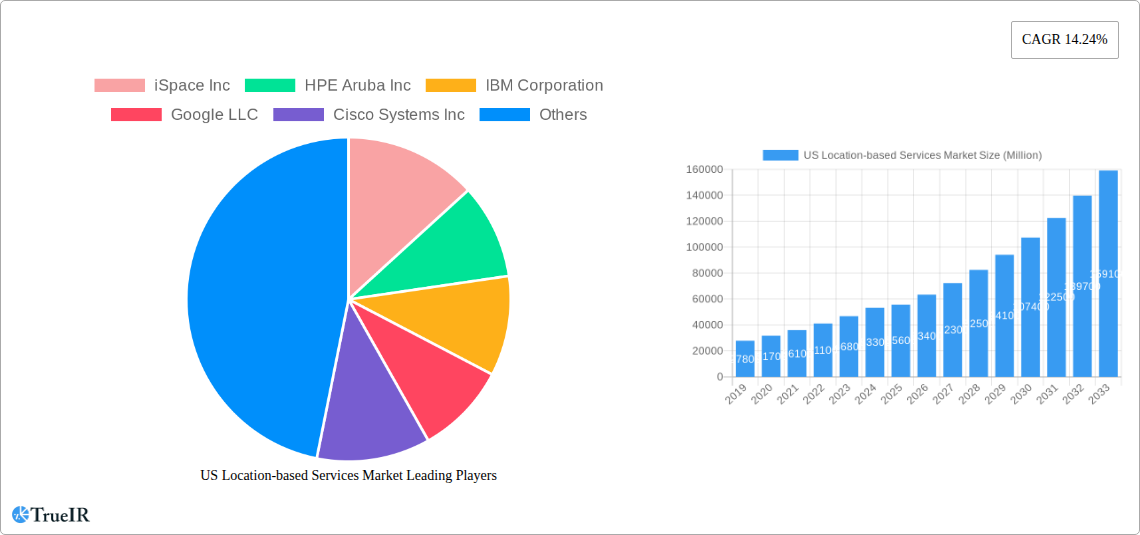
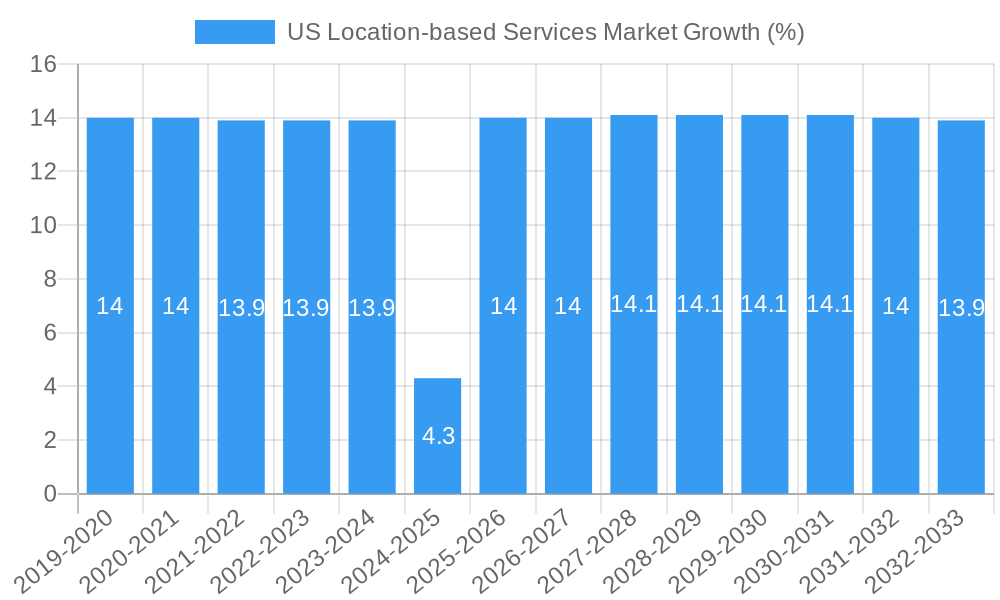
The US Location-based Services (LBS) market is poised for robust expansion, projecting a substantial market size of approximately $55,600 million in 2025. This growth is fueled by an impressive Compound Annual Growth Rate (CAGR) of 14.24%, indicating strong investor confidence and increasing adoption across various sectors. Key drivers of this surge include the escalating demand for real-time data, the widespread integration of LBS in mobile applications, and the continuous evolution of technologies such as 5G, IoT, and AI. These advancements are enabling more accurate, efficient, and feature-rich location-based solutions, making them indispensable for businesses seeking to understand customer behavior, optimize operations, and deliver personalized experiences. The market's dynamism is further underscored by significant trends such as the rise of hyper-local advertising, the growing use of LBS in smart cities, and the increasing need for precise indoor navigation in complex environments like airports and large retail spaces.
The competitive landscape is characterized by the presence of major technology players and specialized LBS providers, all vying for market share through innovation and strategic partnerships. The segmentation of the LBS market reveals a balanced distribution across components, with Hardware, Software, and Services all playing crucial roles. In terms of applications, Mapping and Navigation, Business Intelligence and Analytics, and Location-based Advertising are expected to dominate. The Transportation and Logistics, IT and Telecom, and Healthcare sectors are identified as key end-users, leveraging LBS for enhanced tracking, data analysis, and service delivery. While the market exhibits strong growth potential, potential restraints such as data privacy concerns and the need for robust infrastructure in certain areas may present challenges. However, the overall trajectory points towards sustained growth and widespread integration of LBS into daily life and business operations throughout the forecast period.
US Location-based Services Market: Comprehensive Analysis and Forecast (2019–2033)
Gain unparalleled insights into the dynamic US Location-based Services Market with this in-depth report. Covering the historical period (2019-2024), base year (2025), estimated year (2025), and an extensive forecast period (2025-2033), this report delivers a granular analysis of market size, trends, opportunities, and competitive strategies. Leverage high-volume keywords like "location-based services," "GPS technology," "indoor positioning," "outdoor navigation," "business intelligence," "location analytics," and "telematics" to enhance your market understanding and strategic planning.
US Location-based Services Market Market Structure & Competitive Landscape
The US Location-based Services Market is characterized by moderate to high concentration, driven by intense innovation and strategic acquisitions. Key players are investing heavily in research and development to enhance accuracy, expand coverage, and integrate advanced analytics. The market faces increasing regulatory scrutiny concerning data privacy and security, prompting companies to adopt robust compliance measures. Product substitutes, such as inertial navigation systems and Wi-Fi triangulation, are emerging, although they often complement rather than replace established GPS-based solutions. End-user segmentation reveals a diverse adoption landscape, with transportation and logistics, IT and telecom, and healthcare emerging as dominant sectors. Mergers and acquisitions are a significant trend, with larger entities acquiring innovative startups to bolster their technological portfolios and market reach. For instance, the market exhibits an estimated XX% concentration ratio among the top five players, with over $1,500 Million in M&A activities recorded during the historical period.
US Location-based Services Market Market Trends & Opportunities
The US Location-based Services Market is poised for substantial growth, projected to reach an estimated $55,000 Million by 2033, exhibiting a Compound Annual Growth Rate (CAGR) of approximately 18.5% from 2025. This expansion is fueled by the pervasive integration of location-aware technologies across an ever-increasing array of applications. Technological shifts are primarily driven by advancements in Artificial Intelligence (AI) and Machine Learning (ML), enabling more sophisticated data analysis and personalized user experiences. The increasing adoption of 5G networks further accelerates the deployment of real-time location services, offering lower latency and higher bandwidth for complex applications. Consumer preferences are increasingly leaning towards hyper-personalized services, from location-based advertising and targeted promotions to enhanced navigation and location-based gaming. Competitive dynamics are evolving, with a growing emphasis on data monetization, strategic partnerships, and the development of specialized solutions for niche markets. The market penetration rate for location-based services in mobile devices is estimated to exceed 95% by 2025. Opportunities abound in the development of robust indoor positioning systems, critical for smart buildings, retail analytics, and asset tracking in complex environments. Furthermore, the growing demand for real-time data in supply chain management and autonomous vehicle development presents significant growth avenues.
Dominant Markets & Segments in US Location-based Services Market
The Outdoor location segment is currently the most dominant within the US Location-based Services Market, driven by the widespread use of GPS and its integration into countless applications. This dominance is closely followed by the burgeoning Indoor positioning segment, which is experiencing rapid growth due to the proliferation of smart cities, advanced retail analytics, and the need for precise asset tracking in industrial and healthcare settings.
From a Component perspective, Software solutions are projected to exhibit the highest growth rate, largely due to the increasing demand for sophisticated data analytics, AI-powered insights, and platform integration. However, Hardware, encompassing advanced sensors, beacons, and connectivity devices, remains a foundational element and a significant market contributor.
In terms of Applications, Mapping and Navigation continues to be a primary driver, but Business Intelligence and Analytics is rapidly gaining traction as organizations leverage location data for operational efficiency, customer insights, and strategic decision-making. Location-based Advertising also holds significant market share, driven by the ability to deliver highly targeted and contextually relevant marketing campaigns.
The Transportation and Logistics end-user segment leads in adoption, benefiting from real-time fleet tracking, route optimization, and supply chain visibility. The IT and Telecom sector is also a major consumer, utilizing location services for network management and customer service. The Healthcare industry is increasingly adopting location-based services for patient tracking, asset management, and emergency response.
- Key Growth Drivers for Outdoor Location:
- Ubiquitous smartphone penetration.
- Advancements in satellite technology and network infrastructure.
- Growing demand for navigation and geospatial services.
- Key Growth Drivers for Indoor Location:
- Rise of the Internet of Things (IoT) and smart building initiatives.
- Demand for precise asset and personnel tracking in complex environments.
- Technological advancements in Wi-Fi, Bluetooth, and ultra-wideband (UWB) technologies.
- Key Growth Drivers for Software Component:
- Increasing complexity of data analytics and AI integration.
- Demand for scalable and customizable location-based platforms.
- Growing need for real-time data processing and visualization.
- Key Growth Drivers for Business Intelligence and Analytics Application:
- Organizational focus on data-driven decision-making.
- Need for understanding customer behavior and optimizing operations.
- Development of advanced geospatial analytics tools.
- Key Growth Drivers for Transportation and Logistics End-User:
- Globalized supply chains and the need for real-time visibility.
- Demand for efficient fleet management and route optimization.
- Growth of e-commerce and last-mile delivery services.
US Location-based Services Market Product Analysis
The US Location-based Services Market is characterized by a continuous stream of product innovations focused on enhancing accuracy, reducing latency, and expanding capabilities. Advancements in sensor fusion, AI algorithms, and edge computing are enabling the development of sophisticated solutions for both indoor and outdoor environments. These products offer significant competitive advantages by providing precise real-time data, personalized user experiences, and actionable insights. Key technological advancements include the integration of multi-constellation GNSS receivers for improved reliability, the development of advanced mapping engines, and the creation of intelligent location-aware platforms that can process and analyze vast amounts of geospatial data. The market fit for these products is exceptionally strong across diverse industries, from enhancing autonomous vehicle navigation to optimizing retail customer journeys and improving emergency response times.
Key Drivers, Barriers & Challenges in US Location-based Services Market
The US Location-based Services Market is propelled by several key drivers. Technological advancements, including the proliferation of 5G, AI, and IoT, are foundational. Economic factors such as the growing demand for data analytics and personalized services fuel adoption. Policy-driven initiatives, such as those promoting public safety and efficient infrastructure management, also contribute significantly. For instance, the ongoing development of smart city infrastructure and the mandate for enhanced 911 services are critical growth catalysts.
However, the market faces significant challenges. Regulatory hurdles, particularly around data privacy and security (e.g., GDPR and CCPA compliance), can impede deployment and innovation. Supply chain issues, impacting the availability of specialized hardware components, can lead to delays and increased costs. Competitive pressures from established players and emerging startups necessitate continuous innovation and strategic differentiation. For example, the estimated cost of non-compliance with data privacy regulations can range from hundreds of thousands to millions of dollars in fines.
Growth Drivers in the US Location-based Services Market Market
Key growth drivers in the US Location-based Services Market are multifaceted. Technological innovation is paramount, with the maturation of 5G networks enabling real-time, high-precision location data transmission crucial for autonomous systems and augmented reality. Economic imperatives for businesses to gain deeper customer insights and optimize operational efficiencies are significant. Furthermore, favorable regulatory environments that encourage the adoption of location technologies for public safety, smart city development, and infrastructure management are crucial. For example, government investments in smart city initiatives are a direct catalyst for market expansion.
Challenges Impacting US Location-based Services Market Growth
Challenges impacting US Location-based Services Market growth are notable. Data privacy and security concerns remain a significant barrier, with stringent regulations like the CCPA requiring substantial compliance efforts and investment, potentially costing companies millions in legal and technical overhauls. Supply chain disruptions, particularly for specialized semiconductor components and advanced sensors, can lead to production delays and increased manufacturing costs, impacting product availability. Intense competitive pressures from both established technology giants and agile startups necessitate continuous innovation and strategic partnerships, creating a challenging landscape for smaller players to gain significant market share.
Key Players Shaping the US Location-based Services Market Market
- iSpace Inc
- HPE Aruba Inc
- IBM Corporation
- Google LLC
- Cisco Systems Inc
- ESRI Inc
- DigitalGlobe Inc (Maxar Technologies)
- Zebra Technologies Corporation
- Qaulcomm Incoporated
- CenTrak
Significant US Location-based Services Market Industry Milestones
- June 2023: The Air Force Research Laboratory (AFRL) formed a strategic partnership with Luminous Cyber Corp. to develop a highly resilient alternative to GPS, addressing unreliable GPS coverage and susceptibility to interference. This initiative is crucial for critical infrastructure and military applications.
- September 2022: Hot Pepper Mobile and NextNav announced an agreement to integrate NextNav's Pinnacle vertical location technology into Hot Pepper Mobile's feature phones. This collaboration enhances z-axis geolocation capabilities, vital for 911 emergency services, search and rescue, and lone employee safety.
Future Outlook for US Location-based Services Market Market
The future outlook for the US Location-based Services Market is exceptionally promising, driven by several key growth catalysts. The continued expansion of the Internet of Things (IoT) ecosystem will generate an unprecedented volume of location data, fueling demand for sophisticated analytics and real-time services. Advancements in AI and machine learning will further refine location-based insights, enabling hyper-personalization and predictive capabilities across all sectors. The burgeoning development of autonomous vehicles, smart cities, and advanced augmented reality applications will create entirely new markets and demand for highly accurate and reliable location technologies. Strategic opportunities lie in developing integrated solutions that seamlessly combine indoor and outdoor positioning, addressing complex use cases in healthcare, logistics, and retail. The market potential is immense, projected to witness continued robust growth as location intelligence becomes an indispensable component of modern business operations and consumer experiences.
US Location-based Services Market Segmentation
-
1. Component
- 1.1. Hardware
- 1.2. Software
- 1.3. Services
-
2. Location
- 2.1. Indoor
- 2.2. Outdoor
-
3. Application
- 3.1. Mapping and Navigation
- 3.2. Business Intelligence and Analytics
- 3.3. Location-based Advertising
- 3.4. Social Networking and Entertainment
- 3.5. Other Applications
-
4. End-User
- 4.1. Transportation and Logistics
- 4.2. IT and Telecom
- 4.3. Healthcare
- 4.4. Government
- 4.5. BFSI
- 4.6. Hospitality
- 4.7. Manufacturing
- 4.8. Other End-Users
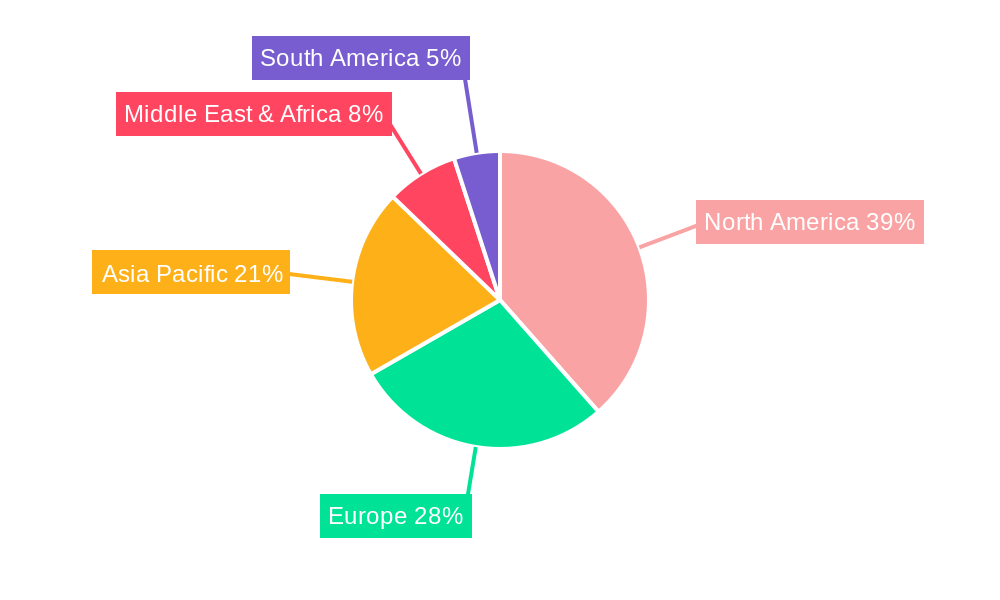
US Location-based Services Market Segmentation By Geography
-
1. North America
- 1.1. United States
- 1.2. Canada
- 1.3. Mexico
-
2. South America
- 2.1. Brazil
- 2.2. Argentina
- 2.3. Rest of South America
-
3. Europe
- 3.1. United Kingdom
- 3.2. Germany
- 3.3. France
- 3.4. Italy
- 3.5. Spain
- 3.6. Russia
- 3.7. Benelux
- 3.8. Nordics
- 3.9. Rest of Europe
-
4. Middle East & Africa
- 4.1. Turkey
- 4.2. Israel
- 4.3. GCC
- 4.4. North Africa
- 4.5. South Africa
- 4.6. Rest of Middle East & Africa
-
5. Asia Pacific
- 5.1. China
- 5.2. India
- 5.3. Japan
- 5.4. South Korea
- 5.5. ASEAN
- 5.6. Oceania
- 5.7. Rest of Asia Pacific
US Location-based Services Market REPORT HIGHLIGHTS
| Aspects | Details |
|---|---|
| Study Period | 2019-2033 |
| Base Year | 2024 |
| Estimated Year | 2025 |
| Forecast Period | 2025-2033 |
| Historical Period | 2019-2024 |
| Growth Rate | CAGR of 14.24% from 2019-2033 |
| Segmentation |
|
Table of Contents
- 1. Introduction
- 1.1. Research Scope
- 1.2. Market Segmentation
- 1.3. Research Methodology
- 1.4. Definitions and Assumptions
- 2. Executive Summary
- 2.1. Introduction
- 3. Market Dynamics
- 3.1. Introduction
- 3.2. Market Drivers
- 3.2.1. Surge in demand for LBS (Location-Based Service) and RTLS (Real-Time Location Systems) for industry applications; Growing Demand for Geo-based Marketing
- 3.3. Market Restrains
- 3.3.1. High installation and maintenance cost hampers market growth
- 3.4. Market Trends
- 3.4.1. Indoor Location Segment is Expected to Hold Significant Share of the Market
- 4. Market Factor Analysis
- 4.1. Porters Five Forces
- 4.2. Supply/Value Chain
- 4.3. PESTEL analysis
- 4.4. Market Entropy
- 4.5. Patent/Trademark Analysis
- 5. Global US Location-based Services Market Analysis, Insights and Forecast, 2019-2031
- 5.1. Market Analysis, Insights and Forecast - by Component
- 5.1.1. Hardware
- 5.1.2. Software
- 5.1.3. Services
- 5.2. Market Analysis, Insights and Forecast - by Location
- 5.2.1. Indoor
- 5.2.2. Outdoor
- 5.3. Market Analysis, Insights and Forecast - by Application
- 5.3.1. Mapping and Navigation
- 5.3.2. Business Intelligence and Analytics
- 5.3.3. Location-based Advertising
- 5.3.4. Social Networking and Entertainment
- 5.3.5. Other Applications
- 5.4. Market Analysis, Insights and Forecast - by End-User
- 5.4.1. Transportation and Logistics
- 5.4.2. IT and Telecom
- 5.4.3. Healthcare
- 5.4.4. Government
- 5.4.5. BFSI
- 5.4.6. Hospitality
- 5.4.7. Manufacturing
- 5.4.8. Other End-Users
- 5.5. Market Analysis, Insights and Forecast - by Region
- 5.5.1. North America
- 5.5.2. South America
- 5.5.3. Europe
- 5.5.4. Middle East & Africa
- 5.5.5. Asia Pacific
- 5.1. Market Analysis, Insights and Forecast - by Component
- 6. North America US Location-based Services Market Analysis, Insights and Forecast, 2019-2031
- 6.1. Market Analysis, Insights and Forecast - by Component
- 6.1.1. Hardware
- 6.1.2. Software
- 6.1.3. Services
- 6.2. Market Analysis, Insights and Forecast - by Location
- 6.2.1. Indoor
- 6.2.2. Outdoor
- 6.3. Market Analysis, Insights and Forecast - by Application
- 6.3.1. Mapping and Navigation
- 6.3.2. Business Intelligence and Analytics
- 6.3.3. Location-based Advertising
- 6.3.4. Social Networking and Entertainment
- 6.3.5. Other Applications
- 6.4. Market Analysis, Insights and Forecast - by End-User
- 6.4.1. Transportation and Logistics
- 6.4.2. IT and Telecom
- 6.4.3. Healthcare
- 6.4.4. Government
- 6.4.5. BFSI
- 6.4.6. Hospitality
- 6.4.7. Manufacturing
- 6.4.8. Other End-Users
- 6.1. Market Analysis, Insights and Forecast - by Component
- 7. South America US Location-based Services Market Analysis, Insights and Forecast, 2019-2031
- 7.1. Market Analysis, Insights and Forecast - by Component
- 7.1.1. Hardware
- 7.1.2. Software
- 7.1.3. Services
- 7.2. Market Analysis, Insights and Forecast - by Location
- 7.2.1. Indoor
- 7.2.2. Outdoor
- 7.3. Market Analysis, Insights and Forecast - by Application
- 7.3.1. Mapping and Navigation
- 7.3.2. Business Intelligence and Analytics
- 7.3.3. Location-based Advertising
- 7.3.4. Social Networking and Entertainment
- 7.3.5. Other Applications
- 7.4. Market Analysis, Insights and Forecast - by End-User
- 7.4.1. Transportation and Logistics
- 7.4.2. IT and Telecom
- 7.4.3. Healthcare
- 7.4.4. Government
- 7.4.5. BFSI
- 7.4.6. Hospitality
- 7.4.7. Manufacturing
- 7.4.8. Other End-Users
- 7.1. Market Analysis, Insights and Forecast - by Component
- 8. Europe US Location-based Services Market Analysis, Insights and Forecast, 2019-2031
- 8.1. Market Analysis, Insights and Forecast - by Component
- 8.1.1. Hardware
- 8.1.2. Software
- 8.1.3. Services
- 8.2. Market Analysis, Insights and Forecast - by Location
- 8.2.1. Indoor
- 8.2.2. Outdoor
- 8.3. Market Analysis, Insights and Forecast - by Application
- 8.3.1. Mapping and Navigation
- 8.3.2. Business Intelligence and Analytics
- 8.3.3. Location-based Advertising
- 8.3.4. Social Networking and Entertainment
- 8.3.5. Other Applications
- 8.4. Market Analysis, Insights and Forecast - by End-User
- 8.4.1. Transportation and Logistics
- 8.4.2. IT and Telecom
- 8.4.3. Healthcare
- 8.4.4. Government
- 8.4.5. BFSI
- 8.4.6. Hospitality
- 8.4.7. Manufacturing
- 8.4.8. Other End-Users
- 8.1. Market Analysis, Insights and Forecast - by Component
- 9. Middle East & Africa US Location-based Services Market Analysis, Insights and Forecast, 2019-2031
- 9.1. Market Analysis, Insights and Forecast - by Component
- 9.1.1. Hardware
- 9.1.2. Software
- 9.1.3. Services
- 9.2. Market Analysis, Insights and Forecast - by Location
- 9.2.1. Indoor
- 9.2.2. Outdoor
- 9.3. Market Analysis, Insights and Forecast - by Application
- 9.3.1. Mapping and Navigation
- 9.3.2. Business Intelligence and Analytics
- 9.3.3. Location-based Advertising
- 9.3.4. Social Networking and Entertainment
- 9.3.5. Other Applications
- 9.4. Market Analysis, Insights and Forecast - by End-User
- 9.4.1. Transportation and Logistics
- 9.4.2. IT and Telecom
- 9.4.3. Healthcare
- 9.4.4. Government
- 9.4.5. BFSI
- 9.4.6. Hospitality
- 9.4.7. Manufacturing
- 9.4.8. Other End-Users
- 9.1. Market Analysis, Insights and Forecast - by Component
- 10. Asia Pacific US Location-based Services Market Analysis, Insights and Forecast, 2019-2031
- 10.1. Market Analysis, Insights and Forecast - by Component
- 10.1.1. Hardware
- 10.1.2. Software
- 10.1.3. Services
- 10.2. Market Analysis, Insights and Forecast - by Location
- 10.2.1. Indoor
- 10.2.2. Outdoor
- 10.3. Market Analysis, Insights and Forecast - by Application
- 10.3.1. Mapping and Navigation
- 10.3.2. Business Intelligence and Analytics
- 10.3.3. Location-based Advertising
- 10.3.4. Social Networking and Entertainment
- 10.3.5. Other Applications
- 10.4. Market Analysis, Insights and Forecast - by End-User
- 10.4.1. Transportation and Logistics
- 10.4.2. IT and Telecom
- 10.4.3. Healthcare
- 10.4.4. Government
- 10.4.5. BFSI
- 10.4.6. Hospitality
- 10.4.7. Manufacturing
- 10.4.8. Other End-Users
- 10.1. Market Analysis, Insights and Forecast - by Component
- 11. Northeast US Location-based Services Market Analysis, Insights and Forecast, 2019-2031
- 12. Southeast US Location-based Services Market Analysis, Insights and Forecast, 2019-2031
- 13. Midwest US Location-based Services Market Analysis, Insights and Forecast, 2019-2031
- 14. Southwest US Location-based Services Market Analysis, Insights and Forecast, 2019-2031
- 15. West US Location-based Services Market Analysis, Insights and Forecast, 2019-2031
- 16. Competitive Analysis
- 16.1. Global Market Share Analysis 2024
- 16.2. Company Profiles
- 16.2.1 iSpace Inc
- 16.2.1.1. Overview
- 16.2.1.2. Products
- 16.2.1.3. SWOT Analysis
- 16.2.1.4. Recent Developments
- 16.2.1.5. Financials (Based on Availability)
- 16.2.2 HPE Aruba Inc
- 16.2.2.1. Overview
- 16.2.2.2. Products
- 16.2.2.3. SWOT Analysis
- 16.2.2.4. Recent Developments
- 16.2.2.5. Financials (Based on Availability)
- 16.2.3 IBM Corporation
- 16.2.3.1. Overview
- 16.2.3.2. Products
- 16.2.3.3. SWOT Analysis
- 16.2.3.4. Recent Developments
- 16.2.3.5. Financials (Based on Availability)
- 16.2.4 Google LLC
- 16.2.4.1. Overview
- 16.2.4.2. Products
- 16.2.4.3. SWOT Analysis
- 16.2.4.4. Recent Developments
- 16.2.4.5. Financials (Based on Availability)
- 16.2.5 Cisco Systems Inc
- 16.2.5.1. Overview
- 16.2.5.2. Products
- 16.2.5.3. SWOT Analysis
- 16.2.5.4. Recent Developments
- 16.2.5.5. Financials (Based on Availability)
- 16.2.6 ESRI Inc*List Not Exhaustive
- 16.2.6.1. Overview
- 16.2.6.2. Products
- 16.2.6.3. SWOT Analysis
- 16.2.6.4. Recent Developments
- 16.2.6.5. Financials (Based on Availability)
- 16.2.7 DigitalGlobe Inc (Maxar Technologies)
- 16.2.7.1. Overview
- 16.2.7.2. Products
- 16.2.7.3. SWOT Analysis
- 16.2.7.4. Recent Developments
- 16.2.7.5. Financials (Based on Availability)
- 16.2.8 Zebra Technologies Corporation
- 16.2.8.1. Overview
- 16.2.8.2. Products
- 16.2.8.3. SWOT Analysis
- 16.2.8.4. Recent Developments
- 16.2.8.5. Financials (Based on Availability)
- 16.2.9 Qaulcomm Incoporated
- 16.2.9.1. Overview
- 16.2.9.2. Products
- 16.2.9.3. SWOT Analysis
- 16.2.9.4. Recent Developments
- 16.2.9.5. Financials (Based on Availability)
- 16.2.10 CenTrak
- 16.2.10.1. Overview
- 16.2.10.2. Products
- 16.2.10.3. SWOT Analysis
- 16.2.10.4. Recent Developments
- 16.2.10.5. Financials (Based on Availability)
- 16.2.1 iSpace Inc
List of Figures
- Figure 1: Global US Location-based Services Market Revenue Breakdown (Million, %) by Region 2024 & 2032
- Figure 2: United states US Location-based Services Market Revenue (Million), by Country 2024 & 2032
- Figure 3: United states US Location-based Services Market Revenue Share (%), by Country 2024 & 2032
- Figure 4: North America US Location-based Services Market Revenue (Million), by Component 2024 & 2032
- Figure 5: North America US Location-based Services Market Revenue Share (%), by Component 2024 & 2032
- Figure 6: North America US Location-based Services Market Revenue (Million), by Location 2024 & 2032
- Figure 7: North America US Location-based Services Market Revenue Share (%), by Location 2024 & 2032
- Figure 8: North America US Location-based Services Market Revenue (Million), by Application 2024 & 2032
- Figure 9: North America US Location-based Services Market Revenue Share (%), by Application 2024 & 2032
- Figure 10: North America US Location-based Services Market Revenue (Million), by End-User 2024 & 2032
- Figure 11: North America US Location-based Services Market Revenue Share (%), by End-User 2024 & 2032
- Figure 12: North America US Location-based Services Market Revenue (Million), by Country 2024 & 2032
- Figure 13: North America US Location-based Services Market Revenue Share (%), by Country 2024 & 2032
- Figure 14: South America US Location-based Services Market Revenue (Million), by Component 2024 & 2032
- Figure 15: South America US Location-based Services Market Revenue Share (%), by Component 2024 & 2032
- Figure 16: South America US Location-based Services Market Revenue (Million), by Location 2024 & 2032
- Figure 17: South America US Location-based Services Market Revenue Share (%), by Location 2024 & 2032
- Figure 18: South America US Location-based Services Market Revenue (Million), by Application 2024 & 2032
- Figure 19: South America US Location-based Services Market Revenue Share (%), by Application 2024 & 2032
- Figure 20: South America US Location-based Services Market Revenue (Million), by End-User 2024 & 2032
- Figure 21: South America US Location-based Services Market Revenue Share (%), by End-User 2024 & 2032
- Figure 22: South America US Location-based Services Market Revenue (Million), by Country 2024 & 2032
- Figure 23: South America US Location-based Services Market Revenue Share (%), by Country 2024 & 2032
- Figure 24: Europe US Location-based Services Market Revenue (Million), by Component 2024 & 2032
- Figure 25: Europe US Location-based Services Market Revenue Share (%), by Component 2024 & 2032
- Figure 26: Europe US Location-based Services Market Revenue (Million), by Location 2024 & 2032
- Figure 27: Europe US Location-based Services Market Revenue Share (%), by Location 2024 & 2032
- Figure 28: Europe US Location-based Services Market Revenue (Million), by Application 2024 & 2032
- Figure 29: Europe US Location-based Services Market Revenue Share (%), by Application 2024 & 2032
- Figure 30: Europe US Location-based Services Market Revenue (Million), by End-User 2024 & 2032
- Figure 31: Europe US Location-based Services Market Revenue Share (%), by End-User 2024 & 2032
- Figure 32: Europe US Location-based Services Market Revenue (Million), by Country 2024 & 2032
- Figure 33: Europe US Location-based Services Market Revenue Share (%), by Country 2024 & 2032
- Figure 34: Middle East & Africa US Location-based Services Market Revenue (Million), by Component 2024 & 2032
- Figure 35: Middle East & Africa US Location-based Services Market Revenue Share (%), by Component 2024 & 2032
- Figure 36: Middle East & Africa US Location-based Services Market Revenue (Million), by Location 2024 & 2032
- Figure 37: Middle East & Africa US Location-based Services Market Revenue Share (%), by Location 2024 & 2032
- Figure 38: Middle East & Africa US Location-based Services Market Revenue (Million), by Application 2024 & 2032
- Figure 39: Middle East & Africa US Location-based Services Market Revenue Share (%), by Application 2024 & 2032
- Figure 40: Middle East & Africa US Location-based Services Market Revenue (Million), by End-User 2024 & 2032
- Figure 41: Middle East & Africa US Location-based Services Market Revenue Share (%), by End-User 2024 & 2032
- Figure 42: Middle East & Africa US Location-based Services Market Revenue (Million), by Country 2024 & 2032
- Figure 43: Middle East & Africa US Location-based Services Market Revenue Share (%), by Country 2024 & 2032
- Figure 44: Asia Pacific US Location-based Services Market Revenue (Million), by Component 2024 & 2032
- Figure 45: Asia Pacific US Location-based Services Market Revenue Share (%), by Component 2024 & 2032
- Figure 46: Asia Pacific US Location-based Services Market Revenue (Million), by Location 2024 & 2032
- Figure 47: Asia Pacific US Location-based Services Market Revenue Share (%), by Location 2024 & 2032
- Figure 48: Asia Pacific US Location-based Services Market Revenue (Million), by Application 2024 & 2032
- Figure 49: Asia Pacific US Location-based Services Market Revenue Share (%), by Application 2024 & 2032
- Figure 50: Asia Pacific US Location-based Services Market Revenue (Million), by End-User 2024 & 2032
- Figure 51: Asia Pacific US Location-based Services Market Revenue Share (%), by End-User 2024 & 2032
- Figure 52: Asia Pacific US Location-based Services Market Revenue (Million), by Country 2024 & 2032
- Figure 53: Asia Pacific US Location-based Services Market Revenue Share (%), by Country 2024 & 2032
List of Tables
- Table 1: Global US Location-based Services Market Revenue Million Forecast, by Region 2019 & 2032
- Table 2: Global US Location-based Services Market Revenue Million Forecast, by Component 2019 & 2032
- Table 3: Global US Location-based Services Market Revenue Million Forecast, by Location 2019 & 2032
- Table 4: Global US Location-based Services Market Revenue Million Forecast, by Application 2019 & 2032
- Table 5: Global US Location-based Services Market Revenue Million Forecast, by End-User 2019 & 2032
- Table 6: Global US Location-based Services Market Revenue Million Forecast, by Region 2019 & 2032
- Table 7: Global US Location-based Services Market Revenue Million Forecast, by Country 2019 & 2032
- Table 8: Northeast US Location-based Services Market Revenue (Million) Forecast, by Application 2019 & 2032
- Table 9: Southeast US Location-based Services Market Revenue (Million) Forecast, by Application 2019 & 2032
- Table 10: Midwest US Location-based Services Market Revenue (Million) Forecast, by Application 2019 & 2032
- Table 11: Southwest US Location-based Services Market Revenue (Million) Forecast, by Application 2019 & 2032
- Table 12: West US Location-based Services Market Revenue (Million) Forecast, by Application 2019 & 2032
- Table 13: Global US Location-based Services Market Revenue Million Forecast, by Component 2019 & 2032
- Table 14: Global US Location-based Services Market Revenue Million Forecast, by Location 2019 & 2032
- Table 15: Global US Location-based Services Market Revenue Million Forecast, by Application 2019 & 2032
- Table 16: Global US Location-based Services Market Revenue Million Forecast, by End-User 2019 & 2032
- Table 17: Global US Location-based Services Market Revenue Million Forecast, by Country 2019 & 2032
- Table 18: United States US Location-based Services Market Revenue (Million) Forecast, by Application 2019 & 2032
- Table 19: Canada US Location-based Services Market Revenue (Million) Forecast, by Application 2019 & 2032
- Table 20: Mexico US Location-based Services Market Revenue (Million) Forecast, by Application 2019 & 2032
- Table 21: Global US Location-based Services Market Revenue Million Forecast, by Component 2019 & 2032
- Table 22: Global US Location-based Services Market Revenue Million Forecast, by Location 2019 & 2032
- Table 23: Global US Location-based Services Market Revenue Million Forecast, by Application 2019 & 2032
- Table 24: Global US Location-based Services Market Revenue Million Forecast, by End-User 2019 & 2032
- Table 25: Global US Location-based Services Market Revenue Million Forecast, by Country 2019 & 2032
- Table 26: Brazil US Location-based Services Market Revenue (Million) Forecast, by Application 2019 & 2032
- Table 27: Argentina US Location-based Services Market Revenue (Million) Forecast, by Application 2019 & 2032
- Table 28: Rest of South America US Location-based Services Market Revenue (Million) Forecast, by Application 2019 & 2032
- Table 29: Global US Location-based Services Market Revenue Million Forecast, by Component 2019 & 2032
- Table 30: Global US Location-based Services Market Revenue Million Forecast, by Location 2019 & 2032
- Table 31: Global US Location-based Services Market Revenue Million Forecast, by Application 2019 & 2032
- Table 32: Global US Location-based Services Market Revenue Million Forecast, by End-User 2019 & 2032
- Table 33: Global US Location-based Services Market Revenue Million Forecast, by Country 2019 & 2032
- Table 34: United Kingdom US Location-based Services Market Revenue (Million) Forecast, by Application 2019 & 2032
- Table 35: Germany US Location-based Services Market Revenue (Million) Forecast, by Application 2019 & 2032
- Table 36: France US Location-based Services Market Revenue (Million) Forecast, by Application 2019 & 2032
- Table 37: Italy US Location-based Services Market Revenue (Million) Forecast, by Application 2019 & 2032
- Table 38: Spain US Location-based Services Market Revenue (Million) Forecast, by Application 2019 & 2032
- Table 39: Russia US Location-based Services Market Revenue (Million) Forecast, by Application 2019 & 2032
- Table 40: Benelux US Location-based Services Market Revenue (Million) Forecast, by Application 2019 & 2032
- Table 41: Nordics US Location-based Services Market Revenue (Million) Forecast, by Application 2019 & 2032
- Table 42: Rest of Europe US Location-based Services Market Revenue (Million) Forecast, by Application 2019 & 2032
- Table 43: Global US Location-based Services Market Revenue Million Forecast, by Component 2019 & 2032
- Table 44: Global US Location-based Services Market Revenue Million Forecast, by Location 2019 & 2032
- Table 45: Global US Location-based Services Market Revenue Million Forecast, by Application 2019 & 2032
- Table 46: Global US Location-based Services Market Revenue Million Forecast, by End-User 2019 & 2032
- Table 47: Global US Location-based Services Market Revenue Million Forecast, by Country 2019 & 2032
- Table 48: Turkey US Location-based Services Market Revenue (Million) Forecast, by Application 2019 & 2032
- Table 49: Israel US Location-based Services Market Revenue (Million) Forecast, by Application 2019 & 2032
- Table 50: GCC US Location-based Services Market Revenue (Million) Forecast, by Application 2019 & 2032
- Table 51: North Africa US Location-based Services Market Revenue (Million) Forecast, by Application 2019 & 2032
- Table 52: South Africa US Location-based Services Market Revenue (Million) Forecast, by Application 2019 & 2032
- Table 53: Rest of Middle East & Africa US Location-based Services Market Revenue (Million) Forecast, by Application 2019 & 2032
- Table 54: Global US Location-based Services Market Revenue Million Forecast, by Component 2019 & 2032
- Table 55: Global US Location-based Services Market Revenue Million Forecast, by Location 2019 & 2032
- Table 56: Global US Location-based Services Market Revenue Million Forecast, by Application 2019 & 2032
- Table 57: Global US Location-based Services Market Revenue Million Forecast, by End-User 2019 & 2032
- Table 58: Global US Location-based Services Market Revenue Million Forecast, by Country 2019 & 2032
- Table 59: China US Location-based Services Market Revenue (Million) Forecast, by Application 2019 & 2032
- Table 60: India US Location-based Services Market Revenue (Million) Forecast, by Application 2019 & 2032
- Table 61: Japan US Location-based Services Market Revenue (Million) Forecast, by Application 2019 & 2032
- Table 62: South Korea US Location-based Services Market Revenue (Million) Forecast, by Application 2019 & 2032
- Table 63: ASEAN US Location-based Services Market Revenue (Million) Forecast, by Application 2019 & 2032
- Table 64: Oceania US Location-based Services Market Revenue (Million) Forecast, by Application 2019 & 2032
- Table 65: Rest of Asia Pacific US Location-based Services Market Revenue (Million) Forecast, by Application 2019 & 2032
Frequently Asked Questions
1. What is the projected Compound Annual Growth Rate (CAGR) of the US Location-based Services Market?
The projected CAGR is approximately 14.24%.
2. Which companies are prominent players in the US Location-based Services Market?
Key companies in the market include iSpace Inc, HPE Aruba Inc, IBM Corporation, Google LLC, Cisco Systems Inc, ESRI Inc*List Not Exhaustive, DigitalGlobe Inc (Maxar Technologies), Zebra Technologies Corporation, Qaulcomm Incoporated, CenTrak.
3. What are the main segments of the US Location-based Services Market?
The market segments include Component, Location, Application, End-User.
4. Can you provide details about the market size?
The market size is estimated to be USD XX Million as of 2022.
5. What are some drivers contributing to market growth?
Surge in demand for LBS (Location-Based Service) and RTLS (Real-Time Location Systems) for industry applications; Growing Demand for Geo-based Marketing.
6. What are the notable trends driving market growth?
Indoor Location Segment is Expected to Hold Significant Share of the Market.
7. Are there any restraints impacting market growth?
High installation and maintenance cost hampers market growth.
8. Can you provide examples of recent developments in the market?
June 2023: The Air Force Research Laboratory (AFRL) formed a strategic partnership with Luminous Cyber Corp. to develop a highly resilient alternative to GPS. This initiative is aimed at addressing regions where GPS coverage is unreliable or susceptible to interference from malicious actors. Luminous Cyber Corp. specializes in the development of Alternative-Position Navigation and Timing (A-PNT) solutions for various applications, including crewed and uncrewed orbital, avionic, marine, and mounted land-based systems.
9. What pricing options are available for accessing the report?
Pricing options include single-user, multi-user, and enterprise licenses priced at USD 3800, USD 4500, and USD 5800 respectively.
10. Is the market size provided in terms of value or volume?
The market size is provided in terms of value, measured in Million.
11. Are there any specific market keywords associated with the report?
Yes, the market keyword associated with the report is "US Location-based Services Market," which aids in identifying and referencing the specific market segment covered.
12. How do I determine which pricing option suits my needs best?
The pricing options vary based on user requirements and access needs. Individual users may opt for single-user licenses, while businesses requiring broader access may choose multi-user or enterprise licenses for cost-effective access to the report.
13. Are there any additional resources or data provided in the US Location-based Services Market report?
While the report offers comprehensive insights, it's advisable to review the specific contents or supplementary materials provided to ascertain if additional resources or data are available.
14. How can I stay updated on further developments or reports in the US Location-based Services Market?
To stay informed about further developments, trends, and reports in the US Location-based Services Market, consider subscribing to industry newsletters, following relevant companies and organizations, or regularly checking reputable industry news sources and publications.
Methodology
Step 1 - Identification of Relevant Samples Size from Population Database


Step 2 - Approaches for Defining Global Market Size (Value, Volume* & Price*)

Note*: In applicable scenarios
Step 3 - Data Sources
Primary Research
- Web Analytics
- Survey Reports
- Research Institute
- Latest Research Reports
- Opinion Leaders
Secondary Research
- Annual Reports
- White Paper
- Latest Press Release
- Industry Association
- Paid Database
- Investor Presentations

Step 4 - Data Triangulation
Involves using different sources of information in order to increase the validity of a study
These sources are likely to be stakeholders in a program - participants, other researchers, program staff, other community members, and so on.
Then we put all data in single framework & apply various statistical tools to find out the dynamic on the market.
During the analysis stage, feedback from the stakeholder groups would be compared to determine areas of agreement as well as areas of divergence
