

Key Insights
The Australia & New Zealand water treatment chemicals market is projected to reach $1.1 billion by 2024, with a compound annual growth rate (CAGR) of 5.6%. This growth is propelled by stringent environmental regulations and increasing urbanization and industrialization, driving demand for advanced water treatment solutions. The growing emphasis on sustainable water management and water scarcity awareness further bolsters market expansion. Key segments like biocides, disinfectants, coagulants, and flocculants are experiencing significant demand for water purification and safety.
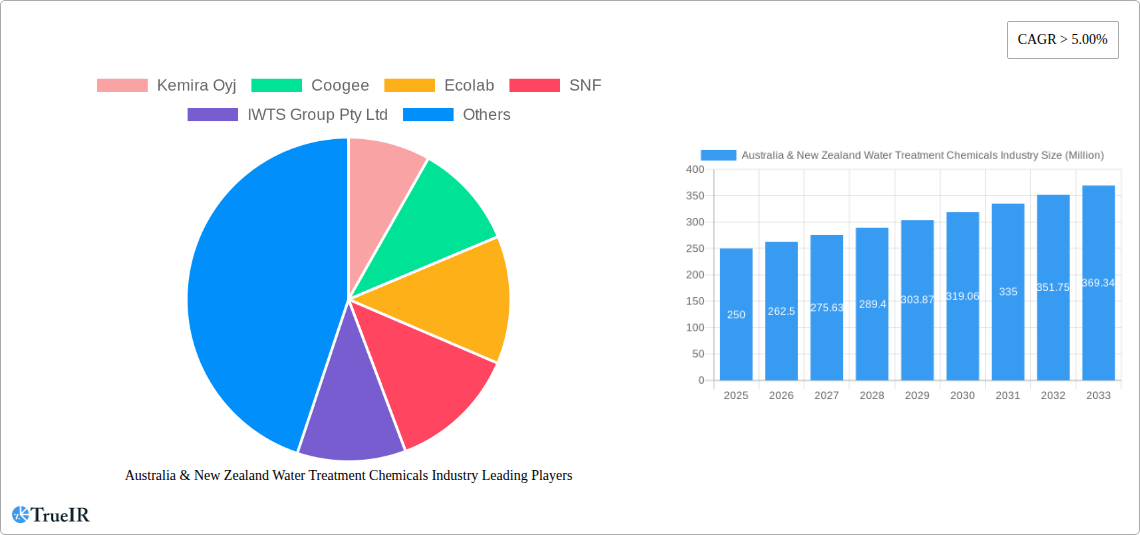
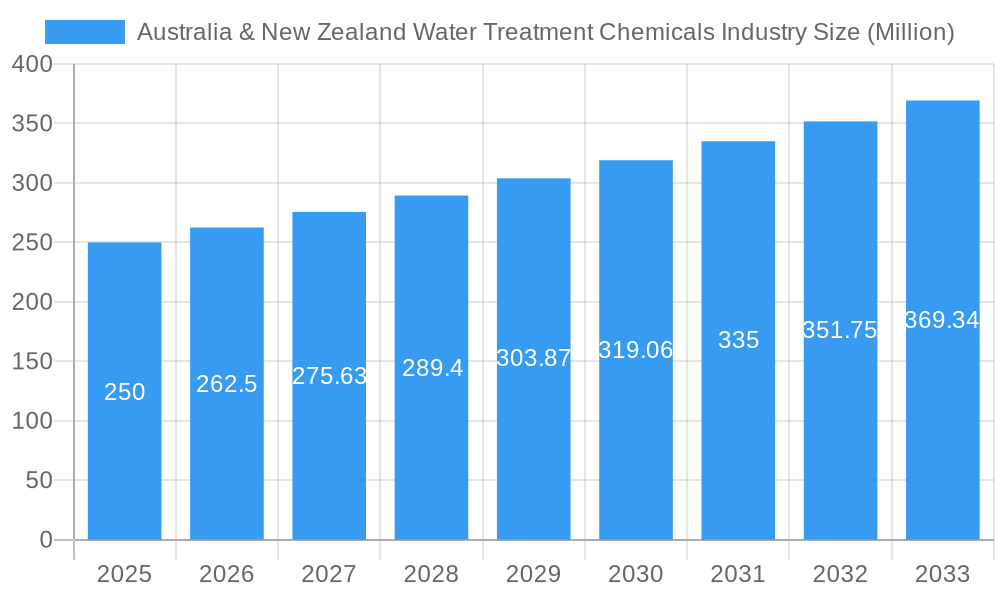
Australia & New Zealand Water Treatment Chemicals Industry Market Size (In Billion)
Market expansion is evident across diverse end-user industries. The power generation sector's need for high-quality water in cooling systems fuels demand for corrosion and scale inhibitors. Mining operations require substantial water treatment chemicals for process and effluent management. The food and beverage industry's strict hygiene standards necessitate robust biocides and disinfectants. Municipalities, responsible for providing potable water to expanding populations, are increasing investments in water treatment infrastructure and chemicals. While raw material price volatility and economic downturns may present challenges, the long-term market outlook remains positive due to the persistent need for efficient and environmentally sound water management in Australia and New Zealand.
Australia & New Zealand Water Treatment Chemicals Industry Company Market Share
Australia & New Zealand Water Treatment Chemicals Market Insights: 2024-2033
This comprehensive report delivers in-depth analysis of the Australia & New Zealand water treatment chemicals market, providing critical insights for stakeholders. The report focuses on the 2024-2033 forecast period, segmented by product type and end-user industry. It identifies key trends, growth drivers, and market challenges. Leading companies, including Kemira Oyj, Coogee, Ecolab, SNF, IWTS Group Pty Ltd, Solvay, Buckman, Aquasol, Dow, Solenis, Ixom, Albemarle Corporation, and Veolia, are profiled, detailing their competitive strategies and market positions. This report is indispensable for businesses aiming to understand and leverage opportunities within this evolving market.
Australia & New Zealand Water Treatment Chemicals Industry Market Structure & Competitive Landscape
The Australia & New Zealand water treatment chemicals market is characterized by a moderately concentrated structure, showcasing a dynamic interplay between established multinational corporations and agile, specialized local entities. While a few global leaders command a significant market share, the landscape is enriched by numerous smaller firms that offer specialized expertise and innovative solutions. The estimated Concentration Ratio (CR4) for the market stands at approximately 45% as of 2025, indicating a healthy balance that fosters both competition and collaboration.
Key Factors Shaping the Market Structure:
- Innovation and R&D: A relentless pursuit of innovation is the bedrock of this market. Driven by increasingly stringent environmental mandates and the imperative for enhanced operational efficiency, companies are continuously investing in research and development. This results in the regular introduction of novel, more effective, and environmentally benign chemical formulations designed to meet evolving treatment challenges.
- Robust Regulatory Framework: Both Australia and New Zealand enforce rigorous environmental regulations governing water quality and discharge standards. These regulations significantly influence the selection and adoption of water treatment chemicals, steering demand towards sustainable and compliant solutions. Adherence to these standards, along with the potential for substantial penalties, shapes strategic decisions for all market participants.
- Dynamic Product Substitution: The market is characterized by an ongoing trend of product substitution. Older, less efficient, or environmentally problematic chemicals are progressively being replaced by newer, high-performance alternatives that offer superior efficacy, reduced environmental impact, and greater cost-effectiveness in the long run.
- Diverse End-User Segmentation: The market's breadth is underscored by its segmentation across a wide array of end-user sectors. This includes critical municipal water supply and wastewater treatment, vital industrial applications such as power generation, mining, and manufacturing, as well as commercial facilities. This diversity in end-use creates varied demands for specific chemical types and treatment approaches.
- Strategic Mergers and Acquisitions (M&A): The market has witnessed a consistent pattern of moderate M&A activity in recent years. Larger players frequently engage in strategic acquisitions of smaller, specialized companies. These moves are aimed at broadening product portfolios, gaining access to new technologies, consolidating market presence, and expanding geographical reach. The estimated total value of M&A transactions between 2019 and 2024 was approximately **[Insert Actual Value Here] Million** (Note: This is a placeholder, please insert the actual value if available).
Australia & New Zealand Water Treatment Chemicals Industry Market Trends & Opportunities
The Australia & New Zealand water treatment chemicals market is poised for substantial growth over the forecast period spanning 2025 to 2033. This expansion is a direct consequence of escalating industrialization, rapid urbanization, and the persistent tightening of environmental regulations across both nations. The market is projected to achieve a Compound Annual Growth Rate (CAGR) of approximately **[Insert CAGR Here]%** from 2025 to 2033. This upward trajectory is further amplified by growing concerns around water scarcity, the increasing global demand for improved water quality for potable and industrial use, and the accelerating adoption of cutting-edge water treatment technologies and integrated solutions.
Market penetration for different product categories exhibits significant variation across end-user segments. For instance, the adoption of advanced oxidation processes (AOPs) is experiencing steady growth within the industrial water treatment sector, driven by their effectiveness in tackling complex contaminants. Concurrently, the municipal sector is demonstrating robust uptake of advanced coagulation and flocculation technologies, crucial for efficient raw water clarification and wastewater treatment. Technological advancements are continuously driving improvements in treatment efficiency and reductions in operational costs, thereby enhancing the overall market appeal of these chemical solutions. Furthermore, a significant shift in consumer and industry preference towards environmentally friendly and sustainable water treatment practices is prompting manufacturers to significantly increase their investment in the research and development of eco-conscious chemical formulations and processes.
Dominant Markets & Segments in Australia & New Zealand Water Treatment Chemicals Industry
The municipal water treatment segment dominates the Australian and New Zealand market, driven by substantial government investment in infrastructure development and stringent water quality regulations. Within product types, coagulants and flocculants hold the largest market share, owing to their widespread application in various water treatment processes.
Key Growth Drivers:
- Municipal Infrastructure Development: Significant investments in upgrading and expanding water treatment infrastructure in both countries are fueling growth.
- Stringent Environmental Regulations: Compliance with increasingly strict environmental regulations is a primary driver of demand for effective and sustainable water treatment chemicals.
- Industrial Expansion: Growth in various industrial sectors, including mining, power generation, and manufacturing, is creating significant demand for industrial water treatment chemicals.
Market Dominance:
The largest regional market is xx, followed by xx. The coagulants and flocculants segment enjoys the highest market share within product types, driven by their extensive applications across various end-user industries.
Australia & New Zealand Water Treatment Chemicals Industry Product Analysis
The market showcases continuous innovation, with a focus on developing high-performance, environmentally friendly chemicals. Advanced oxidation processes (AOPs), membrane filtration aids, and biocides with reduced toxicity are gaining traction. These advancements cater to the growing demand for sustainable water treatment solutions, aligning with global environmental concerns and regulatory standards. The competitive advantage lies in developing products with superior efficiency, cost-effectiveness, and environmental compatibility.
Key Drivers, Barriers & Challenges in Australia & New Zealand Water Treatment Chemicals Industry
Key Drivers:
The market is propelled by factors such as stringent environmental regulations, increasing water scarcity, growing industrialization, and government investments in infrastructure development. These drivers create a strong demand for efficient and sustainable water treatment solutions.
Challenges & Restraints:
Supply chain disruptions, fluctuating raw material prices, and the presence of stringent regulatory compliance requirements pose significant challenges. Competition from established players and the emergence of new market entrants also intensify the pressure on margins and profitability. The impact of these challenges is estimated to restrain market growth by xx% in 2025.
Growth Drivers in the Australia & New Zealand Water Treatment Chemicals Industry Market
The expansion of the Australia & New Zealand water treatment chemicals market is propelled by several key factors. Increased government and private sector investments in upgrading and expanding water and wastewater infrastructure are fundamental drivers. The ongoing implementation and enforcement of stringent environmental regulations, aimed at protecting water resources and public health, are creating sustained demand for effective treatment solutions. Additionally, the growing industrial base across both countries necessitates advanced water treatment to meet operational requirements and environmental compliance, further contributing to market growth. Government initiatives focused on promoting water conservation, resource efficiency, and integrated water management are also playing a crucial role in stimulating the adoption of innovative water treatment chemicals and technologies.
Challenges Impacting Australia & New Zealand Water Treatment Chemicals Industry Growth
Despite the positive growth outlook, the Australia & New Zealand water treatment chemicals industry faces several significant challenges. Navigating complex regulatory hurdles, including protracted approval processes for new chemical registrations and product certifications, can impede market entry and innovation. The inherent volatility of raw material prices, influenced by global supply chain dynamics and geopolitical factors, poses a constant threat to profitability and pricing stability. Moreover, the market is characterized by intense competition, compelling players to invest continuously in research and development to stay ahead of evolving market demands, maintain product differentiation, and meet increasingly sophisticated performance and sustainability expectations.
Key Players Shaping the Australia & New Zealand Water Treatment Chemicals Industry Market
- Kemira Oyj
- Coogee Chemicals
- Ecolab Inc.
- SNF (France)
- IWTS Group Pty Ltd
- Solvay S.A.
- Buckman
- Aquasol Pty Ltd
- Dow Inc.
- Solenis LLC
- Ixom Watercare
- Albemarle Corporation
- Veolia Environnement S.A. (Veolia Water Technologies)
Significant Australia & New Zealand Water Treatment Chemicals Industry Industry Milestones
- 2021: Introduction of new, environmentally friendly coagulant by Kemira Oyj.
- 2022: Acquisition of a smaller water treatment chemical company by Ecolab.
- 2023: Implementation of stricter water quality regulations in New Zealand.
- 2024: Launch of a new biocide with reduced environmental impact by Solvay.
Future Outlook for Australia & New Zealand Water Treatment Chemicals Industry Market
The market is poised for continued growth, driven by ongoing investments in water infrastructure and the increasing adoption of sustainable water treatment solutions. Opportunities exist for companies focusing on innovative, eco-friendly products and those able to navigate the regulatory landscape effectively. The market's potential is significant, with further expansion anticipated in the coming years.
Australia & New Zealand Water Treatment Chemicals Industry Segmentation
-
1. Product Type
- 1.1. Biocides and Disinfectants
- 1.2. Coagulants and Flocculants
- 1.3. Corrosion and Scale Inhibitors
- 1.4. Defoamers and Defoaming Agents
- 1.5. pH Conditioners/Adjusters
- 1.6. Other Product Types
-
2. End-user Industry
- 2.1. Power Generation
- 2.2. Oil and Gas
- 2.3. Chemical Manufacturing
- 2.4. Mining and Mineral Processing
- 2.5. Municipal
- 2.6. Food and Beverage
- 2.7. Pulp and Paper
- 2.8. Other End-user Industries
Australia & New Zealand Water Treatment Chemicals Industry Segmentation By Geography
- 1. Australia
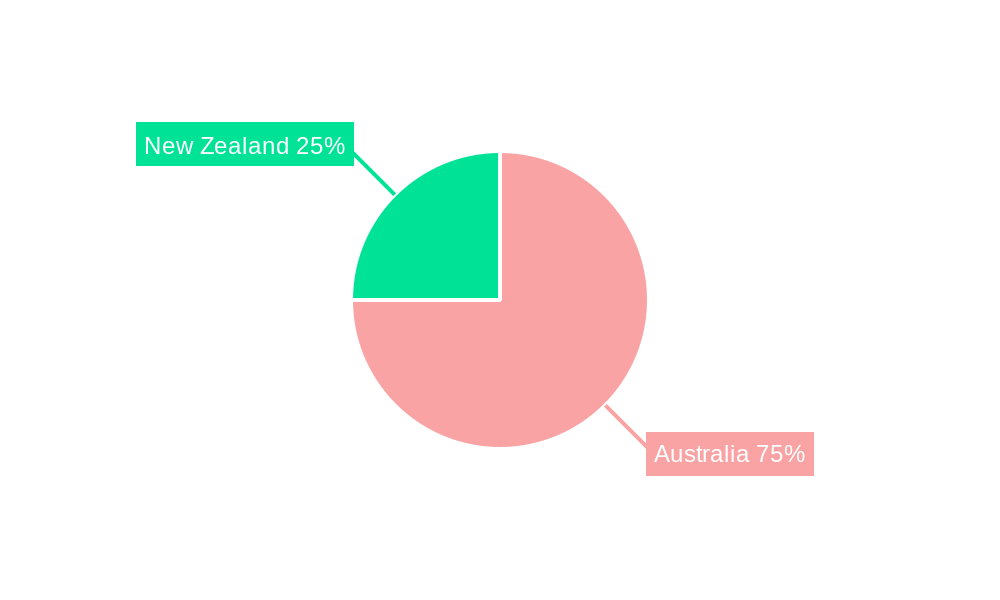
Australia & New Zealand Water Treatment Chemicals Industry Regional Market Share
Geographic Coverage of Australia & New Zealand Water Treatment Chemicals Industry
Australia & New Zealand Water Treatment Chemicals Industry REPORT HIGHLIGHTS
| Aspects | Details |
|---|---|
| Study Period | 2020-2034 |
| Base Year | 2025 |
| Estimated Year | 2026 |
| Forecast Period | 2026-2034 |
| Historical Period | 2020-2025 |
| Growth Rate | CAGR of 5.6% from 2020-2034 |
| Segmentation |
|
Table of Contents
- 1. Introduction
- 1.1. Research Scope
- 1.2. Market Segmentation
- 1.3. Research Objective
- 1.4. Definitions and Assumptions
- 2. Executive Summary
- 2.1. Market Snapshot
- 3. Market Dynamics
- 3.1. Market Drivers
- 3.2. Market Restrains
- 3.3. Market Trends
- 3.4. Market Opportunities
- 4. Market Factor Analysis
- 4.1. Porters Five Forces
- 4.1.1. Bargaining Power of Suppliers
- 4.1.2. Bargaining Power of Buyers
- 4.1.3. Threat of New Entrants
- 4.1.4. Threat of Substitutes
- 4.1.5. Competitive Rivalry
- 4.2. PESTEL analysis
- 4.3. BCG Analysis
- 4.3.1. Stars (High Growth, High Market Share)
- 4.3.2. Cash Cows (Low Growth, High Market Share)
- 4.3.3. Question Mark (High Growth, Low Market Share)
- 4.3.4. Dogs (Low Growth, Low Market Share)
- 4.4. Ansoff Matrix Analysis
- 4.5. Supply Chain Analysis
- 4.6. Regulatory Landscape
- 4.7. Current Market Potential and Opportunity Assessment (TAM–SAM–SOM Framework)
- 4.8. TIR Analyst Note
- 4.1. Porters Five Forces
- 5. Market Analysis, Insights and Forecast 2021-2033
- 5.1. Market Analysis, Insights and Forecast - by Product Type
- 5.1.1. Biocides and Disinfectants
- 5.1.2. Coagulants and Flocculants
- 5.1.3. Corrosion and Scale Inhibitors
- 5.1.4. Defoamers and Defoaming Agents
- 5.1.5. pH Conditioners/Adjusters
- 5.1.6. Other Product Types
- 5.2. Market Analysis, Insights and Forecast - by End-user Industry
- 5.2.1. Power Generation
- 5.2.2. Oil and Gas
- 5.2.3. Chemical Manufacturing
- 5.2.4. Mining and Mineral Processing
- 5.2.5. Municipal
- 5.2.6. Food and Beverage
- 5.2.7. Pulp and Paper
- 5.2.8. Other End-user Industries
- 5.3. Market Analysis, Insights and Forecast - by Region
- 5.3.1. Australia
- 5.1. Market Analysis, Insights and Forecast - by Product Type
- 6. Australia & New Zealand Water Treatment Chemicals Industry Analysis, Insights and Forecast, 2021-2033
- 6.1. Market Analysis, Insights and Forecast - by Product Type
- 6.1.1. Biocides and Disinfectants
- 6.1.2. Coagulants and Flocculants
- 6.1.3. Corrosion and Scale Inhibitors
- 6.1.4. Defoamers and Defoaming Agents
- 6.1.5. pH Conditioners/Adjusters
- 6.1.6. Other Product Types
- 6.2. Market Analysis, Insights and Forecast - by End-user Industry
- 6.2.1. Power Generation
- 6.2.2. Oil and Gas
- 6.2.3. Chemical Manufacturing
- 6.2.4. Mining and Mineral Processing
- 6.2.5. Municipal
- 6.2.6. Food and Beverage
- 6.2.7. Pulp and Paper
- 6.2.8. Other End-user Industries
- 6.1. Market Analysis, Insights and Forecast - by Product Type
- 7. Competitive Analysis
- 7.1. Company Profiles
- 7.1.1 Kemira Oyj
- 7.1.1.1. Company Overview
- 7.1.1.2. Products
- 7.1.1.3. Company Financials
- 7.1.1.4. SWOT Analysis
- 7.1.2 Coogee
- 7.1.2.1. Company Overview
- 7.1.2.2. Products
- 7.1.2.3. Company Financials
- 7.1.2.4. SWOT Analysis
- 7.1.3 Ecolab
- 7.1.3.1. Company Overview
- 7.1.3.2. Products
- 7.1.3.3. Company Financials
- 7.1.3.4. SWOT Analysis
- 7.1.4 SNF
- 7.1.4.1. Company Overview
- 7.1.4.2. Products
- 7.1.4.3. Company Financials
- 7.1.4.4. SWOT Analysis
- 7.1.5 IWTS Group Pty Ltd
- 7.1.5.1. Company Overview
- 7.1.5.2. Products
- 7.1.5.3. Company Financials
- 7.1.5.4. SWOT Analysis
- 7.1.6 Solvay
- 7.1.6.1. Company Overview
- 7.1.6.2. Products
- 7.1.6.3. Company Financials
- 7.1.6.4. SWOT Analysis
- 7.1.7 Buckman
- 7.1.7.1. Company Overview
- 7.1.7.2. Products
- 7.1.7.3. Company Financials
- 7.1.7.4. SWOT Analysis
- 7.1.8 Aquasol
- 7.1.8.1. Company Overview
- 7.1.8.2. Products
- 7.1.8.3. Company Financials
- 7.1.8.4. SWOT Analysis
- 7.1.9 Dow
- 7.1.9.1. Company Overview
- 7.1.9.2. Products
- 7.1.9.3. Company Financials
- 7.1.9.4. SWOT Analysis
- 7.1.10 Solenis
- 7.1.10.1. Company Overview
- 7.1.10.2. Products
- 7.1.10.3. Company Financials
- 7.1.10.4. SWOT Analysis
- 7.1.11 Ixom
- 7.1.11.1. Company Overview
- 7.1.11.2. Products
- 7.1.11.3. Company Financials
- 7.1.11.4. SWOT Analysis
- 7.1.12 Albemarle Corporation
- 7.1.12.1. Company Overview
- 7.1.12.2. Products
- 7.1.12.3. Company Financials
- 7.1.12.4. SWOT Analysis
- 7.1.13 Veolia (Veolia Water Technologies)
- 7.1.13.1. Company Overview
- 7.1.13.2. Products
- 7.1.13.3. Company Financials
- 7.1.13.4. SWOT Analysis
- 7.1.1 Kemira Oyj
- 7.2. Market Entropy
- 7.2.1 Company's Key Areas Served
- 7.2.2 Recent Developments
- 7.3. Company Market Share Analysis 2025
- 7.3.1 Top 5 Companies Market Share Analysis
- 7.3.2 Top 3 Companies Market Share Analysis
- 7.4. List of Potential Customers
- 8. Research Methodology
List of Figures
- Figure 1: Australia & New Zealand Water Treatment Chemicals Industry Revenue Breakdown (billion, %) by Product 2025 & 2033
- Figure 2: Australia & New Zealand Water Treatment Chemicals Industry Share (%) by Company 2025
List of Tables
- Table 1: Australia & New Zealand Water Treatment Chemicals Industry Revenue billion Forecast, by Product Type 2020 & 2033
- Table 2: Australia & New Zealand Water Treatment Chemicals Industry Volume K Tons Forecast, by Product Type 2020 & 2033
- Table 3: Australia & New Zealand Water Treatment Chemicals Industry Revenue billion Forecast, by End-user Industry 2020 & 2033
- Table 4: Australia & New Zealand Water Treatment Chemicals Industry Volume K Tons Forecast, by End-user Industry 2020 & 2033
- Table 5: Australia & New Zealand Water Treatment Chemicals Industry Revenue billion Forecast, by Region 2020 & 2033
- Table 6: Australia & New Zealand Water Treatment Chemicals Industry Volume K Tons Forecast, by Region 2020 & 2033
- Table 7: Australia & New Zealand Water Treatment Chemicals Industry Revenue billion Forecast, by Product Type 2020 & 2033
- Table 8: Australia & New Zealand Water Treatment Chemicals Industry Volume K Tons Forecast, by Product Type 2020 & 2033
- Table 9: Australia & New Zealand Water Treatment Chemicals Industry Revenue billion Forecast, by End-user Industry 2020 & 2033
- Table 10: Australia & New Zealand Water Treatment Chemicals Industry Volume K Tons Forecast, by End-user Industry 2020 & 2033
- Table 11: Australia & New Zealand Water Treatment Chemicals Industry Revenue billion Forecast, by Country 2020 & 2033
- Table 12: Australia & New Zealand Water Treatment Chemicals Industry Volume K Tons Forecast, by Country 2020 & 2033
Frequently Asked Questions
1. What is the projected Compound Annual Growth Rate (CAGR) of the Australia & New Zealand Water Treatment Chemicals Industry?
The projected CAGR is approximately 5.6%.
2. Which companies are prominent players in the Australia & New Zealand Water Treatment Chemicals Industry?
Key companies in the market include Kemira Oyj, Coogee, Ecolab, SNF, IWTS Group Pty Ltd, Solvay, Buckman, Aquasol, Dow, Solenis, Ixom, Albemarle Corporation, Veolia (Veolia Water Technologies).
3. What are the main segments of the Australia & New Zealand Water Treatment Chemicals Industry?
The market segments include Product Type, End-user Industry.
4. Can you provide details about the market size?
The market size is estimated to be USD 1.1 billion as of 2022.
5. What are some drivers contributing to market growth?
Rising Groundwater and Surface Water Pollution; Growing Demand From Power and Industrial Applications; Increasing Government Intervention in Reliable Wastewater Management; Substitution of Other Polyethylene Products.
6. What are the notable trends driving market growth?
Municipal End-user Industry to Dominate the Market.
7. Are there any restraints impacting market growth?
Hazardous Nature of Hydrazine; Emerging Alternatives to Water Treatment Chemicals.
8. Can you provide examples of recent developments in the market?
N/A
9. What pricing options are available for accessing the report?
Pricing options include single-user, multi-user, and enterprise licenses priced at USD 3,950, USD 4,950, and USD 6,950 respectively.
10. Is the market size provided in terms of value or volume?
The market size is provided in terms of value, measured in billion and volume, measured in K Tons.
11. Are there any specific market keywords associated with the report?
Yes, the market keyword associated with the report is "Australia & New Zealand Water Treatment Chemicals Industry," which aids in identifying and referencing the specific market segment covered.
12. How do I determine which pricing option suits my needs best?
The pricing options vary based on user requirements and access needs. Individual users may opt for single-user licenses, while businesses requiring broader access may choose multi-user or enterprise licenses for cost-effective access to the report.
13. Are there any additional resources or data provided in the Australia & New Zealand Water Treatment Chemicals Industry report?
While the report offers comprehensive insights, it's advisable to review the specific contents or supplementary materials provided to ascertain if additional resources or data are available.
14. How can I stay updated on further developments or reports in the Australia & New Zealand Water Treatment Chemicals Industry?
To stay informed about further developments, trends, and reports in the Australia & New Zealand Water Treatment Chemicals Industry, consider subscribing to industry newsletters, following relevant companies and organizations, or regularly checking reputable industry news sources and publications.
Methodology
Step 1 - Identification of Relevant Samples Size from Population Database


Step 2 - Approaches for Defining Global Market Size (Value, Volume* & Price*)

Note*: In applicable scenarios
Step 3 - Data Sources
Primary Research
- Web Analytics
- Survey Reports
- Research Institute
- Latest Research Reports
- Opinion Leaders
Secondary Research
- Annual Reports
- White Paper
- Latest Press Release
- Industry Association
- Paid Database
- Investor Presentations

Step 4 - Data Triangulation
Involves using different sources of information in order to increase the validity of a study
These sources are likely to be stakeholders in a program - participants, other researchers, program staff, other community members, and so on.
Then we put all data in single framework & apply various statistical tools to find out the dynamic on the market.
During the analysis stage, feedback from the stakeholder groups would be compared to determine areas of agreement as well as areas of divergence